C++ Examples
These are fully independent, compilable examples. There is significant overlap in the examples, but they are each intended to illustrate a different concept and be fully stand alone compilable.
VTK Classes Summary
This Python script, SelectExamples, will let you select examples based on a VTK Class and language. It requires Python 3.7 or later. The following tables will produce similar information.
-
VTK Classes with Examples, this table is really useful when searching for example(s) using a particular class.
-
VTK Classes with No Examples, please add examples in your area of expertise!
Tutorials
If you are new to VTK then these tutorials will help to get you started.
Hello World
| Example Name | Description | Image |
|---|---|---|
| A hello world example | Cylinder example from the VTK Textbook and source code. A hello world example. |  |
Simple Operations
| Example Name | Description | Image |
|---|---|---|
| DistanceBetweenPoints | Distance between two points. | |
| DistancePointToLine | Distance between a point and a line. | |
| FloatingPointExceptions | Floating Point Exceptions | |
| GaussianRandomNumber | Generates Gaussian random numbers. | |
| PerspectiveTransform | Apply a perspective transformation to a point. | |
| ProjectPointPlane | Project a point onto a plane. | |
| RandomSequence | This is the preferred way to generate random numbers. | |
| UniformRandomNumber | Generates uniform random numbers. |
Input and Output
Graph Formats
3D File Formats
| Example Name | Description | Image |
|---|---|---|
| ConvertFile | Convert a file from one type to another | |
| XGMLReader | Read a .gml file |  |
Standard Formats
Input
| Example Name | Description | Image |
|---|---|---|
| DEMReader | Read DEM (elevation map) files |  |
| DelimitedTextReader | Read a delimited file into a polydata. |  |
| DumpXMLFile | Report the contents of a VTK XML or legacy file | |
| IndividualVRML | This example is used to get each actor and object from a scene and verify axes correspondence |  |
| ParticleReader | This example reads ASCII files where each line consists of points with its position (x,y,z) and (optionally) one scalar or binary files in RAW 3d file format. |  |
| ReadAllPolyDataTypes | Read any VTK polydata file. |  |
| ReadAllPolyDataTypesDemo | Read all VTK polydata file types. |  |
| ReadAllUnstructuredGridTypes | Read any VTK unstructuredgrid file. |  |
| ReadCML | Read Chemistry Markup Language files. |  |
| ReadExodusData | Read and view ExodusII data. |  |
| ReadOBJ | Read an OBJ (.obj) file. |  |
| ReadPDB | Read Protein Data Bank Files. |  |
| ReadPLOT3D | Read CFD (computational fluid dynamics) data produced by PLOT3D. |  |
| ReadPLY | Read PLY (.ply) files |  |
| ReadPlainTextTriangles | Read a plain text file into a polydata. | |
| ReadSLC | Read VolVis file. |  |
| ReadSTL | Read stereo lithography STL (.stl) files |  |
| ReadTextFile | Read a plain text file into a polydata. |  |
| SimplePointsReader | Read a simple "xyz" file of points. |  |
| TransientHDFReader | Read transient data written inside a vtkhdf file. | |
Importers
| Example Name | Description | Image |
|---|---|---|
| 3DSImporter | Import a 3D Studio scene that includes multiple actors. |  |
| GLTFImporter | Import a glTF scene. |  |
| ImportPolyDataScene | Import a polydata scene using multiblock datasets. |  |
| OBJImporter | Import an OBJ scene that includes actors, materials and textures. |  |
| VRMLImporter | Import a VRML 2.0 (WRL) file. |  |
| VRMLImporterDemo | Import a VRML 2.0 (WRL) file and add normals if necessary. |  |
Output
| Example Name | Description | Image |
|---|---|---|
| DelimitedTextWriter | Write data to a delimited file | |
| SimplePointsWriter | Write a simple ".xyz" file | |
| WritePLY | Write PLY (.ply) files |  |
| WriteSTL | Write stereo lithography STL (.stl) files |  |
Exporters
| Example Name | Description | Image |
|---|---|---|
| ExportPolyDataScene | Export a polydata scene using multiblock datasets. |  |
VTK Formats
Input
| Example Name | Description | Image |
|---|---|---|
| ReadImageData | Read a image data (.vti) file |  |
| ReadPolyData | Read a polygonal data (.vtp) file |  |
| ReadRectilinearGrid | Read a rectilinear grid (.vtr) file |  |
| ReadStructuredGrid | Read a structured grid (.vts) file |  |
| ReadUnknownTypeXMLFile | Read an XML file and later decide what kind it is |  |
| ReadUnstructuredGrid | Read an unstructured grid (.vtu) file |  |
Output
| Example Name | Description | Image |
|---|---|---|
| ExodusIIWriter | Write a time varying ExodusII file. | |
| WriteVTI | Write a .vti file. VTI is an "ImageData". |  |
| WriteVTP | Write a .vtp file. VTP is a "PolyData". This format allows for the most complex geometric objects to be stored. | |
| WriteVTU | Write a .vtu file. VTU is an "Unstructured Grid". This format allows for 3D data to be stored. |  |
| XMLPImageDataWriter | Write a .pvti file with 4 .vti pieces. | |
| XMLPUnstructuredGridWriter | Write a .pvtu with 4 .vtu pieces. | |
| XMLStructuredGridWriter | Write a .vts file from a vtkStructuredGrid. |
Legacy VTK Formats
| Example Name | Description | Image |
|---|---|---|
| GenericDataObjectReader | Read any type of legacy .vtk file. | |
| ReadLegacyUnstructuredGrid | Read an unstructured grid that contains 11 linear cells. |  |
| StructuredGridReader | Read a structured grid (.vtk) file. |  |
| StructuredPointsReader | Read a structured points (.vtk) file. |  |
| WriteLegacyLinearCells | Write each linear cell into a legacy UnstructuredGrid file. | |
| WriteXMLLinearCells | Write each linear cell into an XML UnstructuredGrid file (.vtu). |
Image Format
Input
| Example Name | Description | Image |
|---|---|---|
| HDRReader | Read a high-dynamic-range imaging file. |  |
| ImageReader2Factory | This class tries to find an appropriate reader. It is very convenient to use this when you don't know what kind of file to expect. |  |
| JPEGReader | Read a JPEG image. |  |
| MetaImageReader | Read .mha files. |  |
| PNGReader | Read a PNG image. |  |
| ReadBMP | Read BMP (.bmp) files. |  |
| ReadDICOM | Read DICOM file |  |
| ReadDICOMSeries | This example demonstrates how to read a series of DICOM images and scroll through slices |  |
| ReadPNM | Read PNM (.pnm) files. |  |
| ReadTIFF | Read TIFF (.tif) files. |  |
Output
| Example Name | Description | Image |
|---|---|---|
| ImageWriter | Write an imagefile based on the file extension. |  |
| JPEGWriter | Write a JPEG (.jpg) file. | |
| MetaImageWriter | Write a .mha/.mhd + .raw file. |  |
| PNGWriter | Write a PNG (.png) file. | |
| WriteBMP | Write a BMP (.bmp) file. |  |
| WritePNM | Write a PNM (.pnm) file. |  |
| WriteTIFF | Write a TIFF (.tif) file. |  |
Geometric Objects
| Example Name | Description | Image |
|---|---|---|
| Axes |  | |
| ColoredLines |  | |
| Cube | Manually build a polygonal cube. |  |
| Cube1 | A nice simple example that demonstrates the operation of the VTK pipeline. |  |
| Dodecahedron | Create a dodecahedron using vtkPolyhedron. |  |
| EllipticalCylinder | Create an elliptical cylinder using extrusion. |  |
| EllipticalCylinderDemo | Show the base and extrusion vector. |  |
| GeometricObjectsDemo | A demonstration of all geometric objects that work the same way. |  |
| OpenVRFrustum | VTK + OpenVR Example. |  |
| OpenVROrientedArrow | VTK + OpenVR Example. | 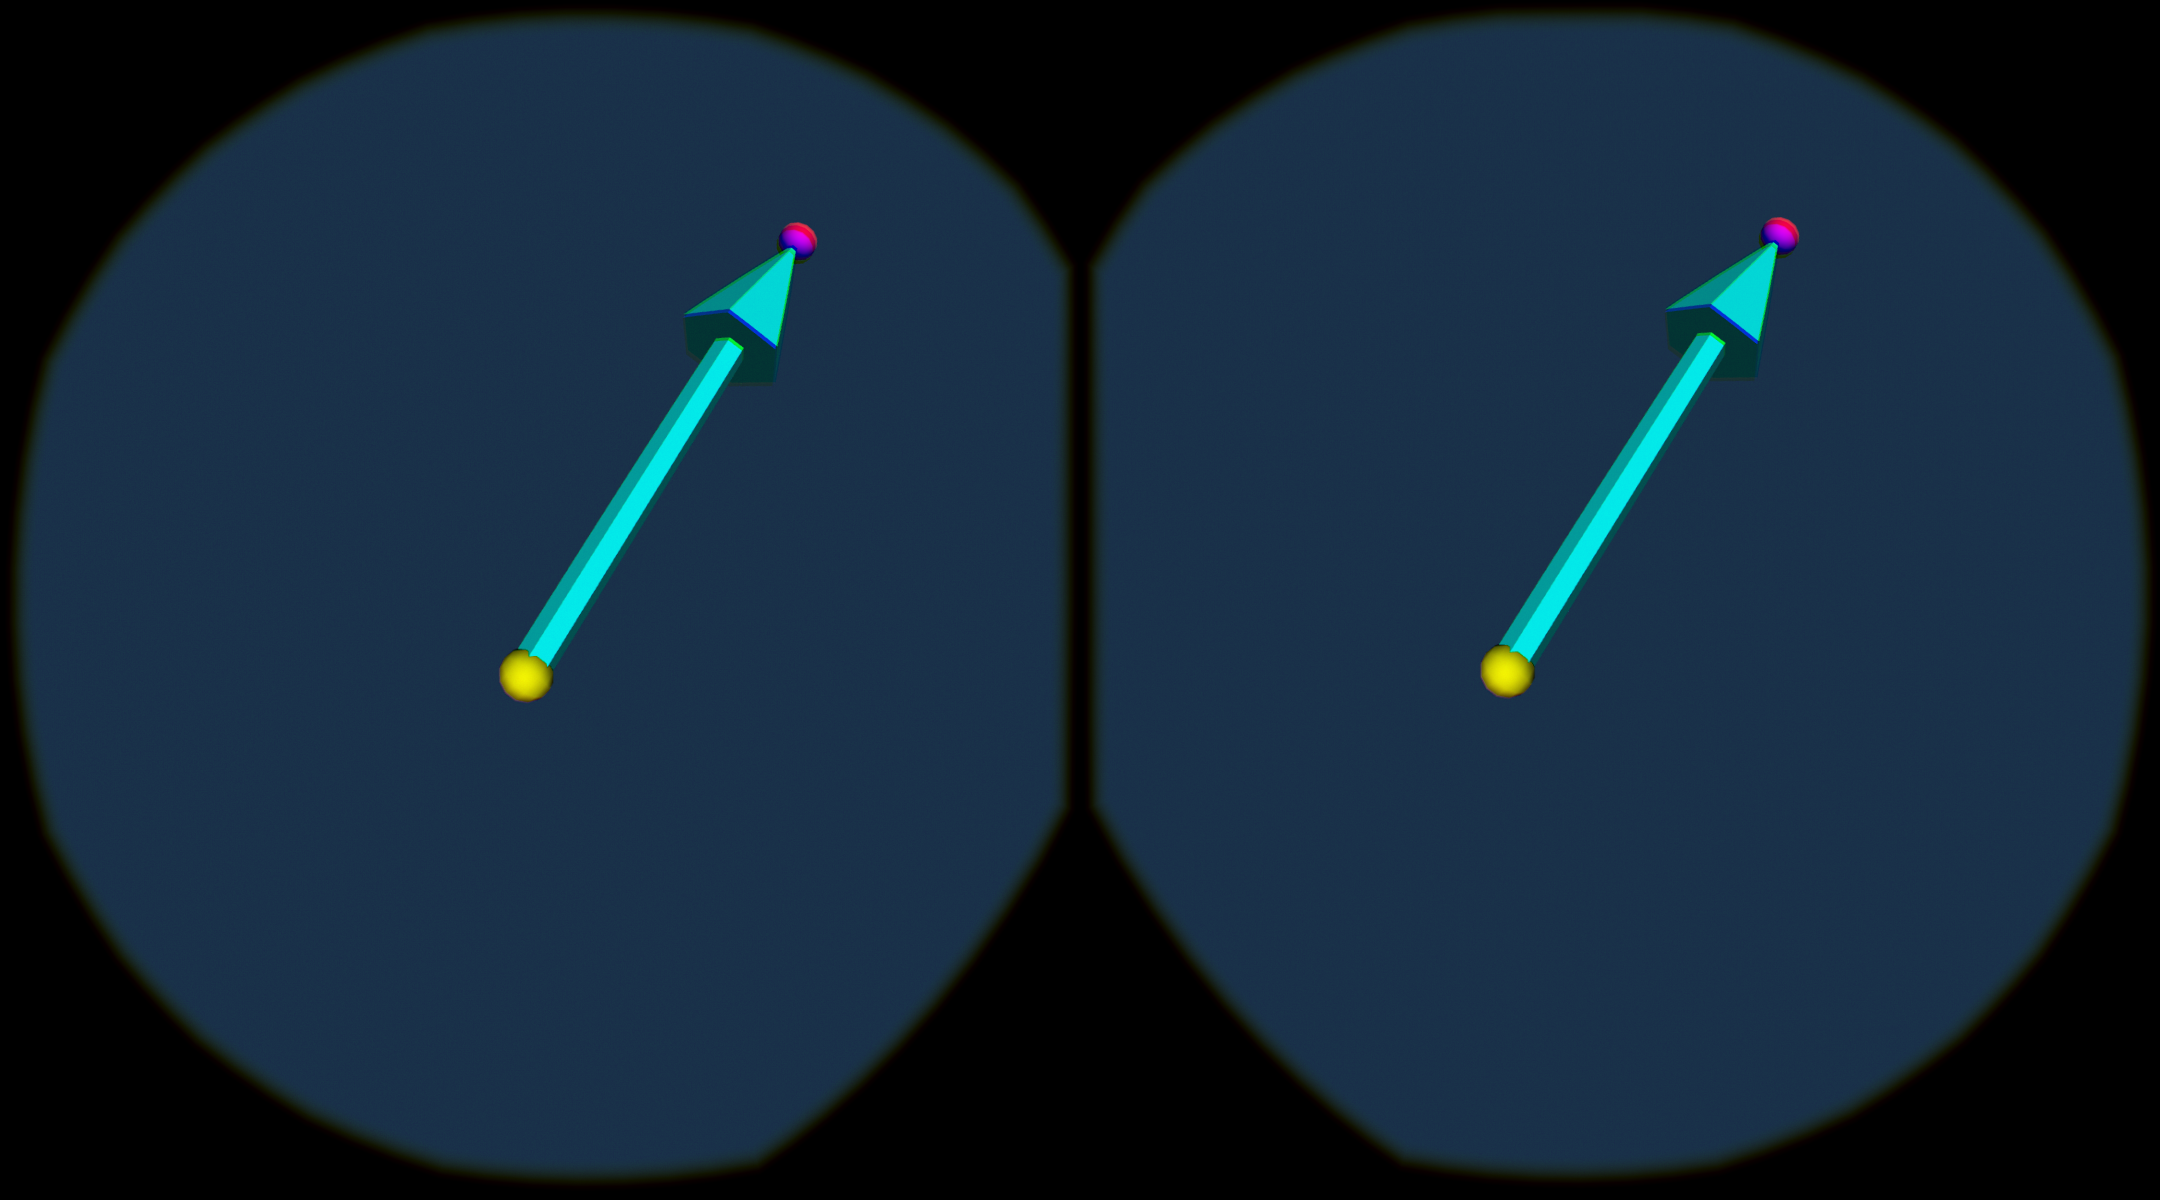 |
| OpenVROrientedCylinder | VTK + OpenVR Example. |  |
| OpenVRTessellatedBoxSource | VTK + OpenVR Example. |  |
| PlaneSourceDemo | Display the instance variables that define a vtkPlaneSource. |  |
| Planes |  | |
| PlanesIntersection | ||
| PolygonIntersection | Compute the intersection of a line segment with a polygon. | |
| ShrinkCube | Applying shrink filter to an object. |  |
| SourceObjectsDemo | Examples of source objects that procedurally generate polygonal models. These nine images represent just some of the capability of VTK. From upper left in reading order: sphere, cone, cylinder, cube, plane, text, random point cloud, disk (with or without hole), and line source. Other polygonal source objects are available; check subclasses of vtkPolyDataAlgorithm. |  |
Cells
| Example Name | Description | Image |
|---|---|---|
| Cell3DDemonstration | Demonstrate the use of vtkCell3D to construct geometric objects. Sample objects are generated from the classes derived from vtkCell3D and displayed. | 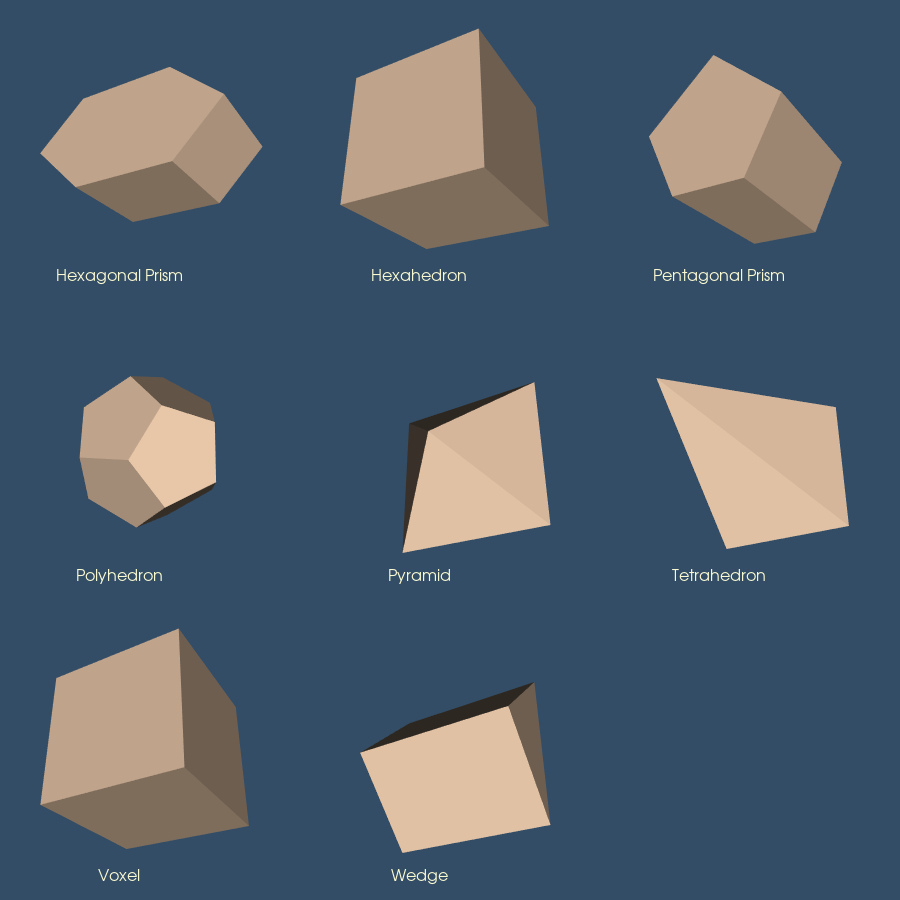 |
| CellTypeSource | Generate tessellated cells. | 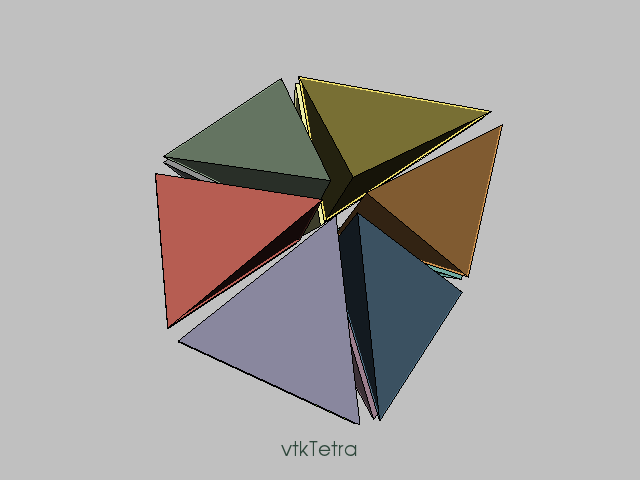 |
| ConvexPointSet | Generate a ConvexPointSetCell. |  |
| Hexahedron | 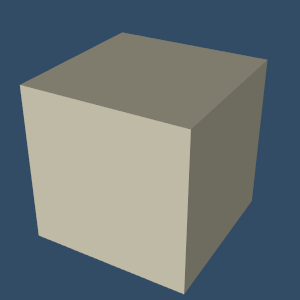 | |
| LinearCellDemo | Linear cell types found in VTK. Numbers define ordering of the defining points. |  |
| LongLine | Manually create a polyline. |  |
| Point |  | |
| PolyLine | 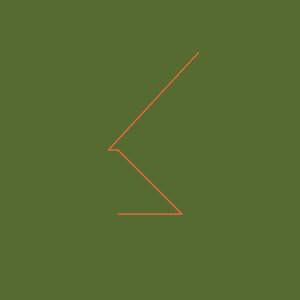 | |
| Polygon |  | |
| Polyhedron | Create an unstructured grid representation of a polyhedron (cube) and write it out to a file. |  |
| Pyramid |  | |
| Quad |  | |
| Tetrahedron |  | |
| Triangle |  | |
| Triangle strip |  | |
| Vertex |  | |
Sources
| Example Name | Description | Image |
|---|---|---|
| Arrow |  | |
| Cone | Display a cone |  |
| ConeDemo | Disolay four different resolution cones. |  |
| Cylinder |  | |
| Disk | A circle with a hole in it. |  |
| EarthSource | Create the Earth. |  |
| Frustum |  | |
| Line |  | |
| OrientedArrow | Orient an arrow along an arbitrary vector. |  |
| OrientedCylinder | Orient a cylinder along an arbitrary vector. |  |
| Plane |  | |
| PlatonicSolids |  | |
| PolyLine1 | This example demonstrates how to create a polygon through several ordered points. |  |
| RegularPolygonSource |  | |
| Sphere |  | |
| TessellatedBoxSource | Generate a box with tessellated sides. |  |
| TextActor | 2D "HUD-type" text |  |
Non Linear
| Example Name | Description | Image |
|---|---|---|
| IsoparametricCellsDemo | Nonlinear isoparametric cell types in VTK. |  |
| QuadraticHexahedron | Create and tessellate a nonlinear cell. |  |
| QuadraticHexahedronDemo | Interactively adjust chord error. |  |
| QuadraticTetra | Create and tessellate a nonlinear cell. |  |
| QuadraticTetraDemo | Interactively adjust chord error. |  |
Parametric Objects
These examples demonstrate how to create an display one of the many vtkParametric objects. All of the classes listed can be used in an identical fashion.
| Example Name | Description | Image |
|---|---|---|
| ParametricKuenDemo | Interactively change the parameters for a Kuen Surface. | 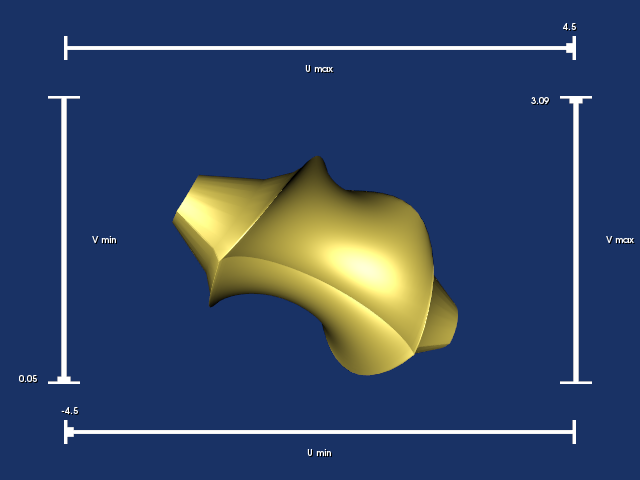 |
| ParametricObjectsDemo | Demonstrates the Parametric classes added by Andrew Maclean and additional classes added by Tim Meehan. The parametric spline is also included. Options are provided to display single objects, add backface, add normals and print out an image. |  |
| ParametricSuperEllipsoidDemo | Interactively change the parameters for a SuperEllipsoid Surface. |  |
| ParametricSuperToroidDemo | Interactively change the parameters for a SuperToroid Surface. |  |
Implicit Functions and Iso-surfaces
| Example Name | Description | Image |
|---|---|---|
| BandedPolyDataContourFilter | Create filled contours. |  |
| BooleanOperationImplicitFunctions | Demonstrate booleans of two different implicit functions |  |
| ContourTriangulator | Create a contour from a structured point set (image) and triangulate it. |  |
| CutWithCutFunction | Cut a surface with an implicit plane using vtkCutter. |  |
| CutWithScalars | Cut a surface with scalars. | 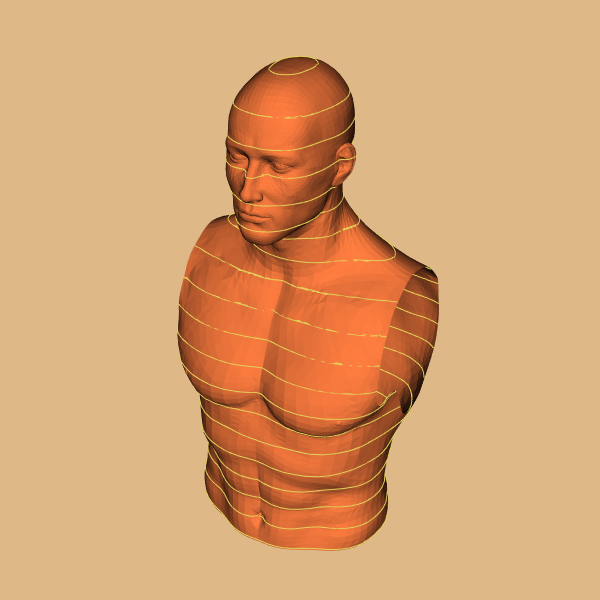 |
| DiscreteMarchingCubes | Generate surfaces from labeled data. | 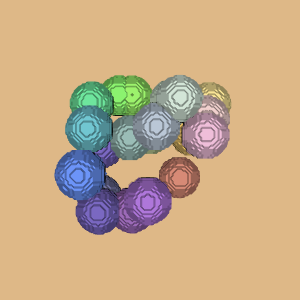 |
| ExtractData | Implicit functions used to select data: Two ellipsoids are combined using the union operation used to select voxels from a volume. Voxels are shrunk 50 percent. | 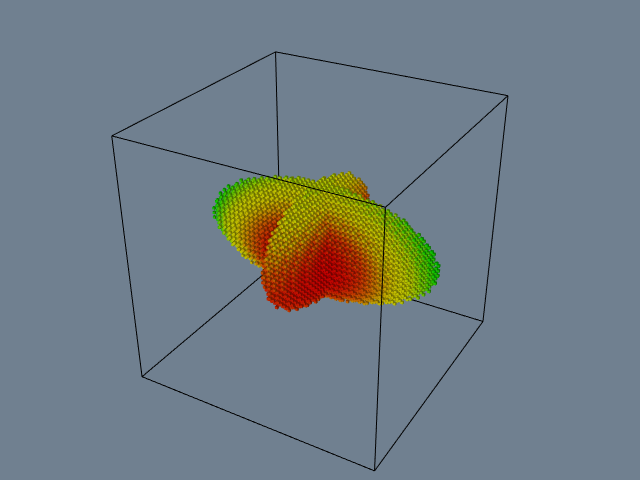 |
| ExtractLargestIsosurface | Extract largest isosurface. | 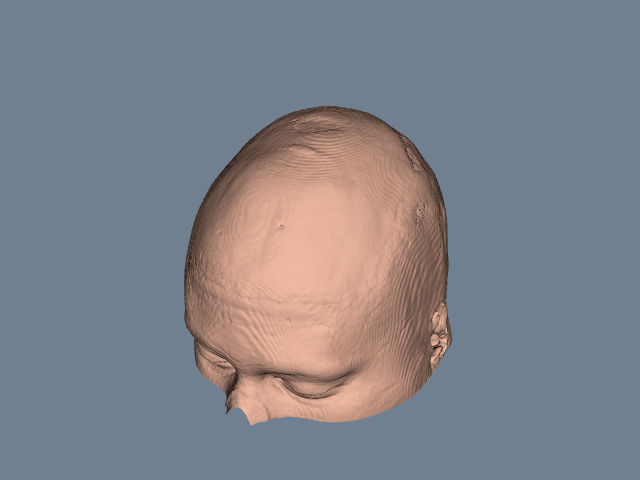 |
| FilledContours | Create filled contours (using vtkClipPolyData). |  |
| Hello | Implicit modelling used to thicken a stroked font. |  |
| IceCream | How to use boolean combinations of implicit functions to create a model of an ice cream cone. |  |
| ImplicitDataSet | Convert an imagedata to an implicit function. | |
| ImplicitQuadric | Create an ellipsoid using an implicit quadric. |  |
| ImplicitSphere | An implicit representation of a sphere. |  |
| ImplicitSphere1 | Demonstrate sampling of a sphere implicit function. |  |
| IsoContours | Visualize different isocontours using a slider. | 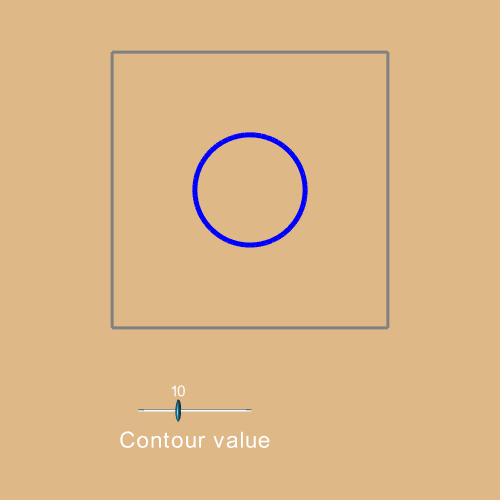 |
| Lorenz | Visualizing a Lorenz strange attractor by integrating the Lorenz equations in a volume. | 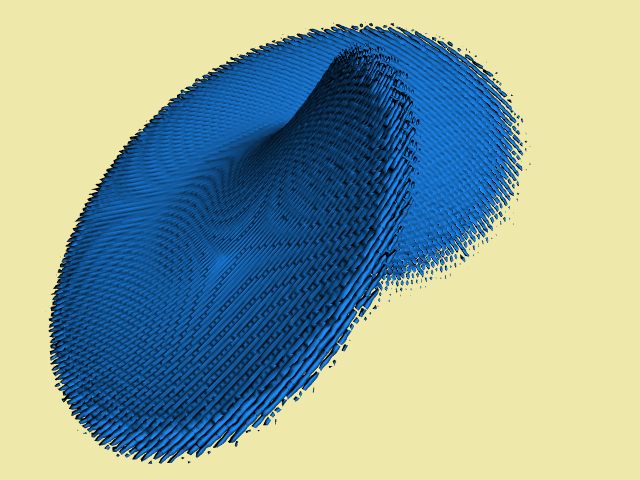 |
| MarchingCases | Explore the Marching Cubes cases. | 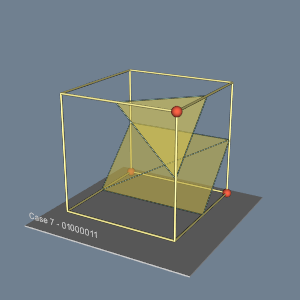 |
| MarchingCasesA | The 256 possible cases have been reduced to 15 cases using symmetry. | 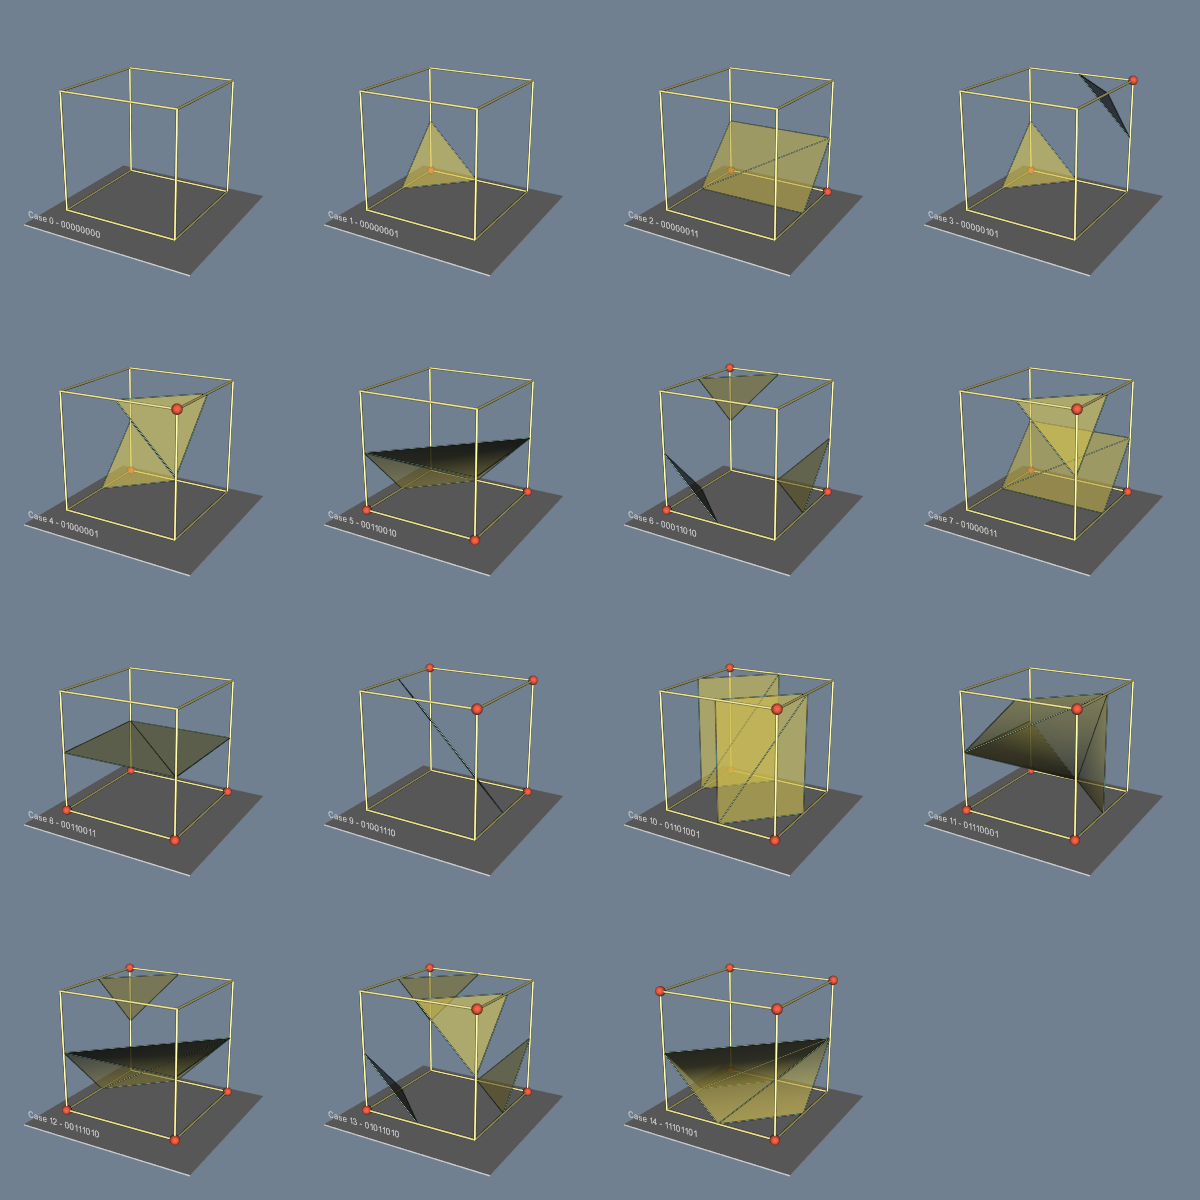 |
| MarchingCasesB | Marching cubes complementary cases. Cases 3c, 6c, 7c, 10c, 12c and 13c are displayed. |  |
| MarchingCasesC | Marching cubes, case 3 is rotated 90 degrees about the y-axis with no label. |  |
| MarchingCasesD | Marching cubes. Case 7 is rotated 180 degrees about the y-axis with no label. | 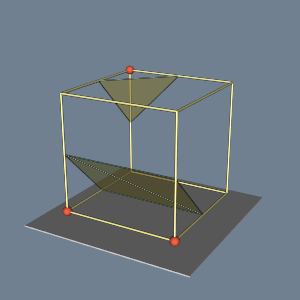 |
| MarchingCubes | Create a voxelized sphere. |  |
| MarchingSquares | Create a contour from a structured point set (image). | 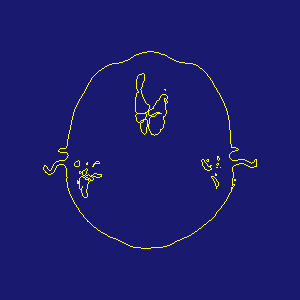 |
| SampleFunction | Sample and visualize an implicit function. |  |
| ShepardInterpolation | Interpolate scalar data. |  |
| SmoothDiscreteMarchingCubes | Generate smooth surfaces from labeled data. |  |
Working with 3D Data
| Example Name | Description | Image |
|---|---|---|
| AlignFrames | Align coordinate frames. | |
| AlignTwoPolyDatas | Align two vtkPolyData's. |  |
| AppendFilter | Append different types of data, |  |
| BooleanOperationPolyDataFilter | Perform boolean operations on two vtkPolyData objects. |  |
| Bottle | Rotationally symmetric objects. | 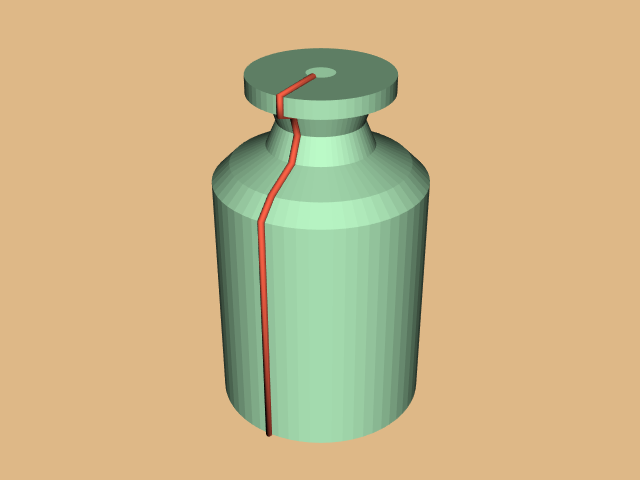 |
| CappedSphere | Rotate an arc to create a capped sphere. |  |
| CellCenters | Compute points at the center of every cell. |  |
| CellCentersDemo | Visualize points at the center of every cell. | 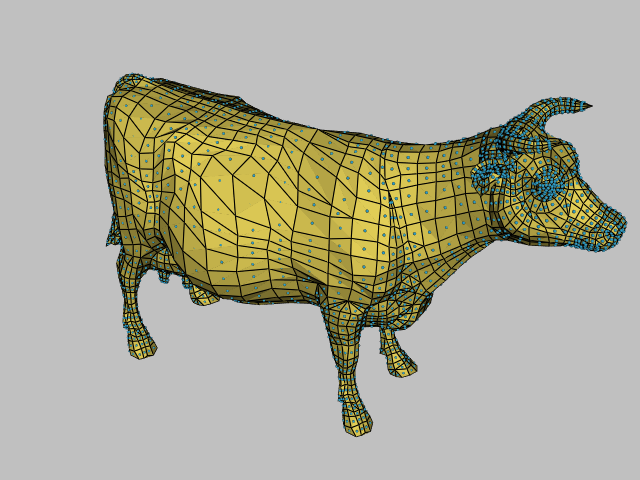 |
| CellEdgeNeighbors | Determine which cells share an edge with a specific cell. | 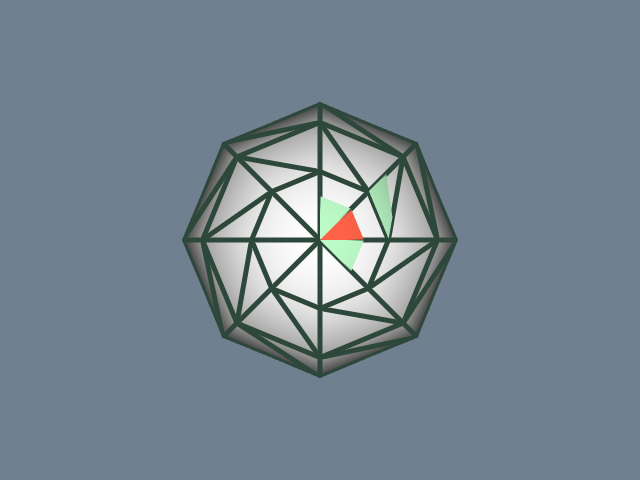 |
| CellPointNeighbors | Determine which cells share a single point with a specific cell. |  |
| CellsInsideObject | Extract cells inside a closed surface. |  |
| CenterOfMass | Compute the center of mass of the points. | |
| Circle | Create a circle by cutting through a sphere. |  |
| CleanPolyData | Remove coincident points. | |
| ColorCells | Color individual cells of a polydata with scalar index. |  |
| ColorCellsWithRGB | Color individual cells of a polydata with rgb colors. |  |
| ColoredPoints | Add three points to a polydata and associate a color with each of them. |  |
| CombinePolyData | Combine/Append PolyData. |  |
| ConnectivityFilter | Color any dataset type based on connectivity. | 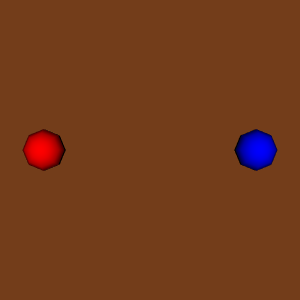 |
| ConnectivityFilterDemo | Color any dataset type based on connectivity. |  |
| ContoursFromPolyData | Create contours from PolyData. |  |
| ContoursToSurface | Convert contours to a surface. |  |
| ConvexHull | Convex hull using vtkHull. |  |
| ConvexHullShrinkWrap | Convex hull using shrink wrapping. |  |
| CopyAllArrays | Copy all arrays from one vtkPolyData to another. | |
| CurvaturesAdjustEdges | Get the Gaussian and Mean curvatures of a surface with adjustments for edge effects. |  |
| CurvaturesDemo | Demonstrates how to get the Gaussian and Mean curvatures of a surface. |  |
| DataBounds | Get the minimum and maximum value in each dimension. (Axis aligned bounding box) | |
| DataSetSurfaceFilter | Convert vtkUnstructuredGrid to vtkPolyData. | |
| DecimatePolyline | Decimate polyline. |  |
| DeleteCells | Delete a cell from a vtkPolyData |  |
| DeletePoint | ||
| DetermineArrayDataTypes | Determine data types of arrays. | |
| DistancePolyDataFilter | Compute the distance function from one vtkPolyData to another. |  |
| EmbedPointsIntoVolume | Embed points into a volume. |  |
| ExternalContour | Get the External Contour from Polydata. |  |
| ExtractCellsUsingPoints | Extract points but bring cells that are still complete with them. |  |
| ExtractOutsideSurface | Extract the outer surface of a multiple surface polydata. |  |
| ExtractPolyLinesFromPolyData | Extract polylines from polydata. |  |
| ExtractSelection | Extract selected points. |  |
| ExtractSelectionCells | Extract cell, select cell. |  |
| ExtractSelectionOriginalId | Extract selection and find correspondence between new and original Id. |  |
| ExtractVisibleCells | Extract and highlight visible cells. |  |
| FieldData | Add Global Miscellaneous Data (FieldData) to a Polydata. | |
| Finance | Visualization of multidimensional financial data. The gray/wireframe surface represents the total data population. The red surface represents data points delinquent on loan payment. |  |
| FinanceFieldData | Visualization of multidimensional financial data. The yellow surface represents the total data population. The red surface represents data points delinquent on loan payment. |  |
| FindAllArrayNames | Get the names of all of the data arrays. | |
| FitSplineToCutterOutput | Fit a spline to cutter output. |  |
| GeometryFilter | Convert vtkUnstructuredGrid to vtkPolyData (another way). | |
| GetMiscCellData | Get Miscellaneous Data from Cells in a Polydata. | |
| GetMiscPointData | Get Miscellaneous Data from Points in a Polydata. | |
| GradientFilter | Compute the gradient of a scalar field on a data set. | 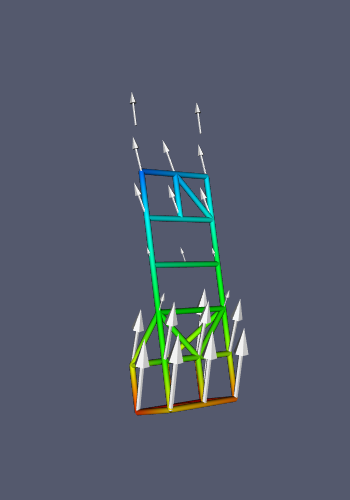 |
| ImplicitBoolean | Operations include intersection and union. |  |
| ImplicitBooleanDemo | Demo Union, Difference and Intersection. |  |
| ImplicitModeller | Compute the distance from an object to every point on a uniform grid. |  |
| ImplicitPolyDataDistance | Compute the distance function in a space around a vtkPolyData. |  |
| InterpolateMeshOnGrid | Interpolate a mesh over a grid. |  |
| InterpolateTerrain | vtkProbeFilter Interpolate terrain. | |
| IntersectionPolyDataFilter | Compute the intersection of two vtkPolyData objects. |  |
| IterateOverLines | Iterate through the lines of a PolyData. | |
| KMeansClustering | KMeans Clustering |  |
| KochanekSpline | Create an Kochanek spline on a set of points. |  |
| KochanekSplineDemo | Interactively change the parameters of the Kochanek spline. |  |
| LinearExtrusion | Extrude a shape. |  |
| LoopBooleanPolyDataFilter | Perform boolean operations on two vtkPolyData objects. |  |
| MaskPoints | Select a subset (mask) of a point set. |  |
| MergePoints | Remove duplicate (merge) points. | |
| MergeSelections | Merge selected points. |  |
| MiscCellData | Add Miscellaneous Data to Cells in a Polydata. | |
| MiscPointData | Add Miscellaneous Data to Points in a Polydata. | |
| MultiBlockMergeFilter | Combine MultiBlockDataSets. | |
| NullPoint | Set everything in PointData at a specified index to NULL | |
| Outline | Draw the bounding box of the data | 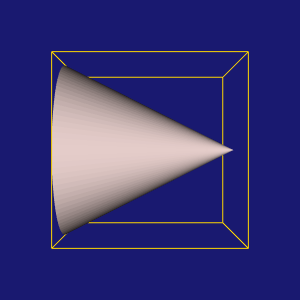 |
| PKMeansClustering | Parallel KMeans Clustering. | |
| ParametricSpline | Create a Cardinal spline on a set of points. |  |
| PerlinNoise |  | |
| PointCellIds | Generate point and cell id arrays. | |
| PointInsideObject | Check if a point is inside an object. |  |
| PointInsideObject2 | This uses a Delaunay triangulation to compute a volume. This gives more of an "is inside convex hull" effect than an "is inside object". |  |
| PointsProjectedHull | Convex hull of points projected onto the coordinate planes. |  |
| PolyDataCellNormals | Add/Get Normals to/from cells in a Polydata. | |
| PolyDataContourToImageData | Generate a binarized image from a closed contour. | |
| PolyDataExtractNormals | Extract Normals from a Polydata. | |
| PolyDataGetPoint | Get point locations/coordinates from a vtkPolyData. | |
| PolyDataIsoLines | Iso lines on the surface of a polydata |  |
| PolyDataPointNormals | Add/Get Normals to/from points in a Polydata. | |
| PolyDataPointSampler | Sample the edges or surfaces of a polydata. |  |
| PolyDataToImageData | Generate a binarized volume from a closed surface. | |
| ProcrustesAlignmentFilter | Align point sets. |  |
| ProgrammableFilter | Create a custom filter without subclassing. |  |
| ProgrammableSource | Create points using a programmable source. Generates points for a strange attractor. | 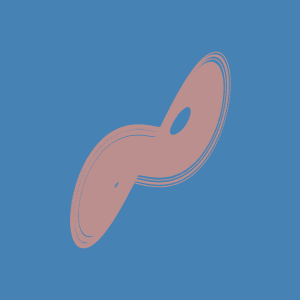 |
| ProjectSphere | Unroll a sphere or spherical-like model. |  |
| QuantizePolyDataPoints | Snap (quantize) points to a grid. |  |
| Reflection | Mirror a DataSet. |  |
| RemoveOutsideSurface | Remove the outer surface of a multiple surface polydata. |  |
| RemoveVertices | ||
| ResampleAppendedPolyData | Resample a flat terrain containing multiple objects. |  |
| ResamplePolyLine |  | |
| ReverseSense | Flip normals. | |
| RibbonFilter |  | |
| RotationAroundLine | Rotation around a line. |  |
| RuledSurfaceFilter | Create a surface between lines. |  |
| SCurveSpline | Create an SCurve spline on a set of points. |  |
| SelectVisiblePoints | Select visible points. |  |
| SelectionSource | Specify a selection. | |
| ShrinkPolyData | Move all items in a PolyData towards their centroid. |  |
| Silhouette |  | |
| Spring | Rotation in combination with linear displacement and radius variation. |  |
| Stripper | Convert triangles to triangle strips. | |
| ThinPlateSplineTransform | ||
| ThresholdCells | Thresholding Cells. | |
| ThresholdPoints | Thresholding Points. | |
| TransformFilter | Transform a data set. | |
| TransformOrderDemo | Demonstrate how the order of applying transforms affects the result. | |
| TransformPipeline | Combining the transformation, in order to manipulate a group of vtkActor. Shown in the example robot arm motion. | |
| TransformPolyData | Apply a Transformation to a PolyData. | |
| TriangleArea | Compute the area of all triangles in a polydata. | |
| TriangleColoredPoints | Set the color of each point of a triangle. You will be able to interpolate the colors across the triangle. |  |
| TriangleSolidColor | Create a solid colored triangle. |  |
| TubeFilter | Give lines a thickness (produce a cylinder around lines. |  |
| VectorFieldNonZeroExtraction | Extract non-zero vectors from a vtkImageData. | |
| VertexConnectivity | Get a list of vertices attached (through an edge) to a vertex. | 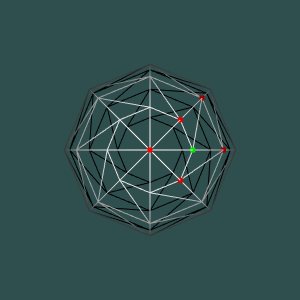 |
| WarpScalar | Move vertices along normals. | 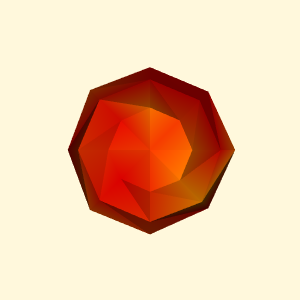 |
| WarpSurface | Warp a surface along its normal. |  |
| WarpTo | Bend an object. |  |
| WarpVector |  | |
Data Types
| Example Name | Description | Image |
|---|---|---|
| CompositePolyDataMapper |  | |
| Generate2DAMRDataSetWithPulse | Generates sample 2-D AMR dataset. | |
| Generate3DAMRDataSetWithPulse | Generates sample 3-D AMR dataset. | |
| MultiBlockDataSet | Demonstrates how to make and use VTK's MultiBlock type data |  |
| OverlappingAMR | Demonstrates how to create and populate a VTK's Overlapping AMR Grid type Data |  |
Data Type Conversions
| Example Name | Description | Image |
|---|---|---|
| PolyDataToUnstructuredGrid | Convert a vtkPolyData to a vtkUnstructuredGrid. |
Point Cloud Operations
| Example Name | Description | Image |
|---|---|---|
| ColorIsosurface | Color an isosurface with a data array. |  |
| CompareExtractSurface | Compare three extract surface algorithms. | 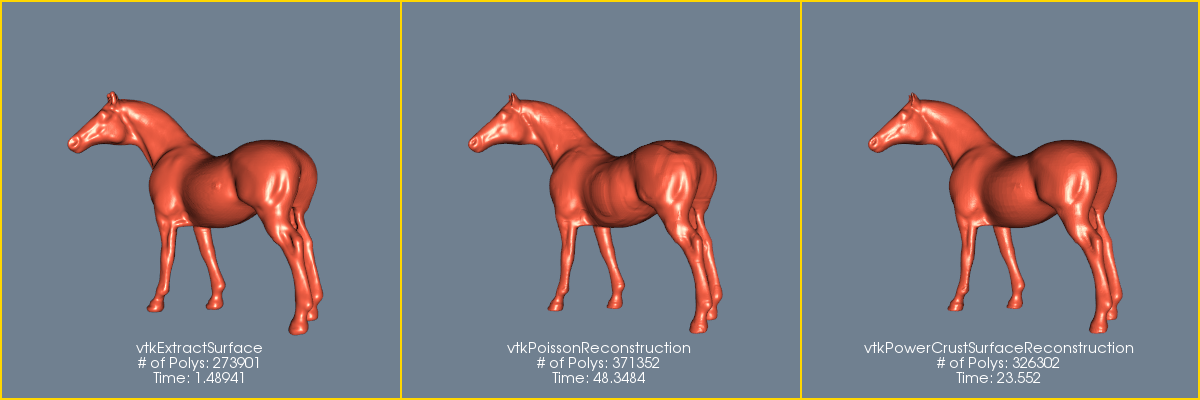 |
| DensifyPoints | Add points to a point cloud. |  |
| DownsamplePointCloud | Down sample a point cloud. Remove points so that there are no points within a tolerance of any point. |  |
| ExtractClusters | From a set of randomly distributed spheres, extract connected clusters. |  |
| ExtractEnclosedPoints | Extract points inside a vtkPolyData surface. |  |
| ExtractPointsDemo | Extract points inside an implicit function. |  |
| ExtractSurface | Create a surface from Unorganized Points using Point filters. |  |
| ExtractSurfaceDemo | Create a surface from Unorganized Points using Point filters (DEMO). |  |
| FitImplicitFunction | Extract points within a distance to an implicit function. |  |
| MaskPointsFilter | Extract points within an image mask. |  |
| NormalEstimation | Estimate the normals of a random points that lie on a sphere. |  |
| PointOccupancy | Show which voxels contain points. | 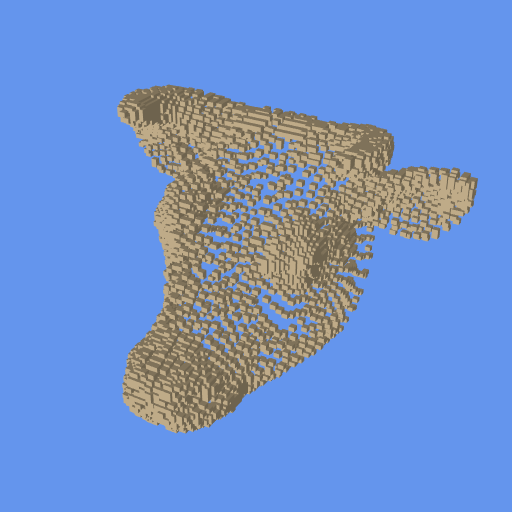 |
| PointSource | Generate a random point cloud. |  |
| PoissonExtractSurface | Create a surface from Unorganized Points using the PoissonReconstruction algorithm. |  |
| PowercrustExtractSurface | Create a surface from Unorganized Points using the Powercrust algorithm. | 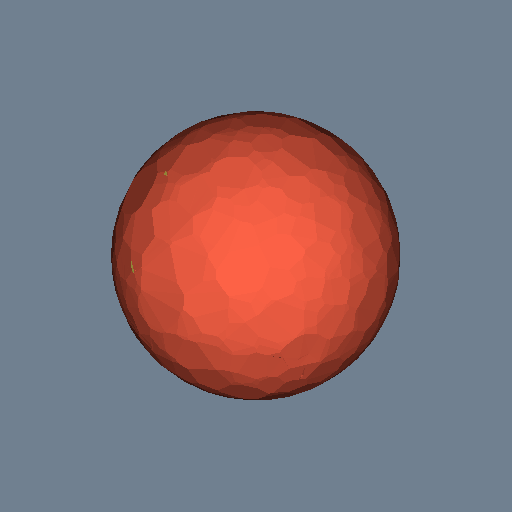 |
| RadiusOutlierRemoval | Remove outliers. | 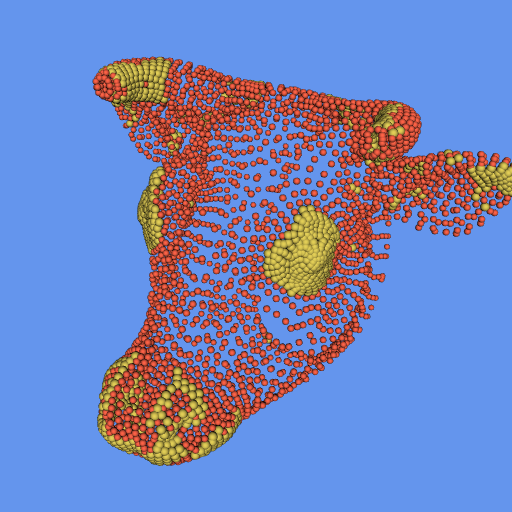 |
| SignedDistance | Compute signed distance to a point cloud. |  |
| UnsignedDistance | Compute unsigned distance to a point cloud. |  |
Working with Meshes
| Example Name | Description | Image |
|---|---|---|
| AddCell | Add a cell to an existing mesh. | |
| BoundaryEdges | Find the edges that are used by only one face. |  |
| CellEdges | Get edges of cells. | |
| ClosedSurface | Check if a surface is closed. | |
| ColorDisconnectedRegions | Color each disconnected region of a vtkPolyData a different color. | 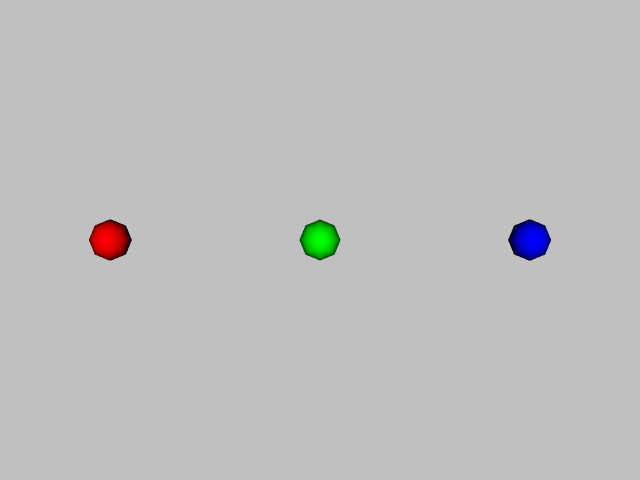 |
| ColorDisconnectedRegionsDemo | Color each disconnected region of a vtkPolyData a different color for any vtkPolyData. | 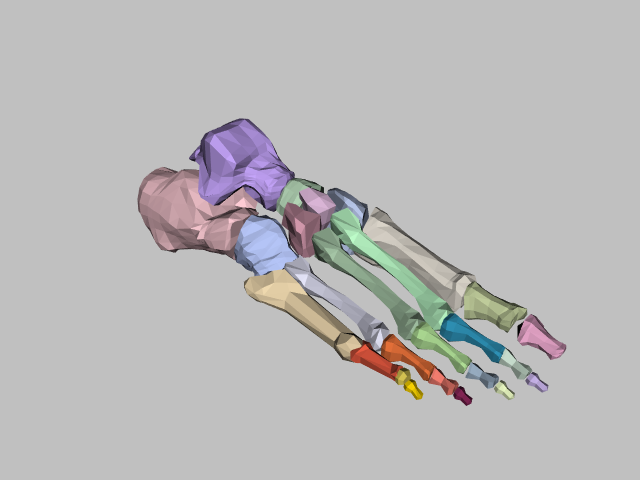 |
| ColoredElevationMap | Color a mesh by height. |  |
| Curvatures | Compute Gaussian and Mean Curvatures. |  |
| Decimation | Reduce the number of triangles in a mesh. |  |
| DeformPointSet | Deform a point set with a control polyhedra. |  |
| DelaunayMesh | Two-dimensional Delaunay triangulation of a random set of points. Points and edges are shown highlighted with sphere glyphs and tubes. |  |
| DijkstraGraphGeodesicPath | Find the shortest path between two points on a mesh. | 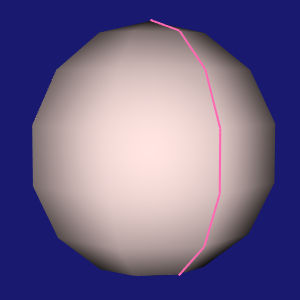 |
| ElevationFilter | Color a mesh by height. |  |
| ExtractEdges | 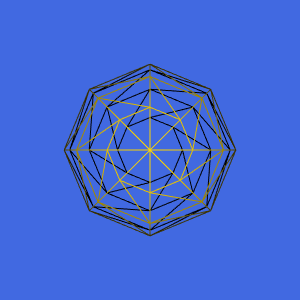 | |
| FillHoles | Close holes in a mesh. |  |
| FitToHeightMap | Drape a polydata over an elevation map. | 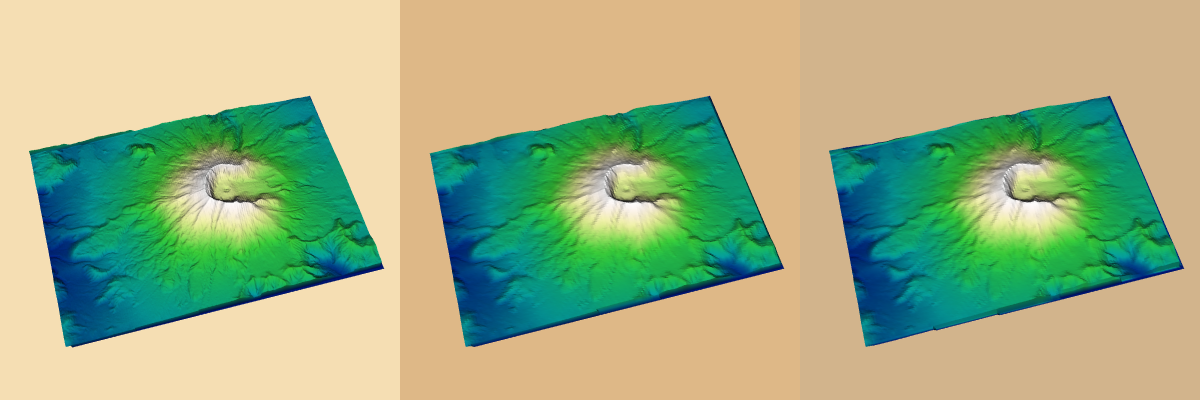 |
| GreedyTerrainDecimation | Create a mesh from an ImageData |  |
| HighlightBadCells |  | |
| IdentifyHoles | Close holes in a mesh and identify the holes. |  |
| ImplicitSelectionLoop | Select a region of a mesh with an implicit function. |  |
| InterpolateFieldDataDemo | Resample a fine grid and interpolate field data. |  |
| LargestRegion | Extract the largest connected region in a polydata. |  |
| MatrixMathFilter | Compute various quantities on cell and points in a mesh. |  |
| MeshQuality | 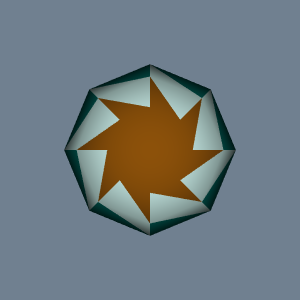 | |
| OBBDicer | Breakup a mesh into pieces. |  |
| PointInterpolator | Plot a scalar field of points onto a PolyData surface. |  |
| PolygonalSurfaceContourLineInterpolator | Interactively find the shortest path between two points on a mesh. |  |
| QuadricClustering | Reduce the number of triangles in a mesh. |  |
| QuadricDecimation | Reduce the number of triangles in a mesh. |  |
| SelectPolyData | Select a region of a mesh. |  |
| SimpleElevationFilter | Color a mesh by dotting a vector from the origin to each point with a specified vector. |  |
| SmoothPolyDataFilter | Laplacian smoothing. |  |
| SpecifiedRegion | Extract a specific (specified) connected region in a polydata. |  |
| SplitPolyData | Breakup a mesh into pieces and save the pieces into files |  |
| Subdivision | Increase the number of triangles in a mesh. |  |
| SubdivisionDemo | Subdivision of any vtkPolyData |  |
| Triangulate | Convert all polygons in a mesh to triangles. |  |
| WeightedTransformFilter | ||
| WindowedSincPolyDataFilter | Smooth a mesh (windowed sinc filter). | 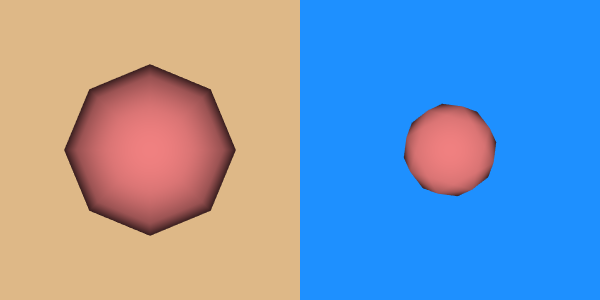 |
Clipping
| Example Name | Description | Image |
|---|---|---|
| BoxClipStructuredPoints | Clip vtkStructuredPoints with a box. The results are unstructured grids with tetrahedra. |  |
| BoxClipUnstructuredGrid | Clip a vtkUnstructuredGrid with a box. The results are unstructured grids with tetrahedra. |  |
| CapClip | Cap a clipped polydata with a polygon. |  |
| ClipClosedSurface | Clip a surface with multiple planes. |  |
| ClipDataSetWithPolyData | Clip a vtkRectilinearGrid with arbitrary polydata. In this example, use a vtkConeSource to generate polydata to slice the grid, resulting in an unstructured grid. Contrast this with the next example. | 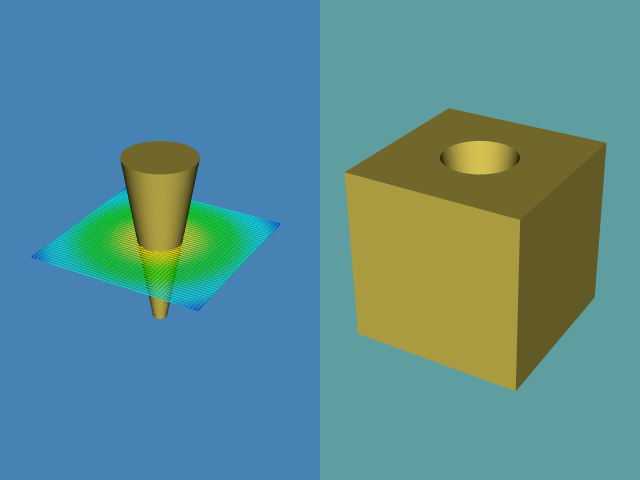 |
| ClipFrustum | Clip a vtkPolyData with the vtkCamera's view frustum. |  |
| GenericClip |  | |
| ImplicitDataSetClipping | Clip using an implicit data set. | 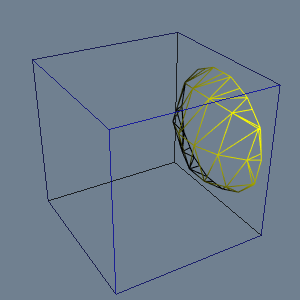 |
| SolidClip | Create a "solid" clip. The "ghost" of the part clipped away is also shown. |  |
| TableBasedClipDataSetWithPolyData | Clip a vtkRectilinearGrid with arbitrary polydata. In this example, use a vtkConeSource to generate polydata to slice the grid, resulting in an unstructured grid. Contrast this with the previous example. |  |
| TableBasedClipDataSetWithPolyData2 | Clip a vtkRectilinearGrid with a checkerboard pattern. |  |
Working with Structured 3D Data
This section includes vtkImageData vtkStructuredGrid and vtkRectilinearGrid.
"ImageData" is not the traditional "flat, 2D image" you are used to. It is a special VTK data structure in the collection of 3D data structures provided by VTK. Here is an overview of these data structures. Image data can represent at typical 2D image, but also, a 3D volume.
vtkImageData
| Example Name | Description | Image |
|---|---|---|
| CellIdFromGridCoordinates | Get the id of a cell from its grid coordinates. | |
| ClipVolume | Clip a volumeand produce a vtkUnhstructuredGrid. |  |
| ExtractVOI | Extract a volume of interest (subvolume). | 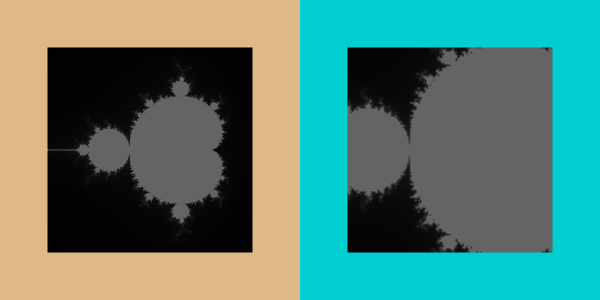 |
| GetCellCenter | Get the coordinates of the center of a cell. | |
| ImageIterator | ||
| ImageIteratorDemo | Demonstrate using an iterator to access pixels in a region. |  |
| ImageNormalize | Normalize an image. |  |
| ImageReslice | Resize a vtkImageData. | |
| ImageTranslateExtent | Change the extent of a vtkImageData. | |
| ImageWeightedSum | Add two or more images. |  |
| IntersectLine | Intersect a line with all cells of a vtkImageData. | 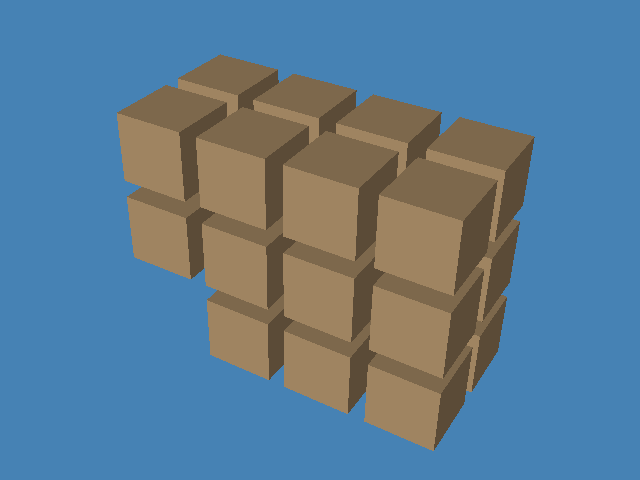 |
| IterateImageData | Iterating over a vtkImageData. |
Conversions
| Example Name | Description | Image |
|---|---|---|
| ImageDataGeometryFilter | Convert a vtkImageData to a vtkPolyData |  |
| ImageDataToPointSet | Convert a vtkImageData to a vtkStructuredGrid. |
vtkExplicitStructuredGrid
| Example Name | Description | Image |
|---|---|---|
| CreateESGrid | Create an explicit structured grid and convert this to an unstructured grid or vice versa. |  |
| LoadESGrid | Load a VTU file and convert the dataset to an explicit structured grid. | 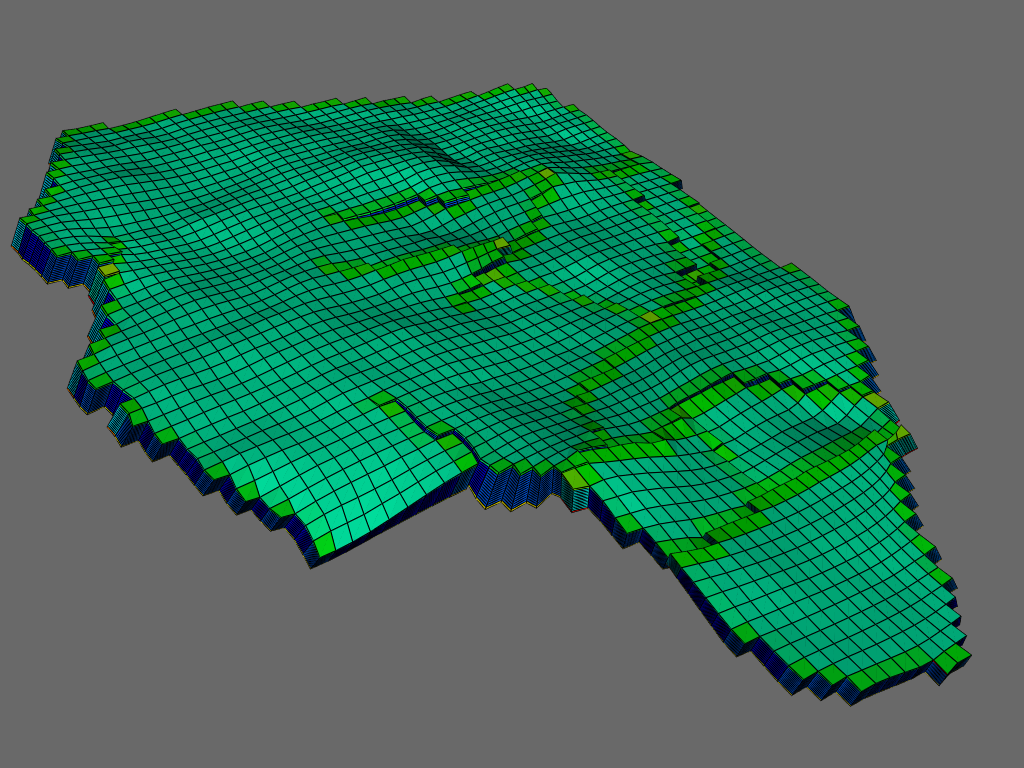 |
vtkStructuredGrid
| Example Name | Description | Image |
|---|---|---|
| BlankPoint | Blank a point of a vtkStructuredGrid. | |
| GetLinearPointId | Get the linear point id of a point in a grid. | |
| SGrid | Creating a structured grid dataset of a semi-cylinder. Vectors are created whose magnitude is proportional to radius and oriented in tangential direction. | 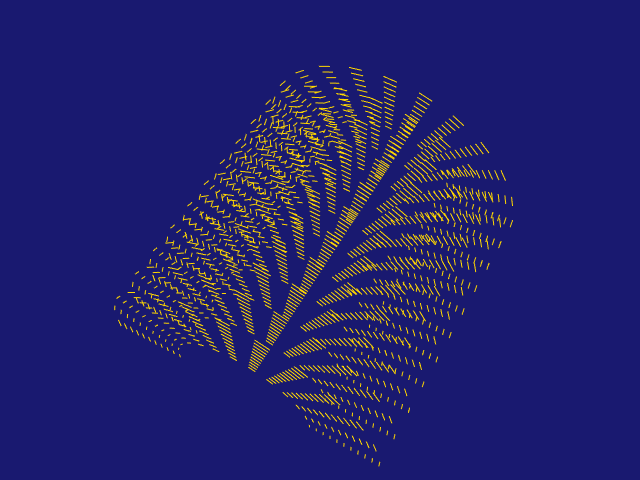 |
| StructuredGrid | Reads and writes points into a structured grid. The grid is also colored by point data and how to iterate through the structured grid is demonstrated. | 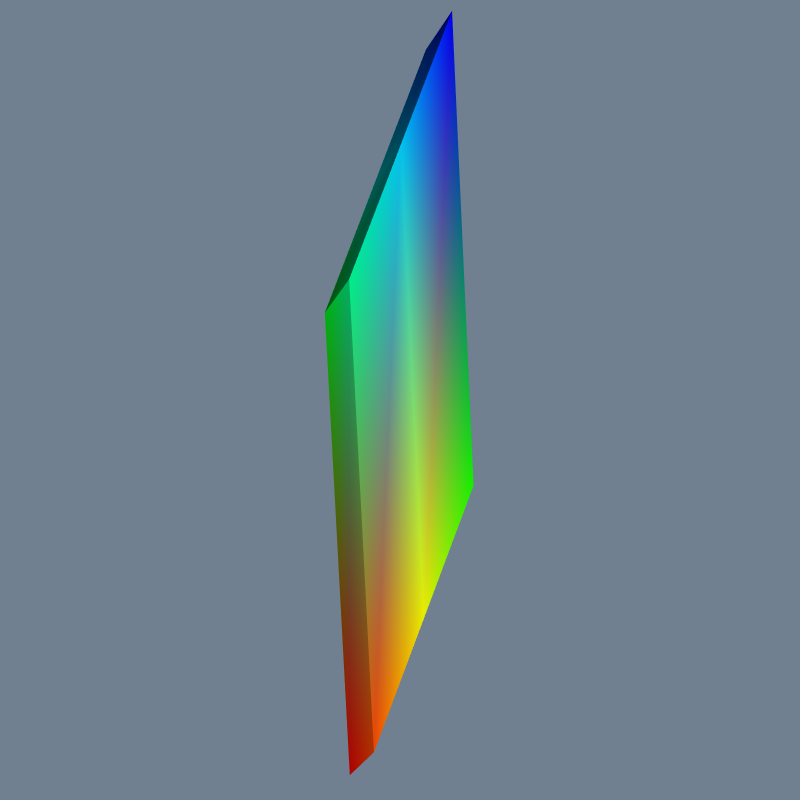 |
| StructuredGridOutline | Visualize the outline of a structured grid. | 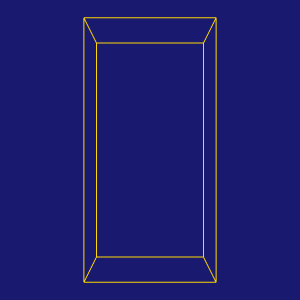 |
| VisualizeStructuredGrid | Visualize the points of a structured grid. | 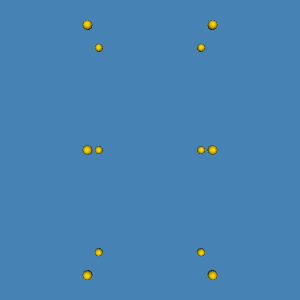 |
| VisualizeStructuredGridCells | Visualize the cells of a structured grid. |  |
vtkStructuredPoints
| Example Name | Description | Image |
|---|---|---|
| StructuredPointsToUnstructuredGrid | Convert a vtkStructuredPoints to a vtkUnstructuredGrid. | |
| Vol | Creating a image data dataset. Scalar data is generated from the equation for a sphere. Volume dimensions are 26 x 26 x 26. |  |
vtkRectilinearGrid
| Example Name | Description | Image |
|---|---|---|
| RGrid | Creating a rectilinear grid dataset. The coordinates along each axis are defined using an instance of vtkDataArray. |  |
| RectilinearGrid | Create a rectilinear grid. |  |
| RectilinearGridToTetrahedra | Convert a vtkRectilinearGrid to a vtkUnstructuredGrid mesh. | |
| VisualizeRectilinearGrid | Visualize the cells of a rectilinear grid. |  |
Working with Unstructured 3D Data
This section includes vtkUnstructuredGrid.
vtkUnstructuredGrid
| Example Name | Description | Image |
|---|---|---|
| ClipUnstructuredGridWithPlane | Clip a UGrid with a plane. | 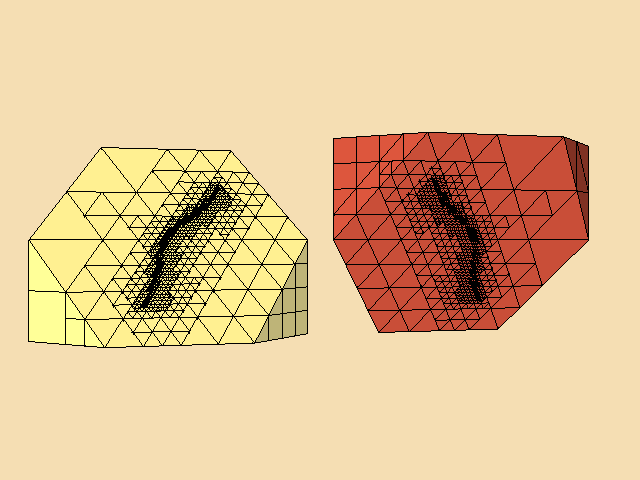 |
| ClipUnstructuredGridWithPlane2 | Clip a UGrid with a plane. |  |
| UGrid | Creation of an unstructured grid. |  |
Registration
| Example Name | Description | Image |
|---|---|---|
| IterativeClosestPointsTransform | Iterative Closest Points (ICP) Transform. | |
| LandmarkTransform | Landmark Transform. | |
Medical
| Example Name | Description | Image |
|---|---|---|
| GenerateCubesFromLabels | Create cubes from labeled volume data. |  |
| GenerateModelsFromLabels | Create models from labeled volume data. | |
| MedicalDemo1 | Create a skin surface from volume data. | 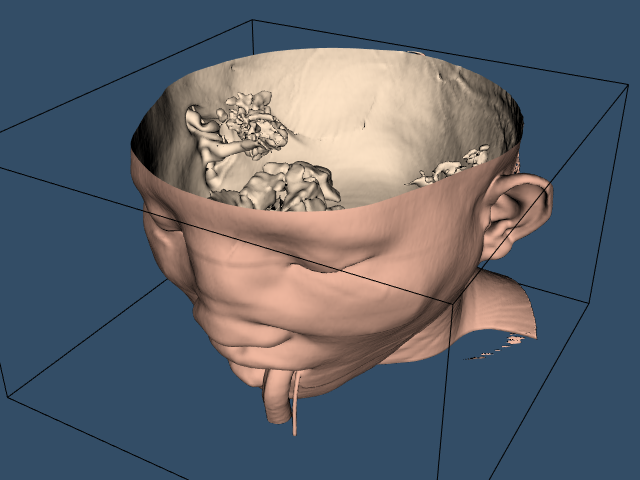 |
| MedicalDemo2 | Create a skin and bone surface from volume data. |  |
| MedicalDemo3 | Create skin, bone and slices from volume data. | 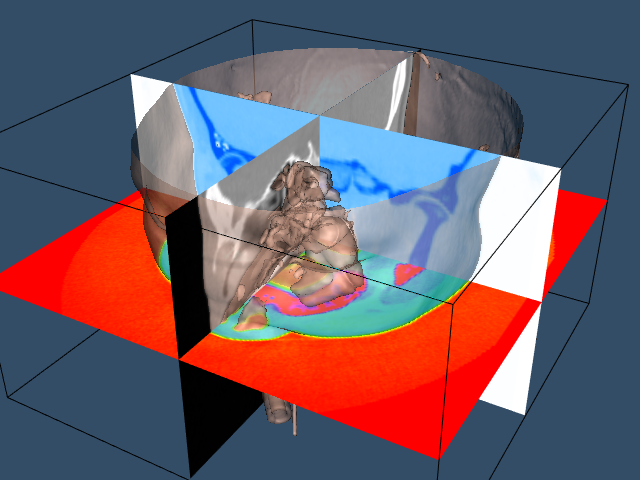 |
| MedicalDemo4 | Create a volume rendering. |  |
| TissueLens | Cut a volume with a sphere. |  |
Surface reconstruction
| Example Name | Description | Image |
|---|---|---|
| Delaunay3D | Create a solid mesh from Unorganized Points. |  |
| Delaunay3DDemo | Interactively adjust Alpha for Delaunay3D. | 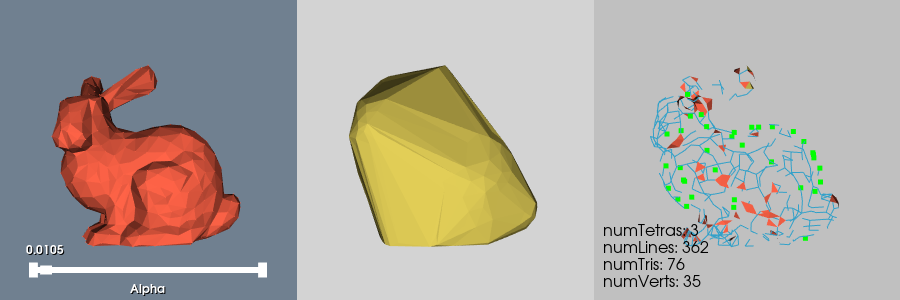 |
| ExtractSurface | Create a surface from Unorganized Points using Point filters. | |
| ExtractSurfaceDemo | Create a surface from Unorganized Points using Point filters (DEMO). | |
| GaussianSplat | Create a surface from Unorganized Points (Gaussian Splat). | 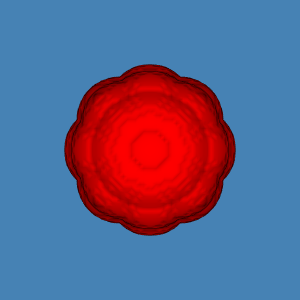 |
| SurfaceFromUnorganizedPoints | Create a surface from Unorganized Points. |  |
| SurfaceFromUnorganizedPointsWithPostProc | Create a surface from Unorganized Points (with post processing). | 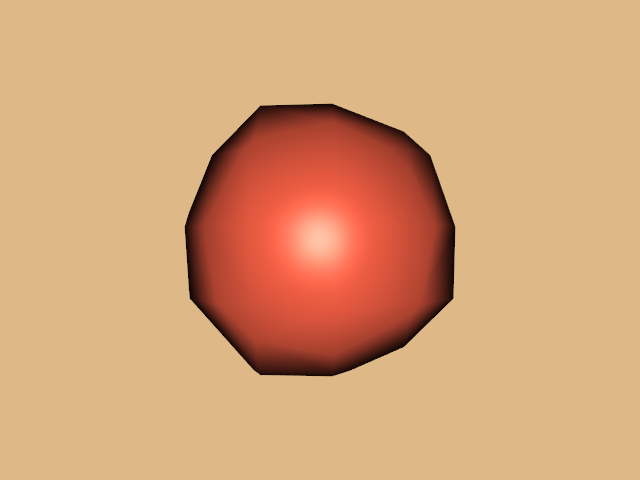 |
| TriangulateTerrainMap | Generate heights (z values) on a 10x10 grid (a terrain map) and then triangulate the points to form a surface. |  |
Utilities
| Example Name | Description | Image |
|---|---|---|
| BoundingBox | Bounding Box construction. | |
| BoundingBoxIntersection | Box intersection and Inside tests. | |
| Box | Intersect a box with a ray. | |
| BrownianPoints | Produce a random vector at each point in a dataset. |  |
| CardinalSpline | Cardinal spline Interpolation. | |
| Casting | Casting VTK objects. | |
| CheckVTKVersion | Check VTK Version and provide alternatives for different VTK versions | |
| ColorLookupTable | Color Lookup Table. | |
| ColorMapToLUT | Use vtkDiscretizableColorTransferFunction to generate a VTK colormap. |  |
| ColorTransferFunction | Color Transfer Function. | |
| CommandSubclass | Instead of using a callback function, it is more powerful to subclass vtkCommand. |  |
| ConstrainedDelaunay2D | Perform a 2D Delaunay triangulation on a point set respecting a specified boundary. | 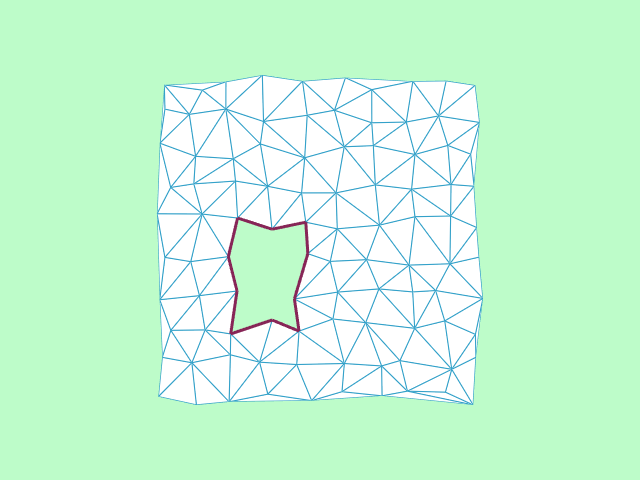 |
| Coordinate | Coordinate system conversions. | |
| DeepCopy | Deep copy a VTK object. | |
| Delaunay2D | Perform a 2D Delaunay triangulation on a point set. |  |
| DetermineActorType | Determine the type of an actor. |  |
| DiscretizableColorTransferFunction | Discretizable Color Transfer Function. | |
| ExtractFaces | Extract faces froam vtkUnstructuredGrid. | |
| FileOutputWindow | Write errors to a log file instead of the screen. | |
| FilenameFunctions | Do things like get the file extension, strip the file extension, etc. | |
| FilterSelfProgress | Monitor a filters progress. | |
| ForLoop | Demonstrating various ways of implementing a for loop in VTK. | |
| FrameRate | Get the frame rate of the rendering. |  |
| FullScreen | Maximize/full screen a vtkRenderWindow. |  |
| FunctionParser | String function parser. | |
| GetClassName | Determine the type of a VTK variable. | |
| GetDataRoot | Find the path of VTK_DATA_ROOT. | |
| LUTUtilities | A utility class for vtkLookupTable allowing you to output the table contents or to compare tables. | |
| MassProperties | Compute volume and surface area of a closed, triangulated mesh. | |
| MultipleRenderWindows | Multiple Render Windows. |  |
| MultipleViewports | Multiple Viewports. |  |
| OffScreenRendering | Off Screen Rendering. | |
| PCADemo | Project 2D points onto the best 1D subspace (PCA Demo). |  |
| PCAStatistics | Compute Principal Component Analysis (PCA) values. | |
| PassThrough | Pass input along to outpu. | |
| PiecewiseFunction | Interpolation using a piecewise function. | |
| PointInPolygon | Point inside polygon test. | |
| RenderScalarToFloatBuffer | Demonstrates how to render scalars in a vtkPolyData object into a vtkFloatArray buffer for further processing. |  |
| RescaleReverseLUT | Demonstrate how to adjust a colormap so that the colormap scalar range matches the scalar range on the object. You can optionally reverse the colors. |  |
| ResetCameraOrientation | Reset camera orientation to a previously saved orientation. |  |
| ReportRenderWindowCapabilities | Report the capabilities of a render window. | |
| SaveSceneToFieldData | Save a vtkCamera's state in a vtkDataSet's vtkFieldData and restore it. |  |
| SaveSceneToFile | Save a vtkCamera's state in a file and restore it. |  |
| Screenshot |  | |
| ShallowCopy | Shallow copy a VTK object. | |
| ShareCamera | Share a camera between multiple renderers. |  |
| ShepardMethod | Shepard method interpolation. |  |
| SideBySideViewports | Side by side viewports. |  |
| TimeStamp | Time stamp. | |
| Timer |  | |
| TimerLog | Timer log. | |
| Variant | Convert between data types. | |
| Vector | Mathematical vector class. | |
| ViewportBorders | Draw a border around each viewport. |  |
| VisualDebugging | Update the screen from inside an algorithm. | |
| ZBuffer | zbuffer. |
Arrays
| Example Name | Description | Image |
|---|---|---|
| 2DArray | 2D Array. | |
| 3DArray | 3D Array. | |
| ArrayCalculator | Perform in-place operations on arrays. | |
| ArrayLookup | Find the location of a value in a vtkDataArray. | |
| ArrayRange | Get the bounds (min,max) of a vtk array. | |
| ArrayToTable | Convert a vtkDenseArray to a vtkTable. | |
| ArrayWriter | Write a DenseArray or SparseArray to a file. | |
| ConstructTable | A table is a 2D array of any type of elements. They do not all have to be the same type. This is achieved using vtkVariant. | |
| CustomDenseArray | Custom type Dense (2D) Array. | |
| DenseArrayRange | Get the bounds of a vtkDenseArray. | |
| ExtractArrayComponent | Extract a component of an array. | |
| KnownLengthArray | Known Length Array. | |
| SortDataArray | Reorder array values based on an ordering (key) array. | |
| SparseArray | Sparse Array. | |
| UnknownLengthArray | Unknown Length Array. | |
| VectorArrayKnownLength | Array of Vectors (Known Length). | |
| VectorArrayUnknownLength | Array of Vectors (Unknown Length). |
Events
| Example Name | Description | Image |
|---|---|---|
| CameraModifiedEvent | Catch the camera modified event. |  |
| ObserveError | Catch errors and warnings. | |
| WindowModifiedEvent | Catch the window modified event. |  |
CMake Techniques
| Example Name | Description | Image |
|---|---|---|
| Check if a specific module is present |
Math Operations
| Example Name | Description | Image |
|---|---|---|
| 1DTupleInterpolation | A simple example demonstrating how functions defined by sparsely distributed supporting points can be interpolated at arbitrary positions. | |
| EigenSymmetric | Compute eigenvalues and eigenvectors of a symmetric matrix. | |
| HomogeneousLeastSquares | Homogeneous Least Squares. | |
| LUFactorization | LU Factorization. | |
| LeastSquares | Least Squares. | |
| MatrixInverse | Matrix inverse. | |
| MatrixTranspose | Matrix transpose. | |
| NormalizeVector | Normalize a vector. | |
| PerpendicularVector | Get a vector perpendicular to another vector. | |
| VectorDot | ||
| VectorNorm | Get the lengths of an array of vectors. |
Graphs
| Example Name | Description | Image |
|---|---|---|
| AdjacencyMatrixToEdgeTable | Convert an adjacency matrix to an edge table. | |
| AdjacentVertexIterator | Get all vertices connected to a specified vertex. |  |
| BoostBreadthFirstSearchTree | Breadth first search tree. Can also be used to convert a graph to a tree. |  |
| BreadthFirstDistance | Distance from origin. | |
| ColorEdges | Color edges. |  |
| ColorVertexLabels | Set the color of vertex labels. |  |
| ColorVerticesLookupTable | Color vertices. |  |
| ConnectedComponents | Find connected components of a graph. | |
| ConstructGraph | Construct a graph. |  |
| ConstructTree | Construct a tree. |  |
| CreateTree | Create a tree and label the vertices and edges. |  |
| DepthFirstSearchAnimation | Depth First Search Animation. |  |
| DepthFirstSearchIterator | Depth First Search iterator. | |
| EdgeListIterator | Iterate over edges of a graph. | |
| EdgeWeights | Edge weights. |  |
| GraphPoints | Manually set coordinates of vertices in a graph. |  |
| GraphToPolyData | Convert a graph to a PolyData. |  |
| InEdgeIterator | Iterate over edges incoming to a vertex. | |
| LabelVerticesAndEdges | Label vertices and edges. |  |
| MinimumSpanningTree | Minimum spanning tree of a graph. | |
| MutableGraphHelper | Create either a vtkMutableDirectedGraph or vtkMutableUndirectedGraph. |  |
| NOVCAGraph | Create a graph & visualize it in ParaView/VisIt. | |
| OutEdgeIterator | Iterate over edges outgoing from a vertex. | |
| RandomGraphSource | Create a random graph. |  |
| RemoveIsolatedVertices | Remove vertices of degree 0 from a vtkGraph. | |
| ScaleVertices | Size/scale vertices based on a data array. |  |
| SelectedVerticesAndEdges | Get a list of selected vertices and edges. | 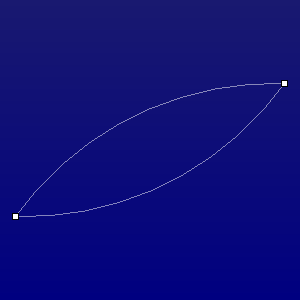 |
| SelectedVerticesAndEdgesObserver | Get a list of selected vertices and edges using an observer of AnnotationChangedEvent. |  |
| ShortestPath | Find the shortest path on a graph. |  |
| SideBySideGraphs | Display two graphs side by side. |  |
| TreeBFSIterator | Breadth First Search iterator. | |
| VertexSize | Set the size of vertices. |  |
| VisualizeDirectedGraph | Visualize a directed graph. |  |
| VisualizeGraph | Visualize a graph. | 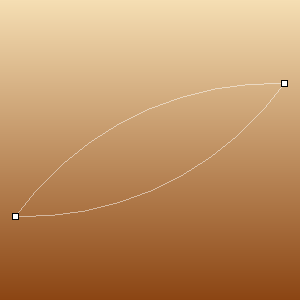 |
Graph Conversions
Data Structures
| Example Name | Description | Image |
|---|---|---|
| AttachAttributes | Attach attributes to a VTK array | |
| CellLocator | Project a point onto a mesh. Closest point on a mesh.Efficient 3D cell query. | |
| CellLocatorVisualization | Visualization of the tree of a vtkCellLocator. |  |
| CellTreeLocator | Points inside an object using vtkCellTreeLocator. | |
| PointLocator | Efficient 3D point query. |  |
| PointLocatorRadius | Find all points within a radius of a specified point. | |
| PointLocatorVisualization | Visualization of the tree of a vtkPointLocator. |  |
Timing Demonstrations
| Example Name | Description | Image |
|---|---|---|
| KDTreeTimingDemo | Plot the runtime vs MaxLevel (doesn't seem correct) | 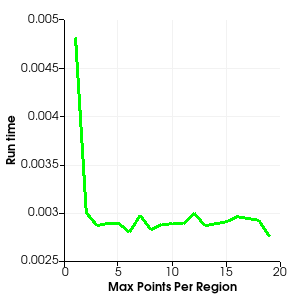 |
| ModifiedBSPTreeTimingDemo | Plot the runtime vs MaxLevel | 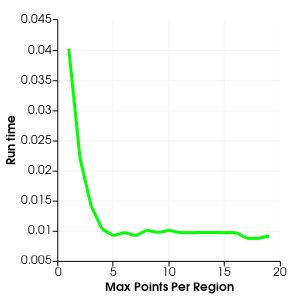 |
| OBBTreeTimingDemo | Plot the runtime vs MaxLevel |  |
| OctreeTimingDemo | Plot the runtime vs MaxPointsPerRegionOctree timing demo. | 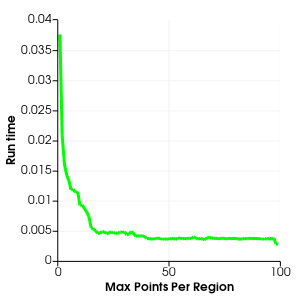 |
KD-Tree
| Example Name | Description | Image |
|---|---|---|
| BuildLocatorFromKClosestPoints | ||
| ClosestNPoints | Find the closest N points to a query point. | |
| DataStructureComparison | Illustrates, side by side, the differences between several spatial data structures |  |
| KDTreeAccessPoints | Access the points of a KDTree. | |
| KDTreeFindPointsWithinRadius | Find points within a specified radius of a query point. | |
| KDTreeFindPointsWithinRadiusDemo | Find points within a range of radii. | 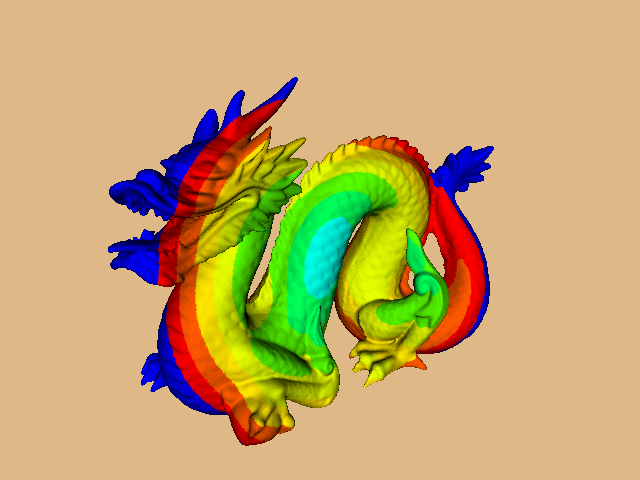 |
| KdTree | ||
| KdTreePointLocatorClosestPoint | Find the closest point to a query point. | |
| OctreeFindPointsWithinRadiusDemo | Find points within a range of radii. |  |
| PointLocatorFindPointsWithinRadiusDemo | Find points within a range of radii. |  |
| StaticLocatorFindPointsWithinRadiusDemo | Find points within a range of radii. |  |
| VisualizeKDTree | Visualize levels of the tree. | 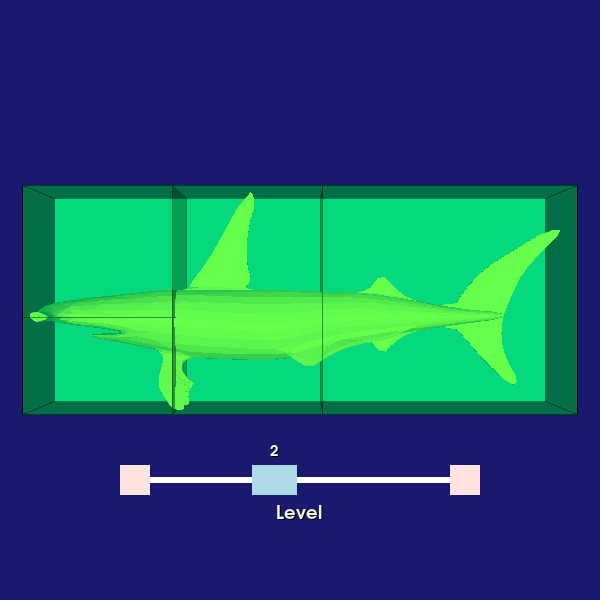 |
Oriented Bounding Box (OBB) Tree
| Example Name | Description | Image |
|---|---|---|
| OBBTreeExtractCells | Intersect a line with an OBB Tree and display all intersected cells. | 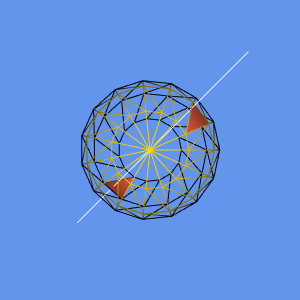 |
| OBBTreeIntersectWithLine | Intersect a line with a vtkOBBTree. | |
| VisualizeOBBTree | Visualize levels of the tree. |  |
Octree
| Example Name | Description | Image |
|---|---|---|
| BuildOctree | Create an octree. | |
| IncrementalOctreePointLocator | Insert points into an octree without rebuilding it. | |
| OctreeClosestPoint | Find the closest point to a query point. | |
| OctreeFindPointsWithinRadius | Find the points within a sphere of specified radius to a query point. | |
| OctreeKClosestPoints | Find the K closest points to a query point. | |
| OctreeVisualize | Visualize levels of the tree. | 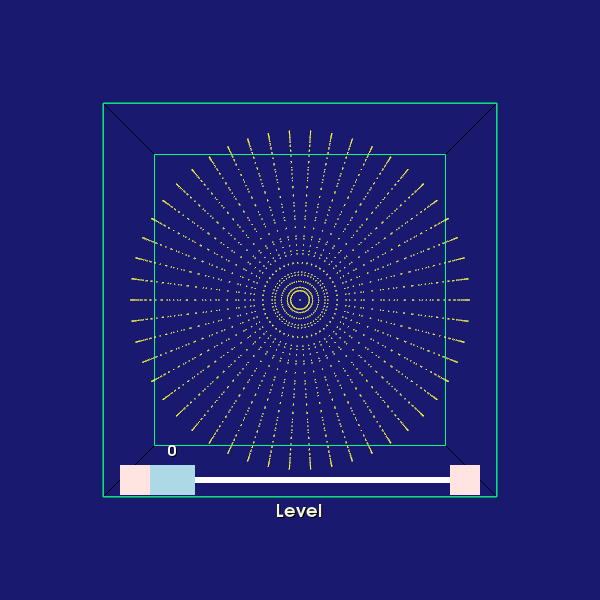 |
Modified BSP Tree
| Example Name | Description | Image |
|---|---|---|
| ModifiedBSPTreeExtractCells | Intersect a line with a modified BSP Tree and display all intersected cells. |  |
| ModifiedBSPTreeIntersectWithLine | Intersect a line with a modified BSP Tree. | |
| VisualizeModifiedBSPTree | Visualize levels of the tree. |  |
HyperTreeGrid
| Example Name | Description | Image |
|---|---|---|
| HyperTreeGridSource | Create a vtkHyperTreeGrid. |  |
VTK Concepts
| Example Name | Description | Image |
|---|---|---|
| Scalars | Attach a scalar value to each point (PointData) or cell (CellData) in a data set. |
Rendering
| Example Name | Description | Image |
|---|---|---|
| AmbientSpheres | Demonstrates the effect of ambient lighting on spheres. |  |
| CameraBlur | Example of a scene rendered with focal depth. | 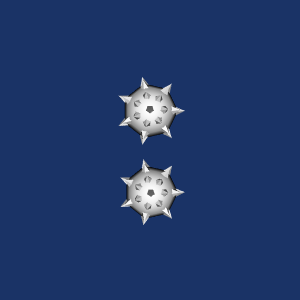 |
| ColoredSphere | A simple sphere. |  |
| Cone3 | Four frames of output, based on the VTK example Cone3.cxx. | 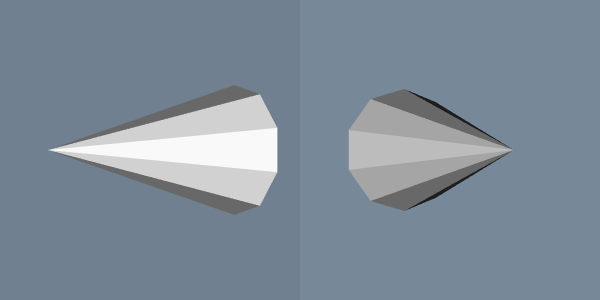 |
| Cone4 | Modifying properties and transformation matrix based on the VTK example Cone4.cxx. |  |
| DiffuseSpheres | Demonstrates the effect of diffuse lighting on spheres. |  |
| FlatVersusGouraud | Flat and Gouraud shading. Different shading methods can dramatically improve the look of an object represented with polygons. On the top, flat shading uses a constant surface normal across each polygon. On the bottom, Gouraud shading interpolates normals from polygon vertices to give a smoother look. | 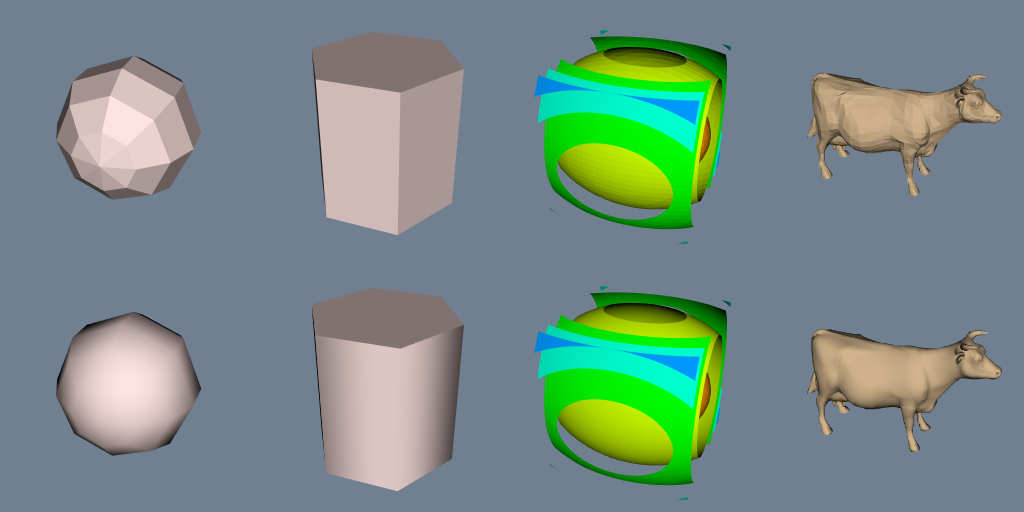 |
| GradientBackground | Demonstrates the background shading options. | 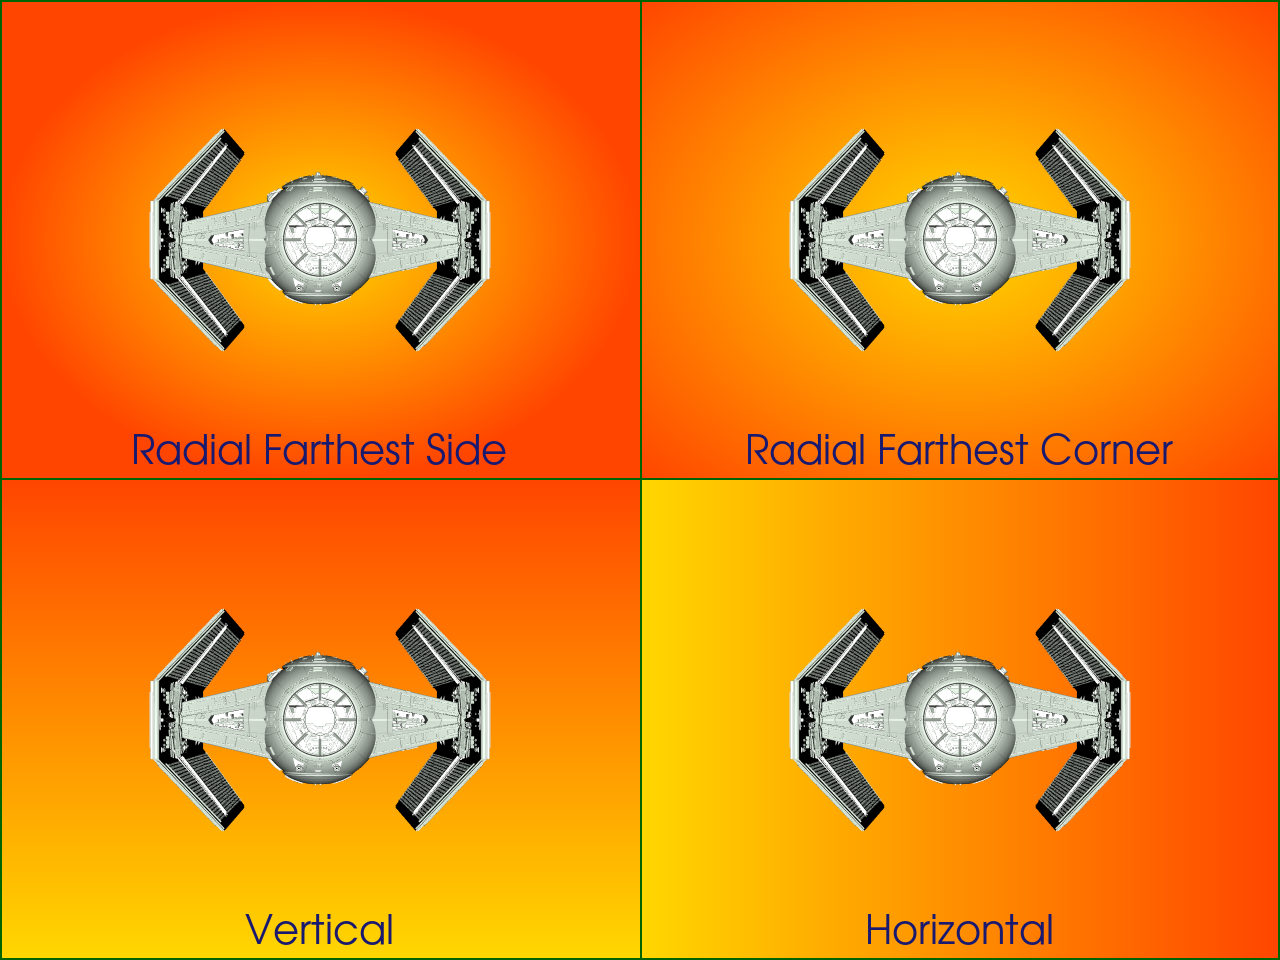 |
| HiddenLineRemoval | Hidden lines removed. |  |
| LayeredActors | Demonstrates the use of two linked renderers. The orientation of objects in the non active layer is linked to those in the active layer. |  |
| Mace | An example of multiple inputs and outputs. | 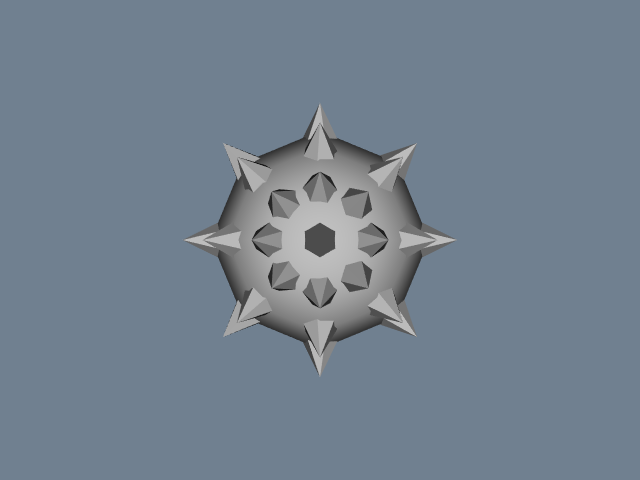 |
| Model | Illustrative diagram of graphics objects. | 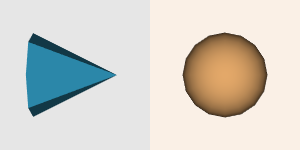 |
| MotionBlur | Example of motion blur. | 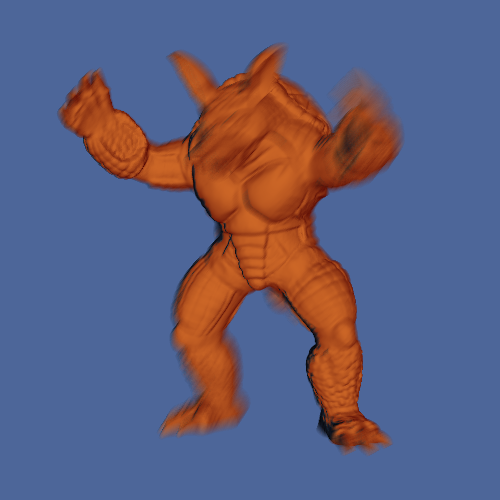 |
| OutlineGlowPass | Demonstrates how to render a object in a scene with a glowing outline. |  |
| PBR_Anisotropy | Render spheres with different anisotropy values. |  |
| PBR_Clear_Coat | Render a cube with custom texture mapping and a coat normal texture. | |
| PBR_Edge_Tint | Render spheres with different edge colors using a skybox as image based lighting. |  |
| PBR_HDR_Environment | Renders spheres with different materials using a skybox as image based lighting. |  |
| PBR_Mapping | Render a cube with custom texture mapping. | 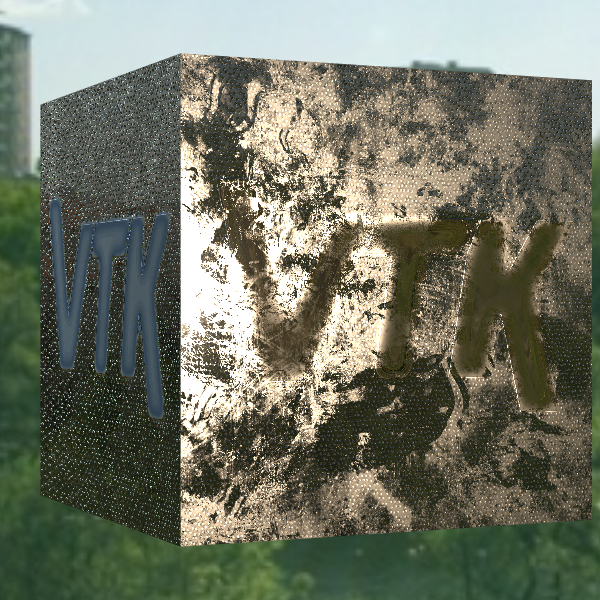 |
| PBR_Materials | Renders spheres with different materials using a skybox as image based lighting. |  |
| PBR_Materials_Coat | Render spheres with different coat materials using a skybox as image based lighting. |  |
| PBR_Skybox | Demonstrates physically based rendering, a skybox and image based lighting. |  |
| PBR_Skybox_Texturing | Demonstrates physically based rendering, a skybox, image based lighting and texturing. |  |
| PBR_Skybox_Anisotropy | Demonstrates physically based rendering, a skybox, image based lighting, and anisotropic texturing. |  |
| Rainbow | Use and manipulation of vtkLookupTables. | 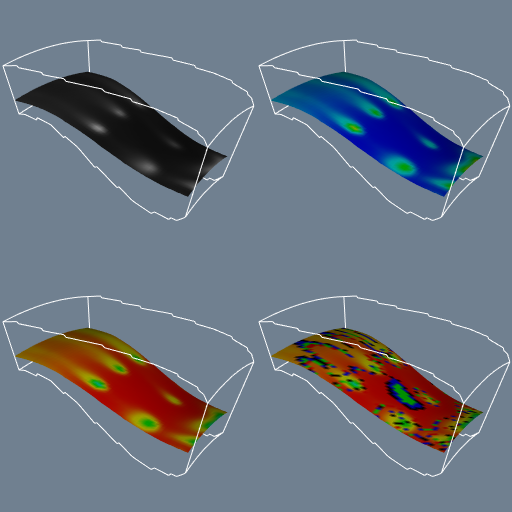 |
| Rotations | Rotations of a cow about her axes. |  |
| RotationsA | Perform six rotations of a cow about her x-axis (Figure 3-31a). |  |
| RotationsB | Perform six rotations of a cow about her y-axis (Figure 3-31b). | 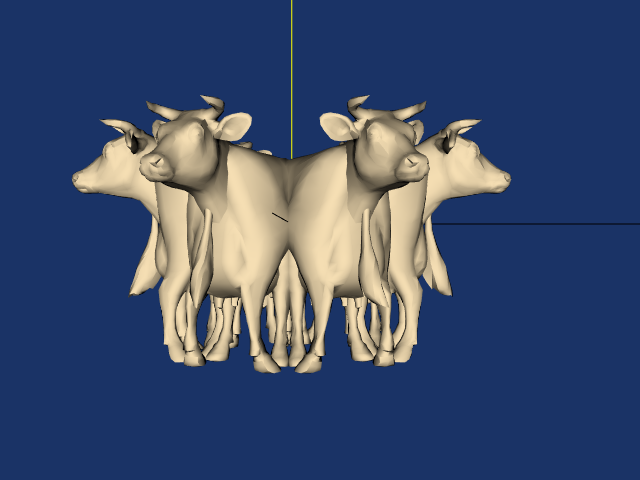 |
| RotationsC | Perform six rotations of a cow about her z-axis (Figure 3-31c). |  |
| RotationsD | First a rotation of a cow about her x-axis, then six rotations about her y-axis (Figure 3-31d). |  |
| Shadows | Draw model with shadows. |  |
| SpecularSpheres | Demonstrates the effect of specular lighting on spheres. |  |
| StippledLine | Draw a stippled line. |  |
| StringToImageDemo | Demonstrates how to generate images from strings. |  |
| StripFran | Triangle strip examples. (a) Structured triangle mesh consisting of 134 strips each of 390 triangles. (b) Unstructured triangle mesh consisting of 2227 strips of average length 3.94, longest strip 101 triangles. Images are generated by displaying every other triangle strip. |  |
| TransformSphere | The addition of a transform filter to ColoredSphere. | |
| TransparentBackground | Demonstrates the use of two renderers. Notice that the second (and subsequent) renderers will have a transparent background. | |
| WalkCow | This generates Figs. 3-32, 3-33 found in VTKTextbook.pdf. |  |
| WalkCowA | This generates Fig. 3-33a found in VTKTextbook.pdf. |  |
| WalkCowB | This generates Fig. 3-33b found in VTKTextbook.pdf. |  |
Lighting
| Example Name | Description | Image |
|---|---|---|
| Light | Add a directional light to a scene. |  |
| LightActor | Display the location and direction of a light. |  |
| ShadowsLightsDemo | Show lights casting shadows. |  |
| SpotLights | Create two positional(spot) lights. |  |
Shaders
| Example Name | Description | Image |
|---|---|---|
| BozoShader | Modify the shader to load and use noise functions for color selection. |  |
| BozoShaderDemo | Show the bozo shader on a variety of polydata models. |  |
| ColorByNormal | Modify the shader to color based on model normal. |  |
| CubeMap | Modify the Vertex and Frament shaders to apply a 6-sided cube map. |  |
| MarbleShader | Modify the shader to load and use noise functions for color selection. |  |
| MarbleShaderDemo | Explore parameter space with sliders. |  |
| SpatterShader | Modify the shader to load and use noise functions for color selection. |  |
| SphereMap | Modify the Vertex and Frament shaders to apply a spherical map. |  |
Annotation
| Example Name | Description | Image |
|---|---|---|
| MultiLineText | Display multiline text. |  |
| TextOrigin | The 3D text always faces the active camera. |  |
| XYPlot | Display line probes. | 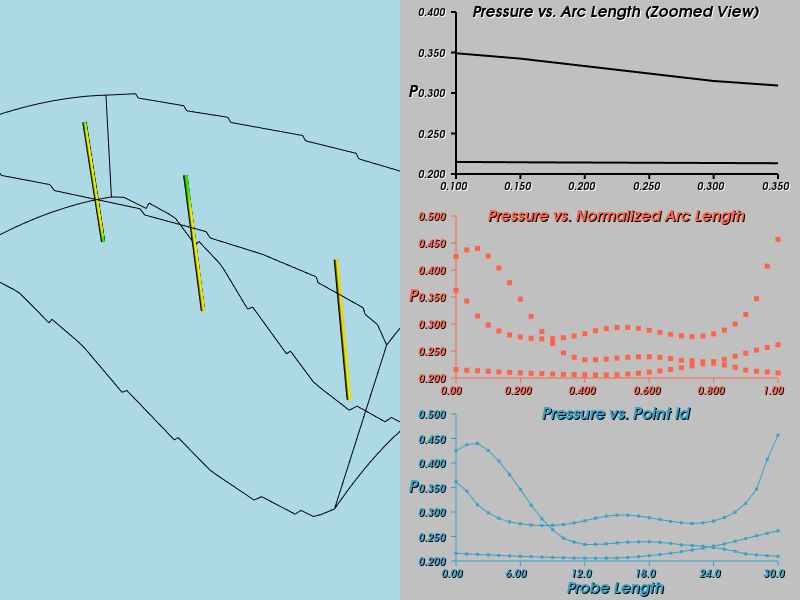 |
Texture Mapping
| Example Name | Description | Image |
|---|---|---|
| AnimateVectors | One frame from a vector field animation using texture maps (animVectors.tcl). |  |
| BackgroundTexture | Use a texture for the background of a vtkRenderer. |  |
| ClipArt | Generate 3D clip art from an image. |  |
| ProjectedTexture | Project a texture onto ovtkPolyData. |  |
| TextureCutQuadric | Cut a quadric with boolean textures. | 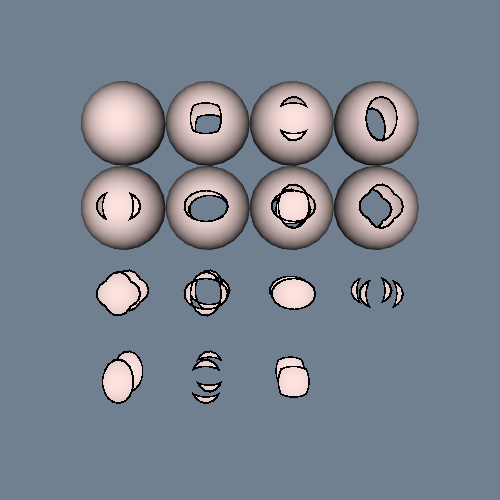 |
| TextureCutSphere | Cut a sphere using texture coordinates. | 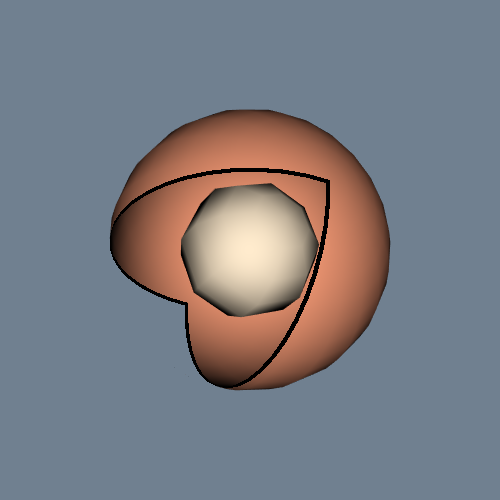 |
| TextureMapImageData | Texture map an ImageData. |  |
| TextureMapPlane | Texture map a plane. |  |
| TextureMapQuad | Texture map a quad. |  |
| TexturePlane | Example of texture mapping. |  |
| TextureThreshold | Demonstrate the use of scalar thresholds to show values of flow density on three planes. |  |
| TexturedSphere | Texture a sphere. |  |
Tutorial
If you are new to VTK then these tutorials will help to get you started.
| Tutorial | Description | Image |
|---|---|---|
| Step 1 | Create a cone, render it and rotate it through 360°. |  |
| Step 2 | Adding an observer. |  |
| Step 3 | Using multiple renderers within a render window. |  |
| Step 4 | The creation of multiple actors and the manipulation of their properties and transformations. |  |
| Step 5 | Introducing the concept of interaction. |  |
| Step 6 | Using a 3D widget. |  |
Visualization
See this tutorial for a brief explanation of the VTK terminology of mappers, actors, etc.
| Example Name | Description | Image |
|---|---|---|
| AlphaFrequency | Linearly extrude fonts to show letter frequencies in text. | 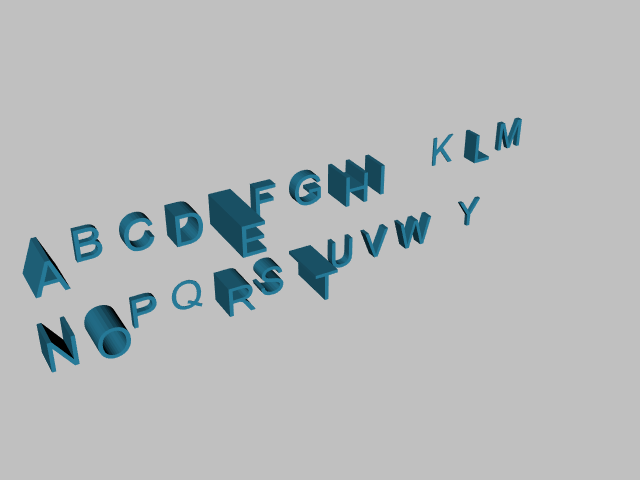 |
| AnatomicalOrientation | Show a labelled set of anatomical planes transecting a human figure. |  |
| AnnotatedCubeActor | Annotated cube. |  |
| Arbitrary3DCursor | Track a 3D cursor. |  |
| AssignCellColorsFromLUT | Demonstrates how to assign colors to cells in a vtkPolyData structure using lookup tables. |  |
| AxisActor | Generate a single axis. | 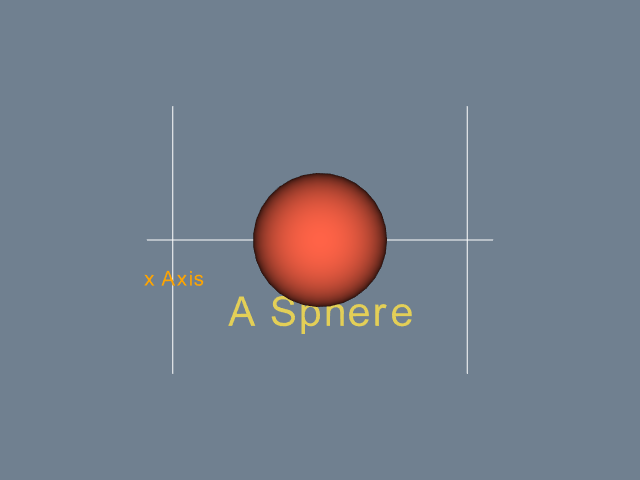 |
| BackfaceCulling | Backface culling. |  |
| BackgroundColor | Background color. |  |
| BackgroundGradient | Background gradient. |  |
| BillboardTextActor3D | Label points with billboards. |  |
| BlobbyLogo | Blobby logo from VTK textbook. |  |
| Blow | Ten frames from a blow molding finite element analysis. | 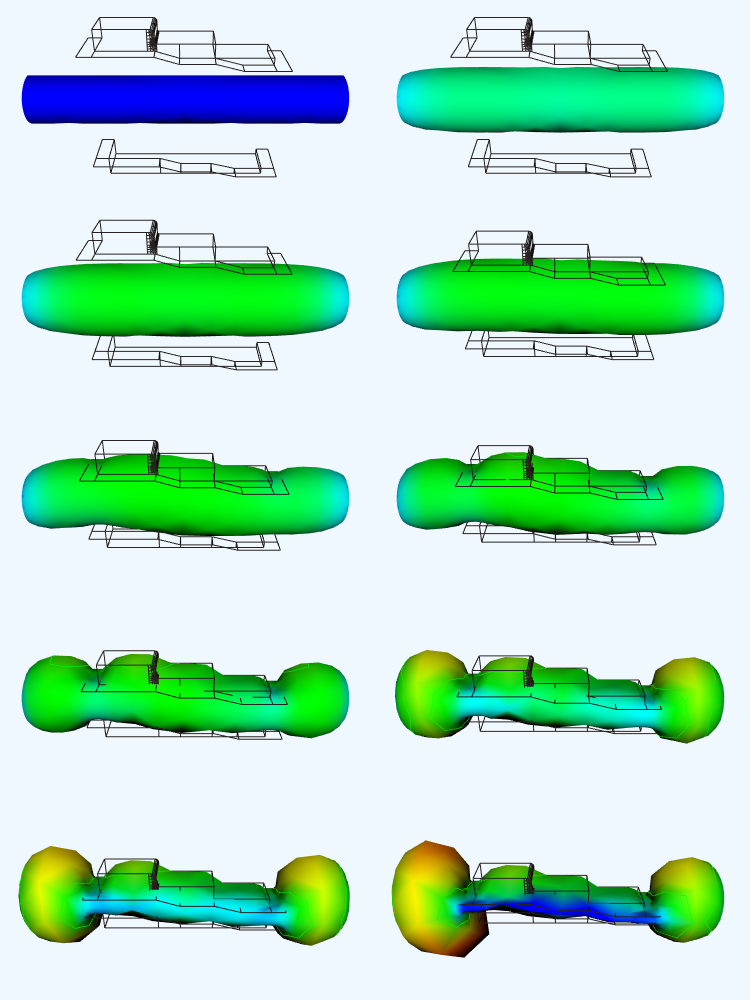 |
| BluntStreamlines | Demonstrates airflow around a blunt fin using streamlines. | 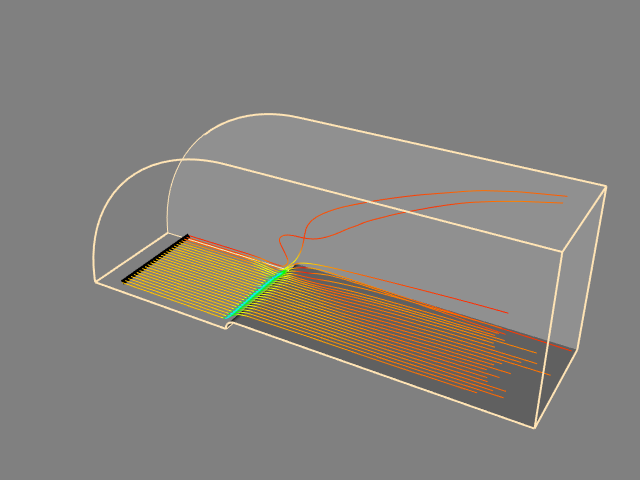 |
| Camera | Positioning and aiming the camera. |  |
| CameraActor | Visualize a camera (frustum) in a scene. |  |
| CameraModel1 | Illustrate camera movement around the focal point. |  |
| CameraModel2 | Illustrate camera movement centered at the camera position. |  |
| CaptionActor2D | Draw a caption/bubble pointing to a particular point. |  |
| CarotidFlow | Visualizing blood flow in the human carotid arteries. Streamtubes of flow velocity are generated. | 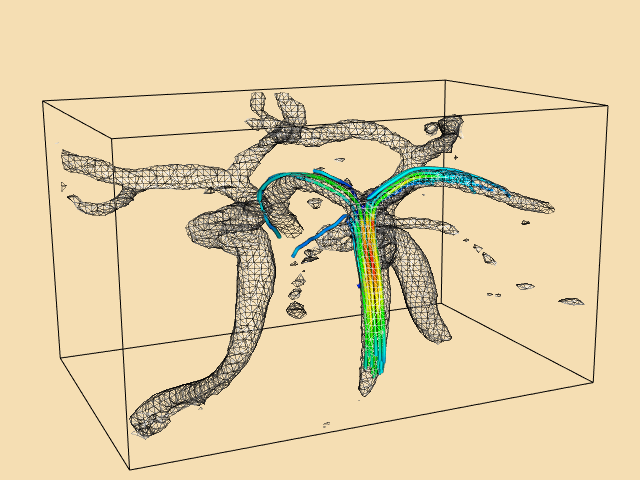 |
| CarotidFlowGlyphs | Visualizing blood flow in human carotid arteries. Cone glyphs indicate flow direction and magnitude. |  |
| ChooseTextColor | Choose a text color that contrasts with a background color. |  |
| ChooseTextColorDemo | Create a grid of random colored viewpports and pick a good text color. |  |
| ClipSphereCylinder | A plane clipped with a sphere and an ellipse. The two transforms place each implicit function into the appropriate position. Two outputs are generated by the clipper. |  |
| CloseWindow | Close a render window. |  |
| CollisionDetection | Collison between two spheres. |  |
| ColorActorEdges | Color the edges of an Actor. | 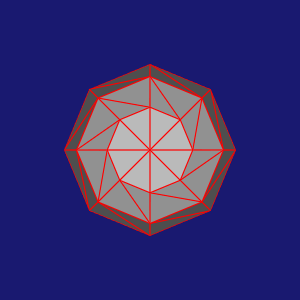 |
| ColorAnActor | Color an Actor. |  |
| ColorGlyphs | Color glyphs. |  |
| ColorSeriesPatches | Creates a HTML file called VTKColorSeriesPatches | |
| ColoredAnnotatedCube | How to color the individual faces of an annotated cube. |  |
| CombustorIsosurface | Generate an isosurface of constant flow density. | 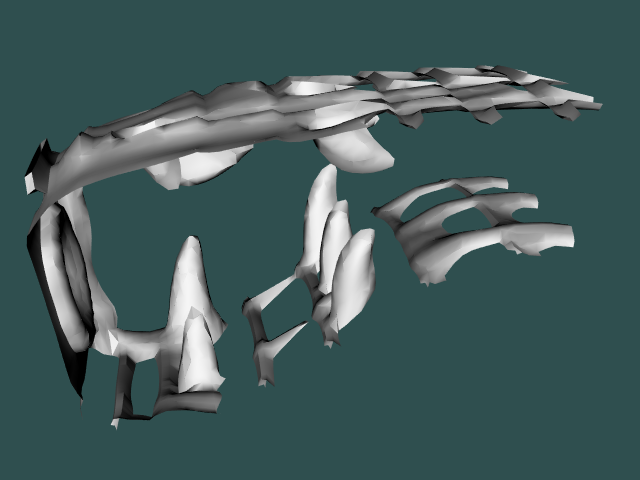 |
| ComplexV | ComplexV from the VTK Textbook. | 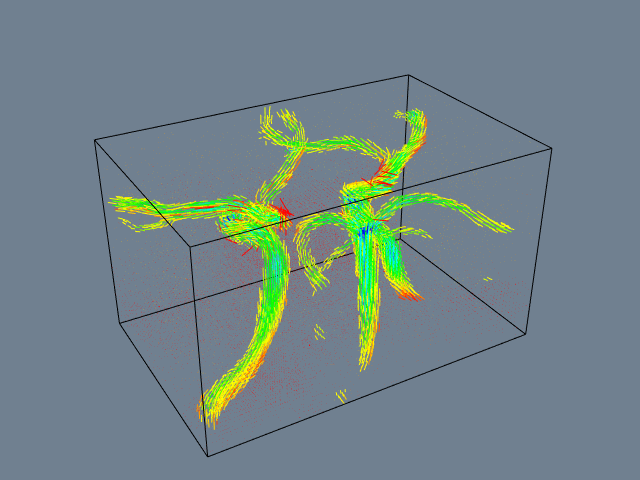 |
| ContourQuadric | Contouring a quadric function. | 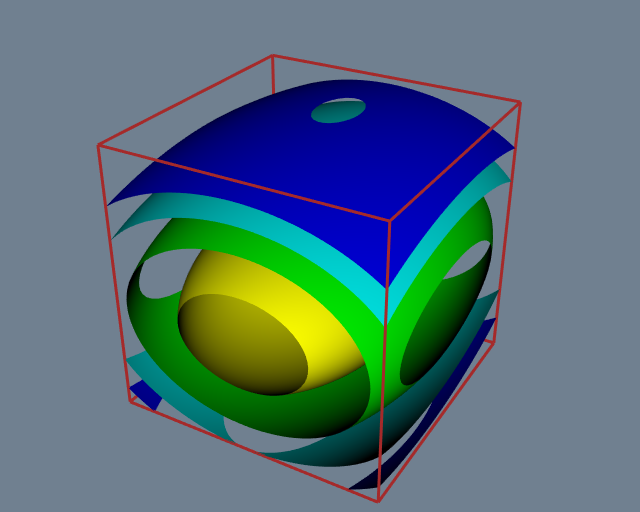 |
| CornerAnnotation | Write text in the corners of a window. |  |
| CorrectlyRenderTranslucentGeometry | Correctly Rendering Translucent Geometry. | |
| CreateBFont | A scanned image clipped with a scalar value of 1/2 its maximum intensity produces a mixture of quadrilaterals and triangles. |  |
| CreateColorSeriesDemo | Create a custom vtkColorSeries. | 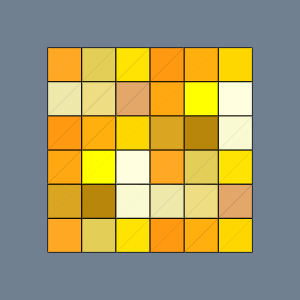 |
| CubeAxesActor | Display three orthogonal axes with labels. | 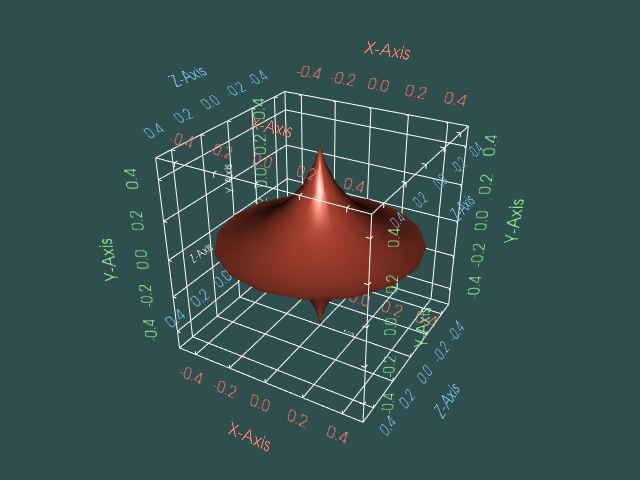 |
| CubeAxesActor2D | This example uses the vtkCubeAxesActor2D to show your scene with axes to indicate the spatial extent of your data. |  |
| Cursor3D | 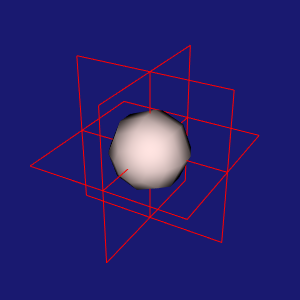 | |
| CursorShape | Change the shape of the cursor. |  |
| CurvatureBandsWithGlyphs | Demonstrates the coloring of a surface by partitioning the gaussian curvature of a surface into bands and using arrows to display the normals on the surface. |  |
| CurvedReformation | Sample a volume with a curved surface. In medical imaging, this is often called curved multi planar reformation. |  |
| CutStructuredGrid | Cut through structured grid with plane. The cut plane is shown solid shaded. A computational plane of constant k value is shown in wireframe for comparison. The colors correspond to flow density. Cutting surfaces are not necessarily planes: implicit functions such as spheres, cylinders, and quadrics can also be used. |  |
| Cutter | How to use vtkCutter by cutting through a cube. |  |
| DataSetSurface | Cutting a hexahedron with a plane. The red line on the surface shows the cut. |  |
| DecimateFran | Examples of decimation algorithm. (a) Decimation of laser digitizer data. |  |
| DecimateHawaii | Examples of decimation algorithm. (b) Decimation of terrain data. | 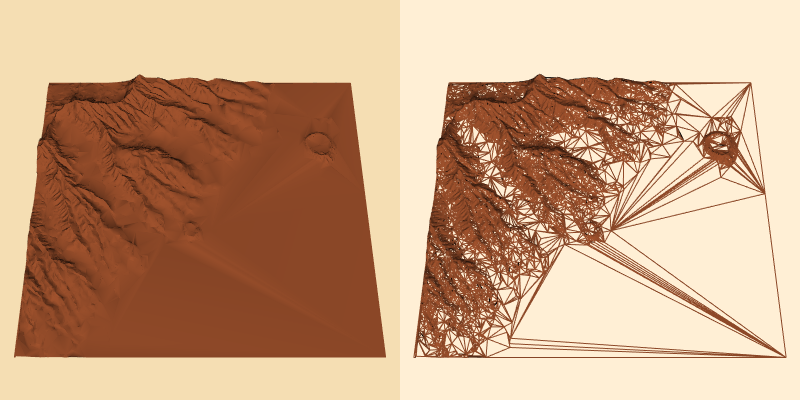 |
| DepthSortPolyData | Poly Data Depth Sorting. | 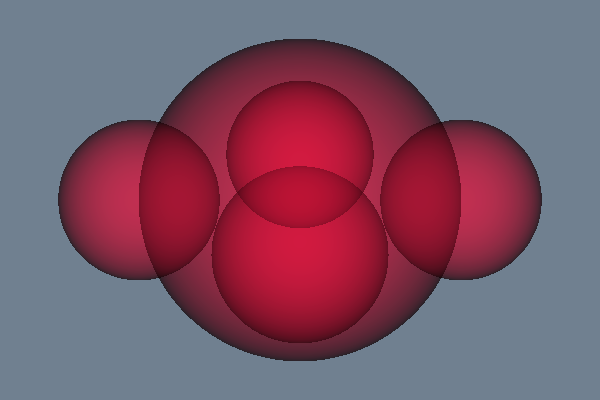 |
| DisplacementPlot | Show modal lines for a vibrating beam. |  |
| DisplayCoordinateAxes | Display coordinate axes. |  |
| DisplayQuadricSurfaces | Display Quadric Surfaces. |  |
| DistanceToCamera |  | |
| DrawText | Display Text. |  |
| EdgePoints | Generate points along an edge. |  |
| ElevationBandsWithGlyphs | Demonstrates the coloring of a surface by partitioning the elevation into bands and using arrows to display the normals on the surface. |  |
| ExponentialCosine | Carpet plots. Visualization of an exponential cosine function. Function values are indicated by surface displacement. Colors indicate derivative values. |  |
| ExtrudePolyDataAlongLine | Extrude a 2D polydata along a line in 3D space. |  |
| FastSplatter | Convolve a splat image with every point in an input image. |  |
| FindCellIntersections | Find the intersection of a line and the cells in an unstructured dataset | 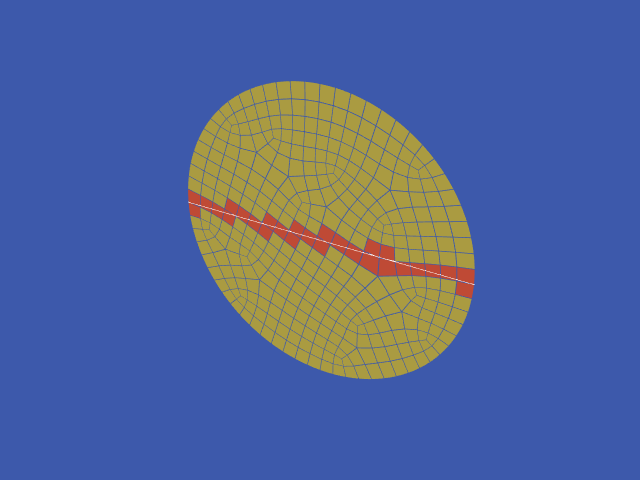 |
| FireFlow | Combine geometry from a VRML file and a solution from a vtkUnstructuredGrid file. | 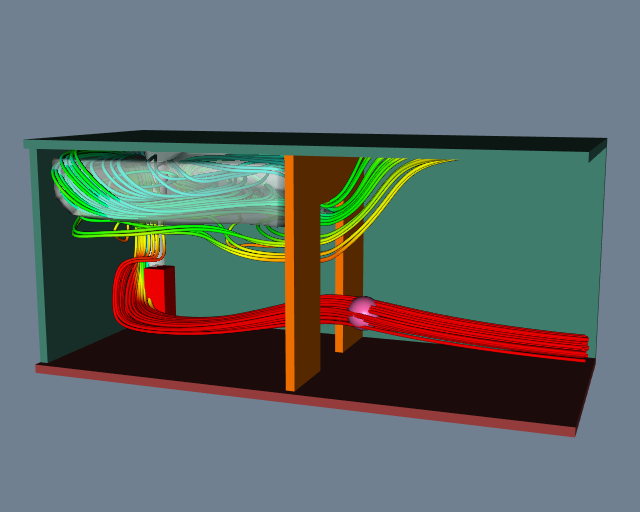 |
| FireFlowDemo | Combine geometry from a VRML file and a solution from a vtkUnstructuredGrid file (interactive). |  |
| FlatShading |  | |
| FlyingHeadSlice | Flying edges used to generate contour lines. | 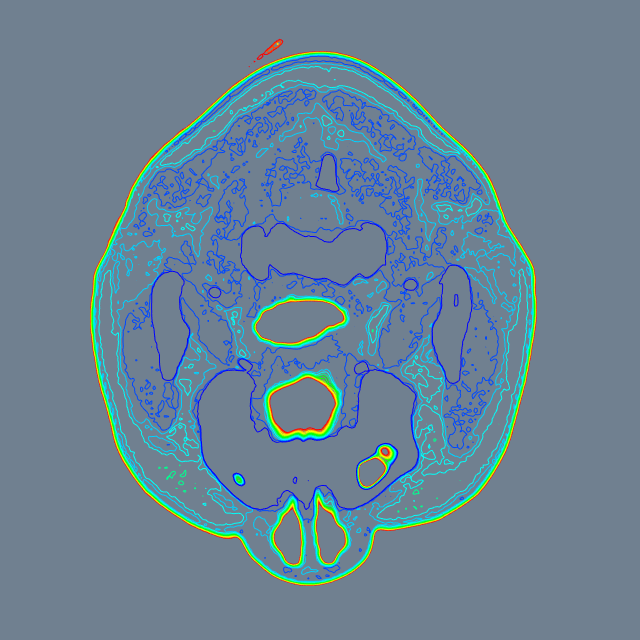 |
| Follower | Draw text that stays right side up. |  |
| FontFile | Use an external font. | 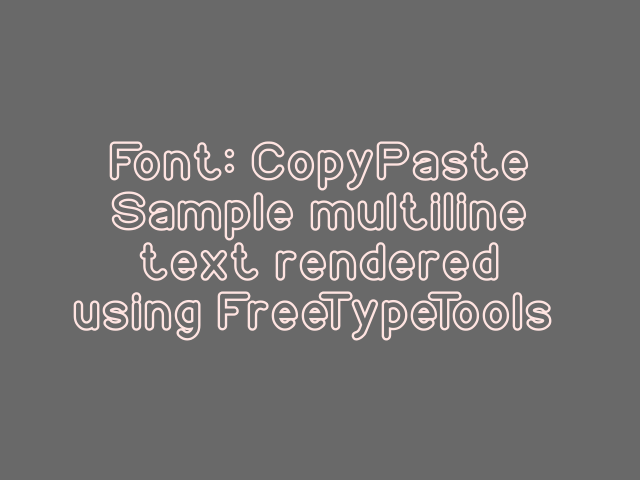 |
| FrogBrain | The frog’s brain. Model extracted without smoothing (left) and with smoothing (right). | 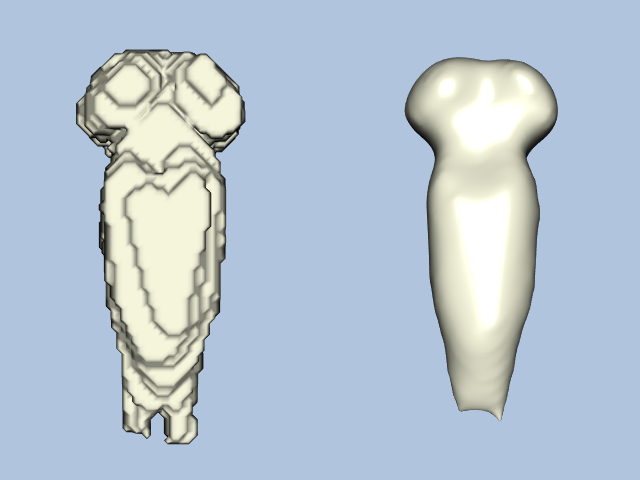 |
| FroggieSurface | Construct surfaces from a segmented frog dataset. Up to fifteen different surfaces may be extracted. You can turn on and off surfaces and control the camera position. |  |
| FroggieView | View surfaces of a segmented frog dataset using preprocessed *.vtk tissue files. You can turn on and off surfaces, control their opacity through the use of sliders and control the camera position. | 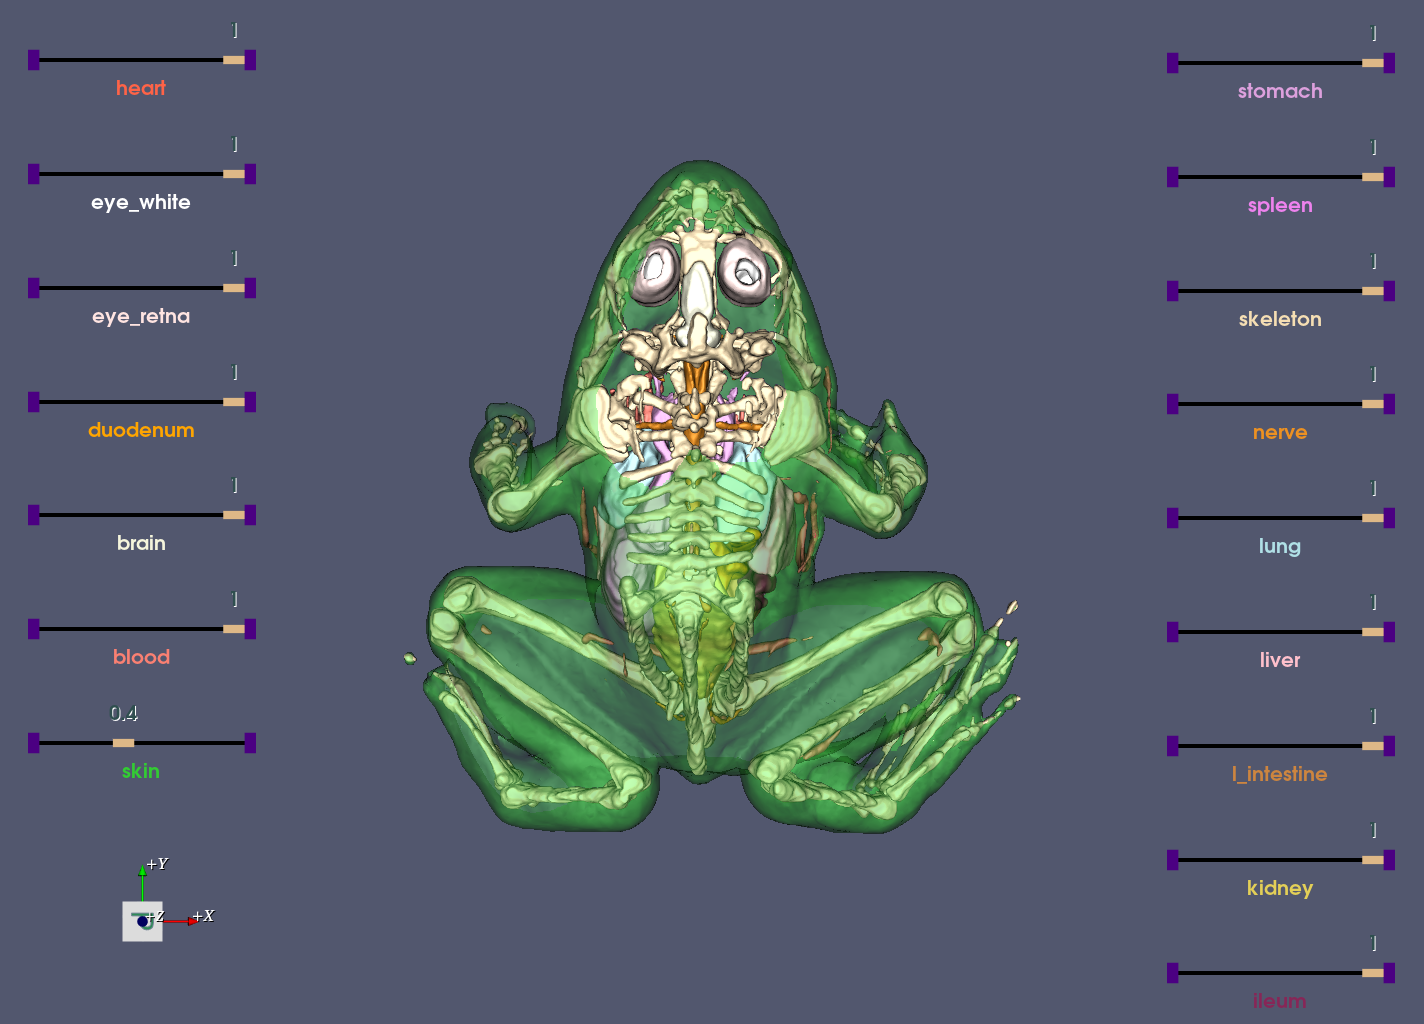 |
| FrogSlice | Photographic slice of frog (upper left), segmented frog (upper right) and composite of photo and segmentation (bottom). The purple color represents the stomach and the kidneys are yellow. |  |
| Glyph2D |  | |
| Glyph3D |  | |
| Glyph3DImage | Glyph the points in a vtkImageData. |  |
| Glyph3DMapper |  | |
| Hanoi | Towers of Hanoi. | 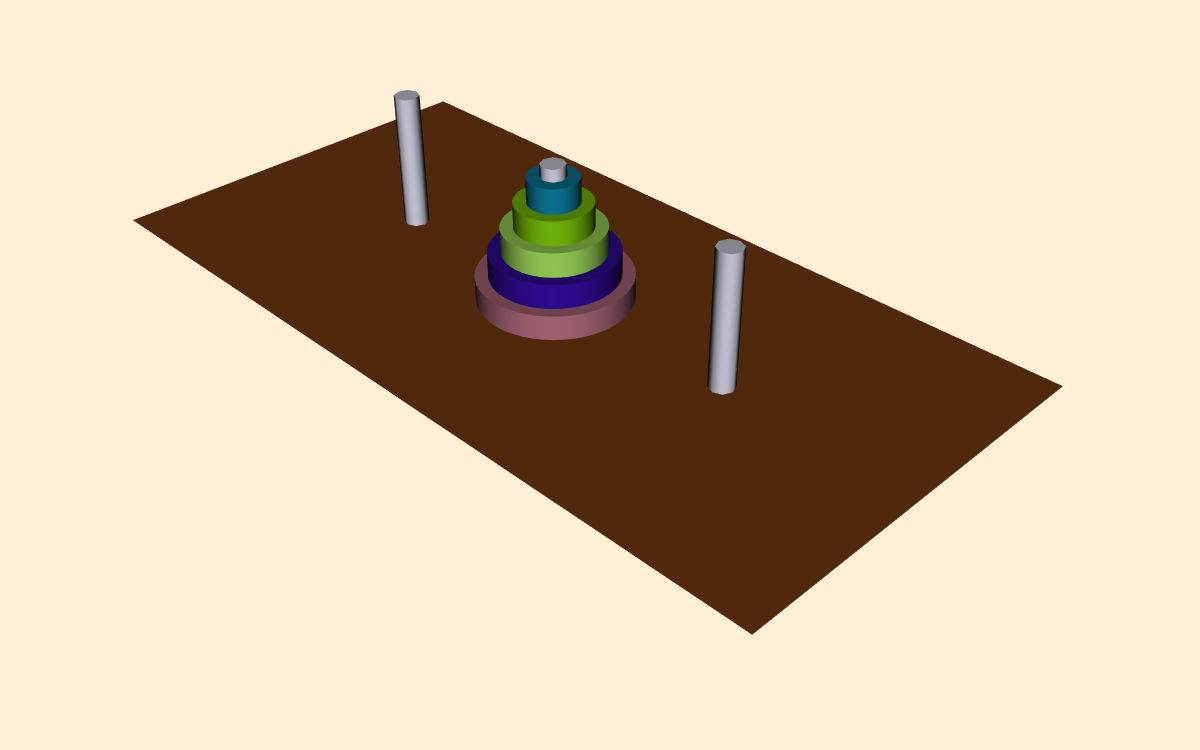 |
| HanoiInitial | Towers of Hanoi - Initial configuration. |  |
| HanoiIntermediate | Towers of Hanoi - Intermediate configuration. |  |
| Hawaii | Visualize elevations by coloring the scalar values with a lookup table. |  |
| HeadBone | Marching cubes surface of human bone. | 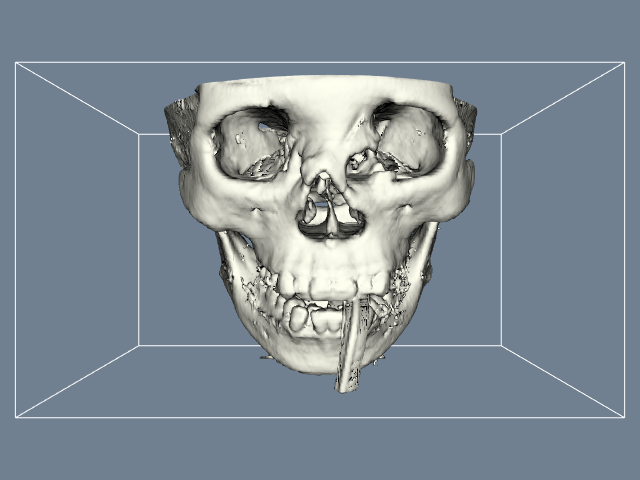 |
| HeadSlice | Marching squares used to generate contour lines. | 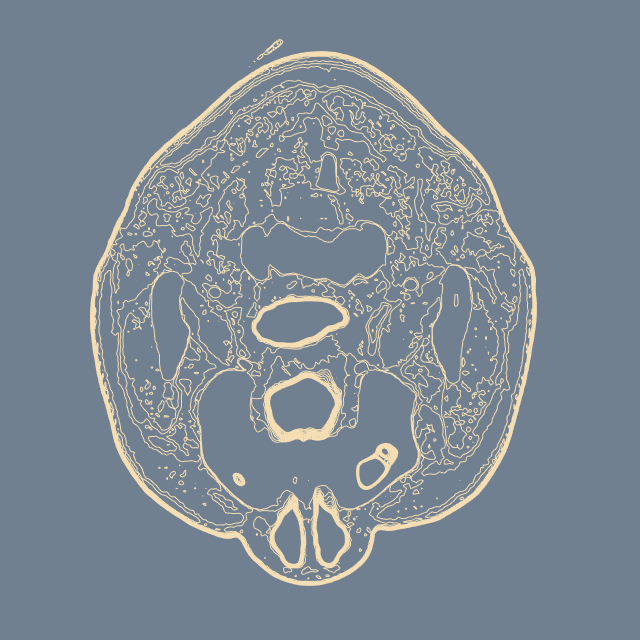 |
| HedgeHog | Create oriented lines (hedgehogs) from vector data. |  |
| HideActor | visible |  |
| HideAllActors | Hide all actors. |  |
| HyperStreamline | Example of hyperstreamlines, the four hyperstreamlines shown are integrated along the minor principle stress axis. A plane (colored with a different lookup table) is also shown. | 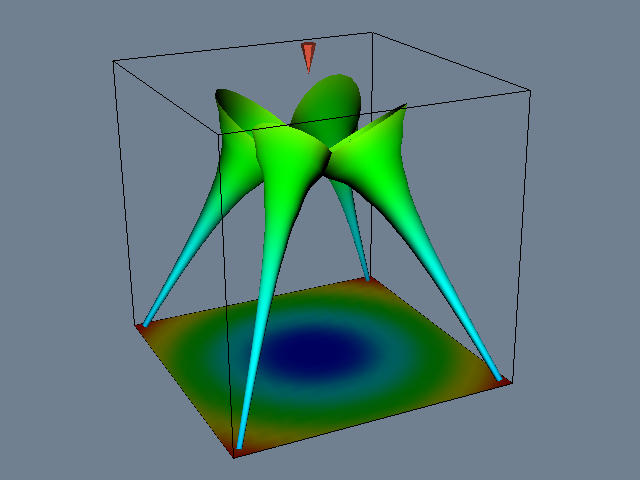 |
| IronIsoSurface | Marching cubes surface of iron-protein. | 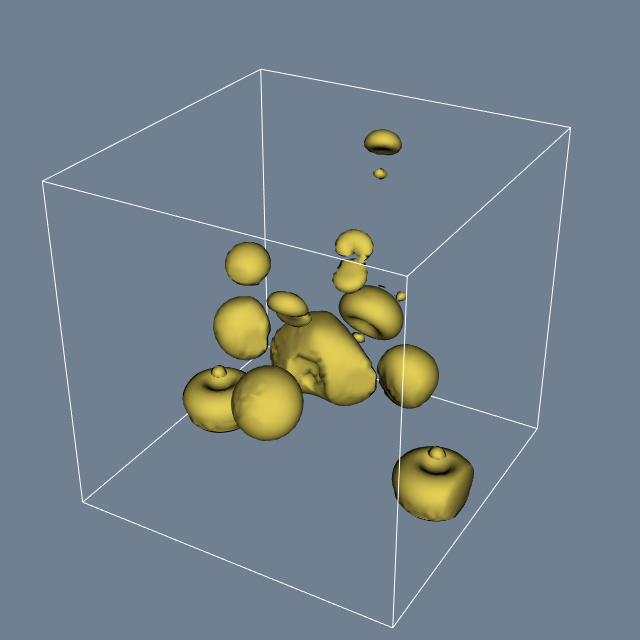 |
| IsosurfaceSampling | Demonstrates how to create point data on an isosurface. | 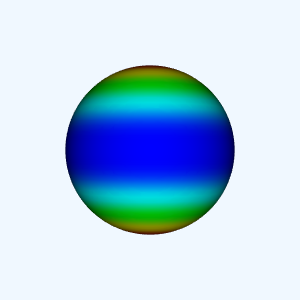 |
| Kitchen | Demonstrates stream tracing in a kitchen. | 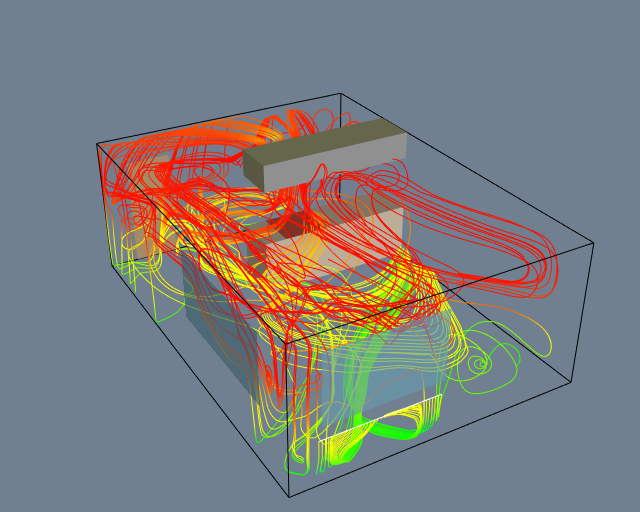 |
| KochSnowflake | Use recursion to represent a Koch snowflake fractal. |  |
| LODProp3D | Level of detail rendering. |  |
| LOx | Streamtubes created by using the computational grid just in front of the post as a source for seeds. |  |
| LOxGrid | Portion of computational grid for the LOx post. | 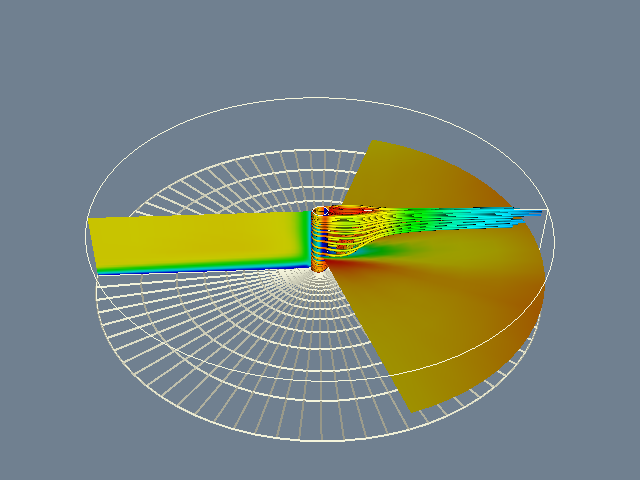 |
| LOxSeeds | Streamlines seeded with spherical cloud of points. Four separate cloud positions are shown. | 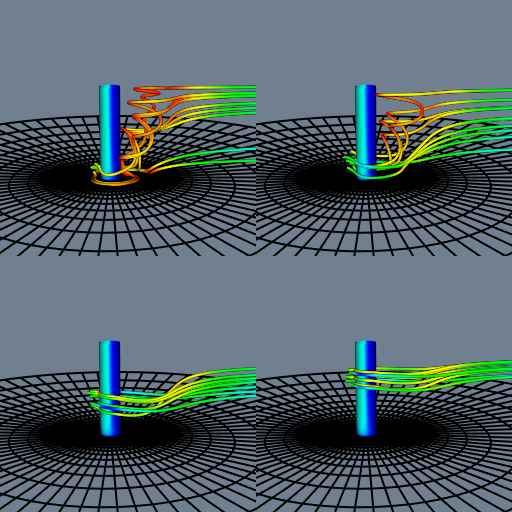 |
| LabelContours | Label Contours. |  |
| LabelPlacementMapper | Display a non-overlapping text label at each point. |  |
| LabeledDataMapper | Display the point ID at each point. |  |
| LabeledMesh | Label Mesh. | 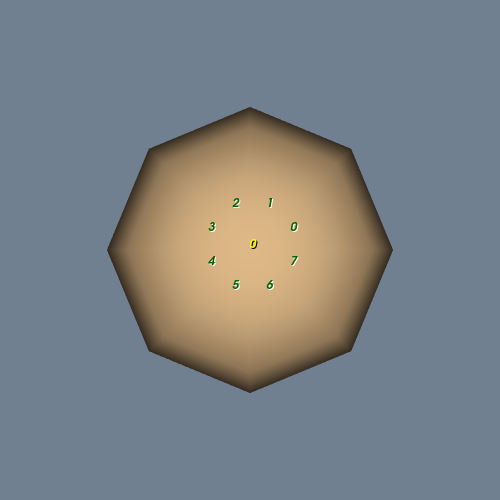 |
| Legend | 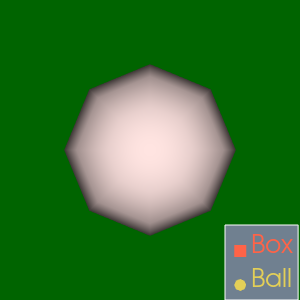 | |
| LegendScaleActor | Display the scale of a scene. |  |
| LineWidth | Change the width/thickness of lines in an actor. |  |
| LoopShrink | A network with a loop. VTK 5.0 does not allow you to execute a looping visualization network; this was possible in previous versions of VTK. | 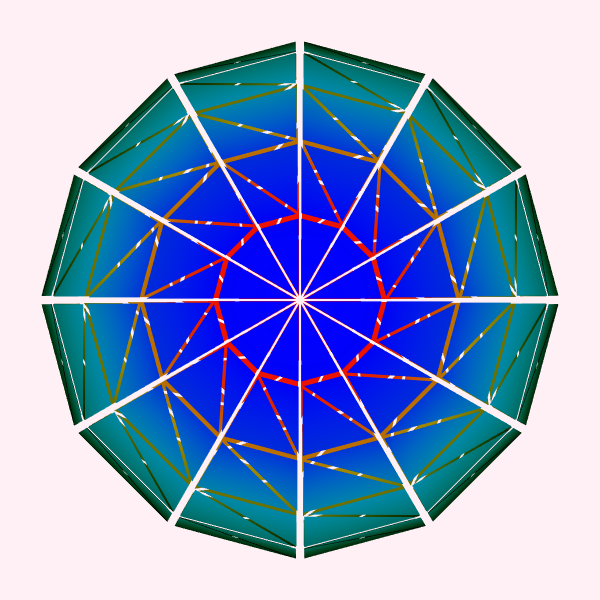 |
| Morph3D | Interpolate between datasets. | 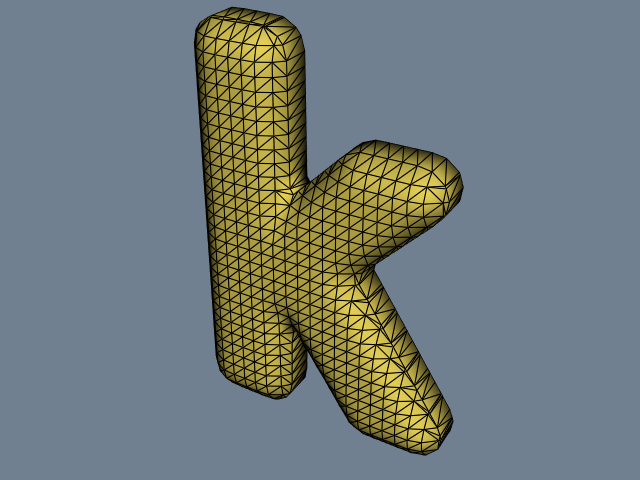 |
| Motor | Texture cut used to reveal internal structure of a motor. Two cut planes are used in combination with transparent texture. | 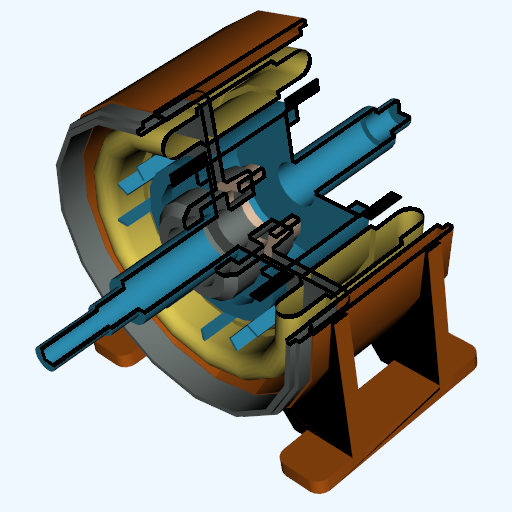 |
| MovableAxes | Movable axes. | 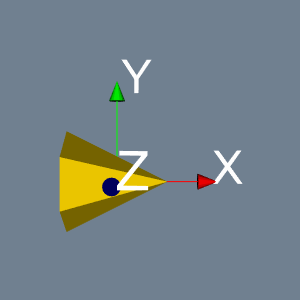 |
| MoveActor | Moving an Actor. |  |
| MoveCamera | Moving the Camera. |  |
| MultipleActors | Multiple Actors. |  |
| NamedColorPatches | Creates a HTML file called VTKNamedColorPatches | |
| NamedColors | Demonstrate the use of the vtkNamedColors class. |  |
| NoShading |  | |
| NormalsDemo | Demo different options to generate normals. |  |
| Office | Using random point seeds to create streamlines. |  |
| OfficeA | Corresponds to Fig 9-47(a) in the VTK textbook. | 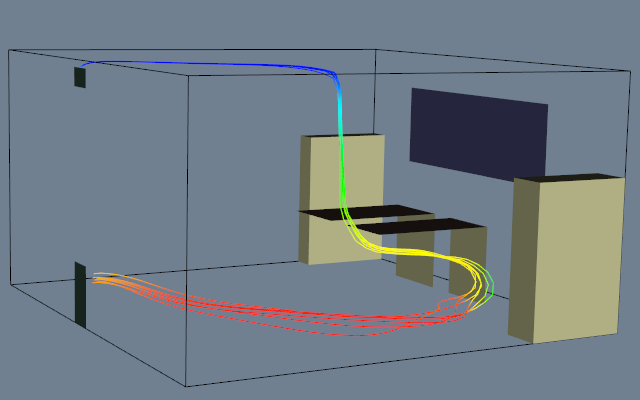 |
| OfficeTube | The stream polygon. Sweeping a polygon to form a tube. |  |
| Opacity | Transparency, transparent. |  |
| OrientedGlyphs | Create oriented glyphs from vector data. |  |
| PineRootConnectivity | Applying the connectivity filter to remove noisy isosurfaces. |  |
| PineRootConnectivityA | The isosurface, with no connectivity filter applied. | 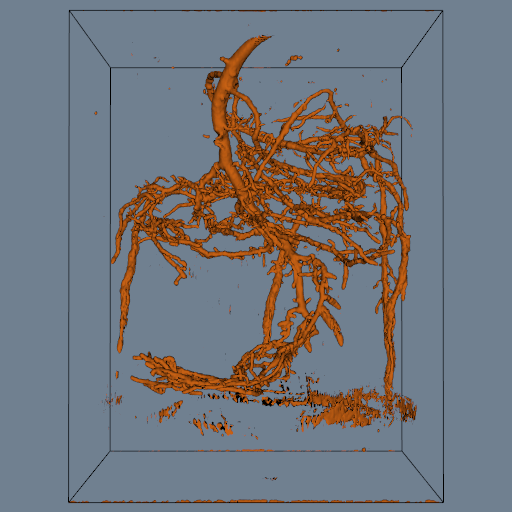 |
| PineRootDecimation | Applying the decimation and connectivity filters to remove noisy isosurfaces and reduce data size. | 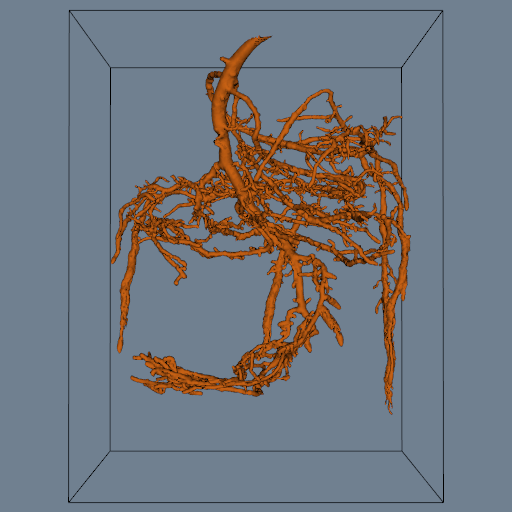 |
| PlateVibration | Demonstrates the motion of a vibrating beam. |  |
| PointDataSubdivision | Demonstrates the effect of applying these filters on various sources. |  |
| PointSize |  | |
| ProbeCombustor | Probing data in a combustor. Probes are regular arrays of 50 by 50 points that are then passed through a contouring filter. | 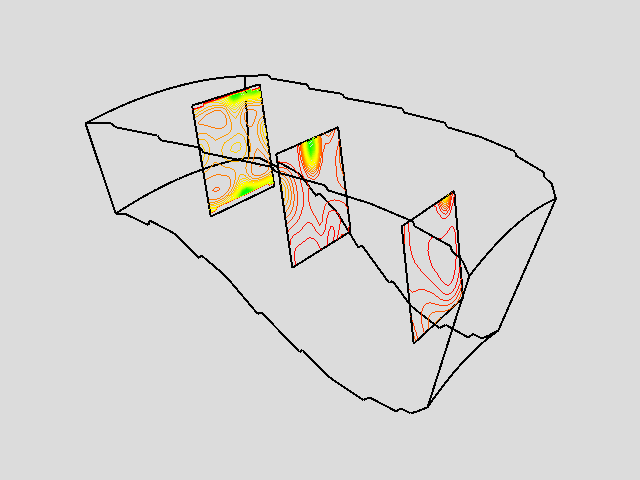 |
| ProgrammableGlyphFilter | Generate a custom glyph at each point. |  |
| ProteinRibbons | Display pdb ribbons. | 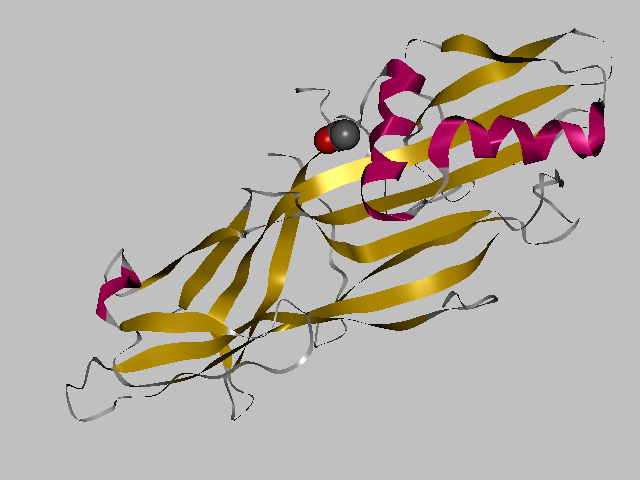 |
| PseudoVolumeRendering | Here we use 100 cut planes, each with an opacity of 0.05. They are then rendered back-to-front to simulate volume rendering. | 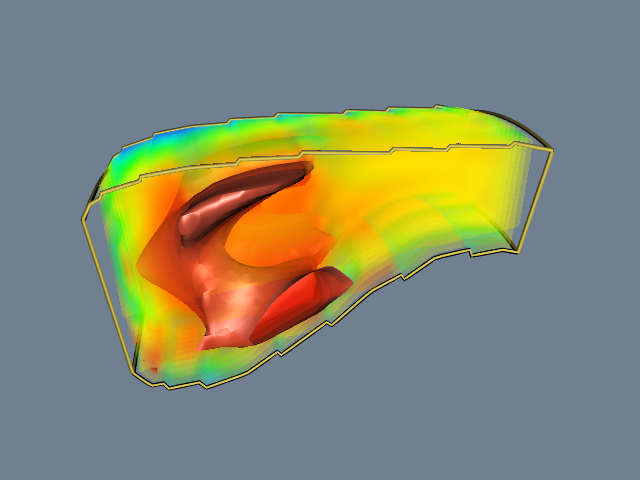 |
| QuadraticSurface | Display a quadratic surface. |  |
| QuadricLODActor | Level of detail adjustment. |  |
| QuadricVisualization | Visualizing a quadric function. |  |
| RandomProbe | Demonstrates how to probe a dataset with random points and select points inside the data set. | 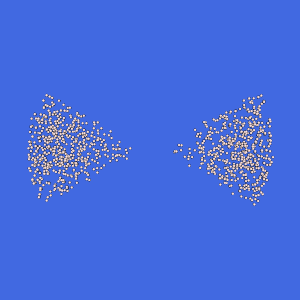 |
| RenderLargeImage | Render a large image, larger than a window. | 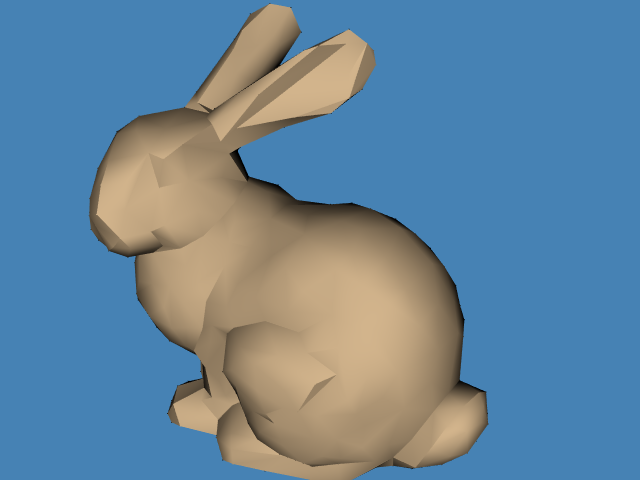 |
| RenderView | A little bit easier rendering. |  |
| ReverseAccess | Demonstrates how to access the source (e.g. vtkSphereSource) of an actor reversely. | |
| RotateActor | Rotate an Actor. |  |
| ScalarBarActor | Display a color bar. | 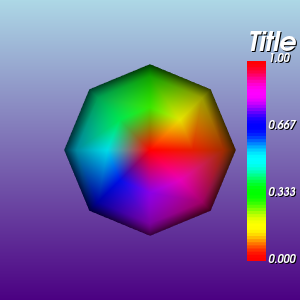 |
| ScalarBarActorColorSeries | Display a color bar with a color series lookup table. |  |
| ScalarVisibility | Switch between coloring the actor and coloring the data. |  |
| ScaleGlyphs | Scale glyphs. |  |
| SceneBounds | Get the bounds of the whole scene. |  |
| SelectWindowRegion | Select a region of a window. |  |
| SingleSplat | Elliptical splatting. (a) Single elliptical splat with eccentricity E=10. Cone shows orientation of vector. |  |
| SpikeFran | Glyphs indicate surface normals on model of human face. Glyph positions are randomly selected. |  |
| SplatFace | Elliptical splatting. (b) Surface reconstructed using elliptical splats into 100^3 volume followed by isosurface extraction. Points regularly subsampled and overlaid on original mesh. |  |
| Stocks | Two views from the stock visualization script. The top shows closing price over time; the bottom shows volume over time. |  |
| StreamLines | Seed streamlines with vectors from a structured grid. |  |
| StreamlinesWithLineWidget | Using the vtkLineWidget to produce streamlines in the combustor dataset. The StartInteractionEvent turns the visibility of the streamlines on; the InteractionEvent causes the streamlines to regenerate themselves. | 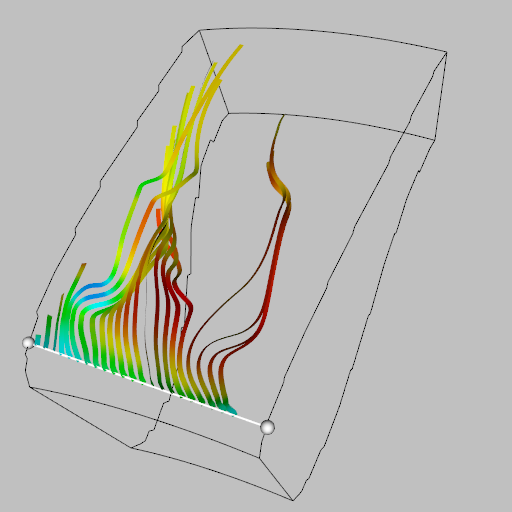 |
| StructuredDataTypes | Demonstration of structured data types. |  |
| TensorAxes | Display the scaled and oriented principal axes of the stress tensor. |  |
| TensorEllipsoids | Display the scaled and oriented principal axes as tensor ellipsoids representing the stress tensor. | 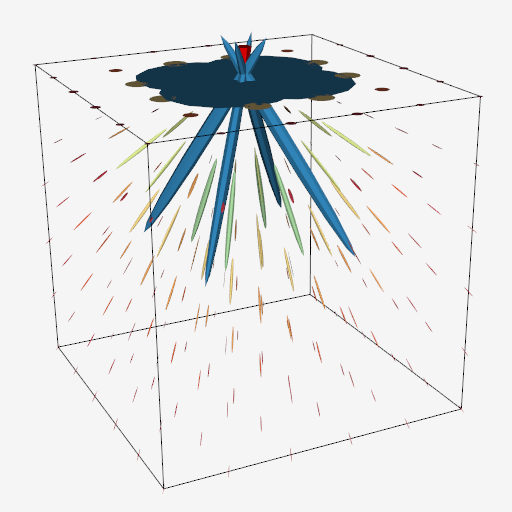 |
| TensorGlyph | Draw a rotated/scaled glyph at each point. |  |
| TextSource | Display text. |  |
| TransformActor | Transform an Actor. | |
| TransformActorCollection | Transform an actor collection. | |
| TubesFromSplines | Create tubes from interpolated points and scalars. |  |
| TubesWithVaryingRadiusAndColors | Create tubes with varying radius and colors. |  |
| VectorField |  | |
| VectorOfActors | Multiple Actors in a Vector. |  |
| VectorText | Display high resolution text. |  |
| VelocityProfile | Warping the geometry of three planes to show flow momentum. | 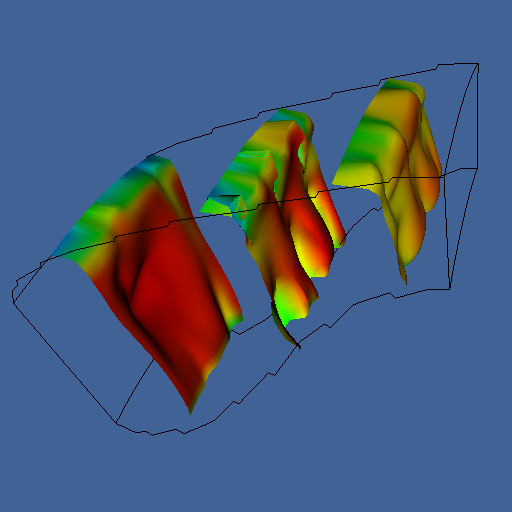 |
| VertexGlyphFilter | Add a vertex to each point. |  |
| Visualize2DPoints | Visualize a 2D Set of Points. |  |
| VisualizeImageData | Visualize the points of an ImageData. |  |
| VisualizeVTP | Visualize a VTP File. |  |
| VoxelsOnBoundary | Extract voxels on the border of an isosurface. |  |
| WarpCombustor | Carpet plots of combustor flow energy in a structured grid. Colors and plane displacement represent energy values. | 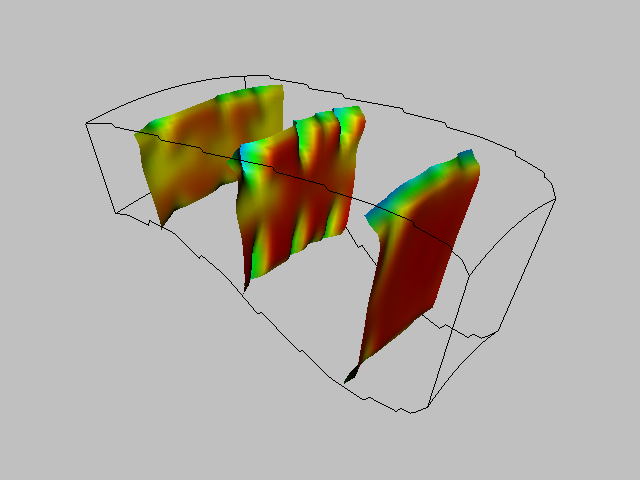 |
| WindowSize | Change the size of a window. |  |
| WindowTitle | Change the title of a window. |  |
| Wireframe |  | |
Volume Rendering
| Example Name | Description | Image |
|---|---|---|
| FixedPointVolumeRayCastMapperCT | Volume render DICOM or Meta volumes with various vtkColorTransferFunction's. | 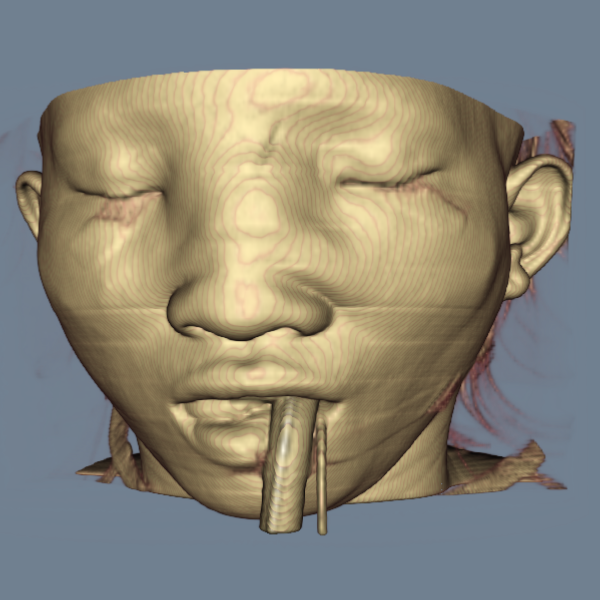 |
| HAVS |  | |
| IntermixedUnstructuredGrid | mix of poly data and unstructured grid volume mapper. |  |
| MinIntensityRendering | Min intensity rendering. |  |
| RayCastIsosurface | Isosufaces produced by volume rendering. | 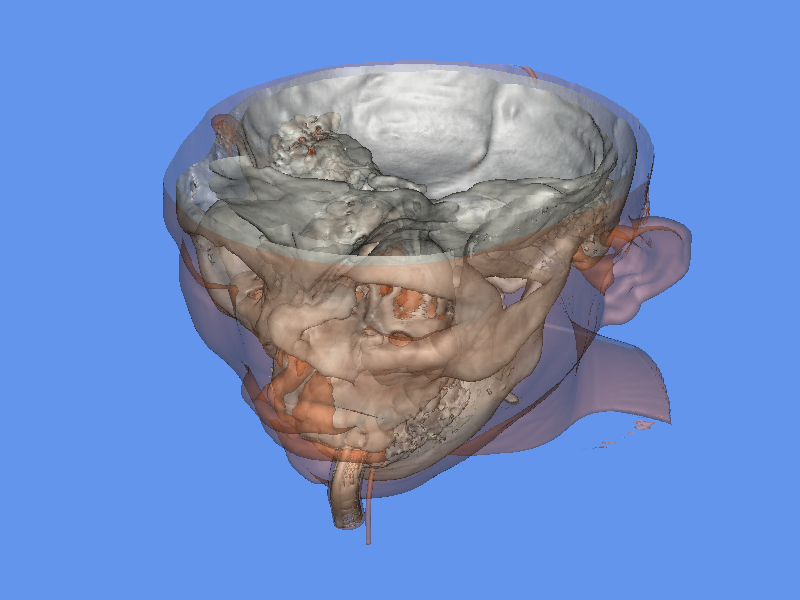 |
| SimpleRayCast | Volume rendering of a high potential iron protein. |  |
| SmartVolumeMapper | Smart volume mapper. |  |
User Interaction
| Example Name | Description | Image |
|---|---|---|
| AreaPicking | Area Picking. |  |
| Assembly | Combine/group actors into an assembly. |  |
| CallBack | Setting up a callback with client data. Two different methods are demonstrated. |  |
| CallData | Pass an observer a value (via CallData). |  |
| CellPicking | Cell Picking. |  |
| ClientData | Give an observer access to an object (via ClientData). |  |
| DoubleClick | Catch a double click. |  |
| EllipticalButton | Create an elliptical button. |  |
| Game | Move a cube into a sphere. |  |
| HighlightPickedActor | Highlight a picked actor by changing its color. |  |
| HighlightSelectedPoints | Highlight Selected Points. |  |
| HighlightSelection | Highlight selection. |  |
| HighlightWithSilhouette | Highlight a picked actor by adding a silhouette. | 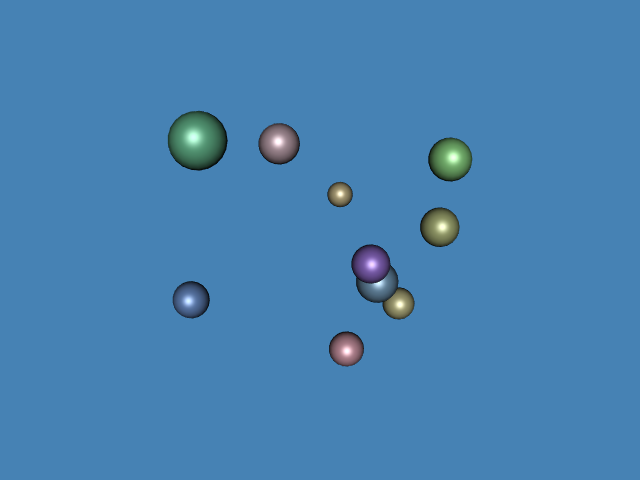 |
| ImageClip | Demonstrates how to interactively select and display a region of an image. |  |
| ImageRegion | Select a region of an image. |  |
| InteractorStyleTerrain | Terrain mode. |  |
| InteractorStyleUser | Create a completely custom interactor style (no default functionality is provided) |  |
| KeypressEvents | Handle keypress events. |  |
| KeypressObserver | This uses a callback function rather than a derived interactor class. Handle keypress events (lightweight). |  |
| MouseEvents | Subclass the interactor style. Handle mouse events. |  |
| MouseEventsObserver | Use an observer. Handle mouse events (light weight). |  |
| MoveAGlyph | Drag a glyph around. |  |
| MoveAVertexUnstructuredGrid | Click and drag a vertex of a vtkUnstructuredGrid. |  |
| ObserverMemberFunction | Set observers to be class member functions. |  |
| PickableOff | Disallow interaction with a specific actor. |  |
| Picking | Get the world coordinate of the mouse click (if you clicked an actor) |  |
| PointPicker | Get the coordinates of the closest point in the data set to the mouse click. |  |
| RubberBand2D |  | |
| RubberBand2DObserver | RubberBand2D Observer. |  |
| RubberBand3D |  | |
| RubberBandPick |  | |
| RubberBandZoom |  | |
| SelectAVertex | Click and drag a vertex of a vtkPolyData. |  |
| SelectAnActor | Select an actor. |  |
| ShiftAndControl | Hold/holding down a key. Check if shift or control is being held. |  |
| StyleSwitch | Choose between multiple interaction modes. |  |
| TrackballActor | Trackball actor mode. | 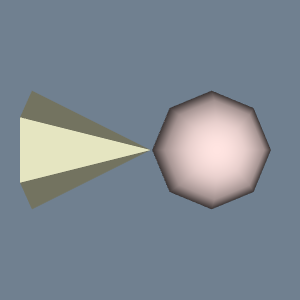 |
| TrackballCamera | Trackball camera mode. |  |
| UserEvent | Simple observer. Create, invoke, and handle a custom event. |  |
| WorldPointPicker | Get world coordinates of mouse click. |  |
Working with Images
| Example Name | Description | Image |
|---|---|---|
| Actor2D | 2D actor and mapper. |  |
| BackgroundImage | Display an image as the background of a scene. |  |
| BorderPixelSize | Set the size of border pixels. | |
| CannyEdgeDetector | Perform Canny edge detection on an image. |  |
| Cast | Cast an image to a different type. |  |
| DotProduct | Compute the pixel-wise dot product of two vector images. |  |
| DrawOnAnImage | Drawing on an image. |  |
| DrawShapes | Drawing shapes in an image. |  |
| ExtractComponents | Extract components of an image. This can be used to get, for example, the red channel of an image. |  |
| FillWindow | Fit imageSetup the camera to fill the window with an image. |  |
| ImageAccumulateGreyscale | Display a grey scale histogram. | 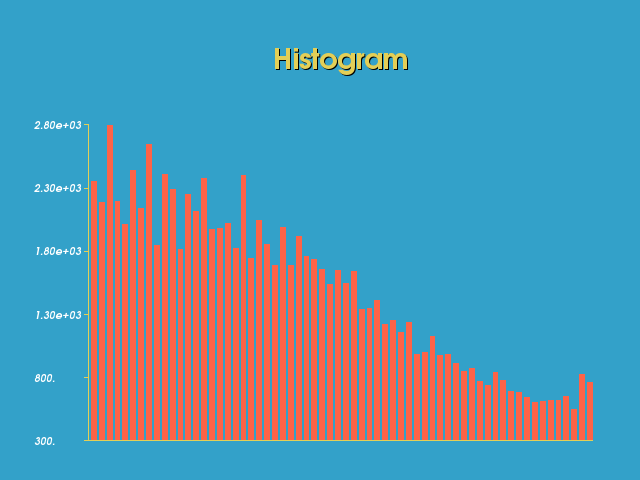 |
| ImageCheckerboard | Visually Compare Two Images. |  |
| ImageCityBlockDistance | Compute the Manhattan distance from every point to every black point in a binary image. | 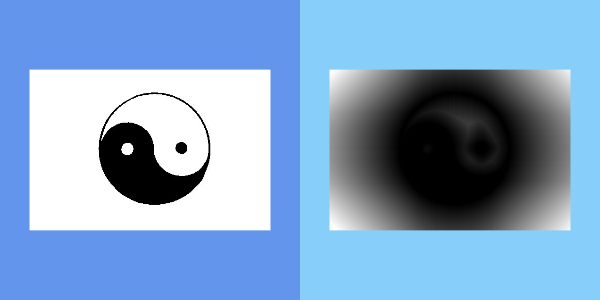 |
| ImageDilateErode3D | Dilate or erode an image. |  |
| ImageExport | Export an image to a C array. | |
| ImageGridSource | Create a image of a grid. | 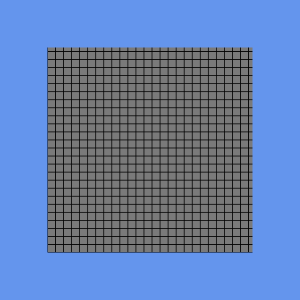 |
| ImageHistogram | Compute the histogram of an image. | 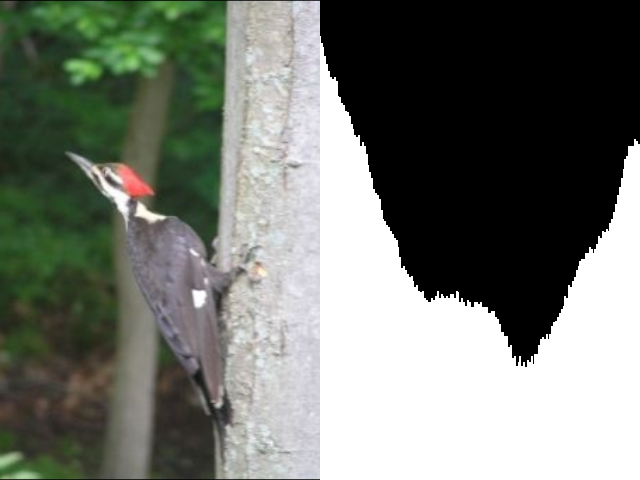 |
| ImageHybridMedian2D | Median filter an image. | 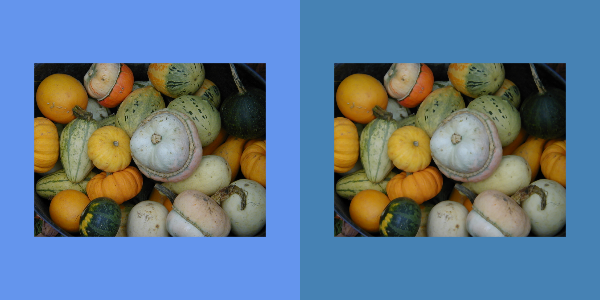 |
| ImageIdealHighPass | High pass filter an image. |  |
| ImageImport | Import an image from a C array. |  |
| ImageIslandRemoval2D | Remove small patches from an image. | 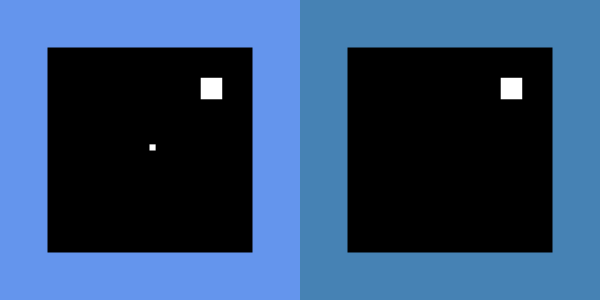 |
| ImageMagnify | Supersample and stretch an image. |  |
| ImageMandelbrotSource | Create a Mandelbrot image. |  |
| ImageMapper | Display an image in 2D. |  |
| ImageMask | Mask a region of an image. | 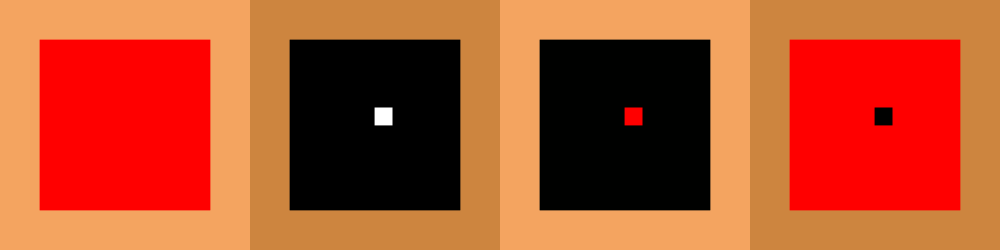 |
| ImageMathematics | Perform mathematical operations on an image. |  |
| ImageMedian3D | Median filter a 3d or 2d image. |  |
| ImageMirrorPad | Pad the edges of an extended image by mirror existing pixels. |  |
| ImageNonMaximumSuppression | Find peaks in an image using non maximum suppression. |  |
| ImageOpenClose3D | Open or close (morphologically) an image. |  |
| ImageOrder | Determine the display order of a stack of images. |  |
| ImageOrientation | Orientation of the view of an image. |  |
| ImageRFFT | Inverse FFT. |  |
| ImageRange3D | Replace every pixel with the range of its neighbors according to a kernel. |  |
| ImageRotate | Rotate a 2D image. This is even more powerful than vtkImageSliceMapper. It can also do oblique slices. |  |
| ImageSeparableConvolution | Convolve a separable kernel with an image. |  |
| ImageShiftScale | Shift and scale an image. |  |
| ImageSinusoidSource | Create a sinusoidal image. |  |
| ImageSlice | Visualize and interact with an image. This is even more powerful than vtkImageSliceMapper. It can also do oblique slices. |  |
| ImageSliceMapper | Visualize and interact with an image. This is the new way to do this. It is much more powerful. |  |
| ImageStack | Display layers of images. |  |
| ImageStencil | Copy one image into another image. |  |
| ImageText | Draw text in an image. |  |
| ImageThreshold | Threshold an image. |  |
| ImageToPolyDataFilter | Convert a vtkImageData to a vtkPolyData. |  |
| ImageToStructuredPoints | Convert a vtkImageData to a vtkStructuredPoints. |  |
| ImageTransparency | Set transparency of image pixels. | |
| InteractWithImage | Visualize and interact with an image. |  |
| Interpolation | Set the interpolation type for the display of an image. If pixels look blurry instead of sharp when zoomed in, change this. |  |
| MarkKeypoints | Mark keypoints in an image. |  |
| NegativeIndices | A very powerful feature of vtkImageData is that you can use negative indices. | |
| PickPixel | Picking a pixel. | |
| PickPixel2 | Picking a pixel 2 - modified version for exact pixel values. | |
| RTAnalyticSource | An image source that can be used for regression testing |  |
| StaticImage | This will display the image, but not allow you to interact with it. | 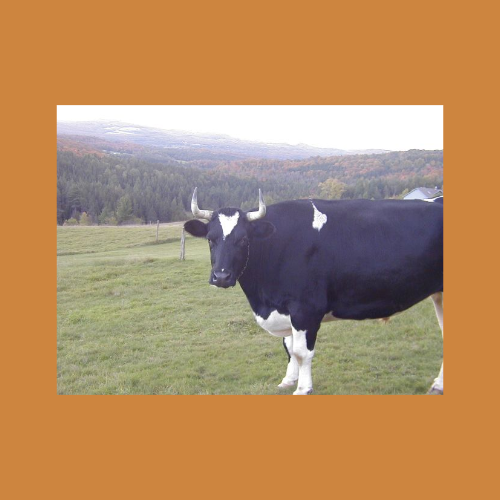 |
| Transparency | Make part of an image transparent. | |
Image Processing
| Example Name | Description | Image |
|---|---|---|
| Attenuation | This MRI image illustrates attenuation that can occur due to sensor position. The artifact is removed by dividing by the attenuation profile determined manually. |  |
| CenterAnImage | Center an image. |  |
| Colored2DImageFusion | Blending 2D images with different color maps. |  |
| CombineImages | Combine two images. |  |
| CombiningRGBChannels | Combine layers into an RGB image. |  |
| EnhanceEdges | High-pass filters can extract and enhance edges in an image. Subtraction of the Laplacian (middle) from the original image (left) results in edge enhancement or a sharpening operation (right). | 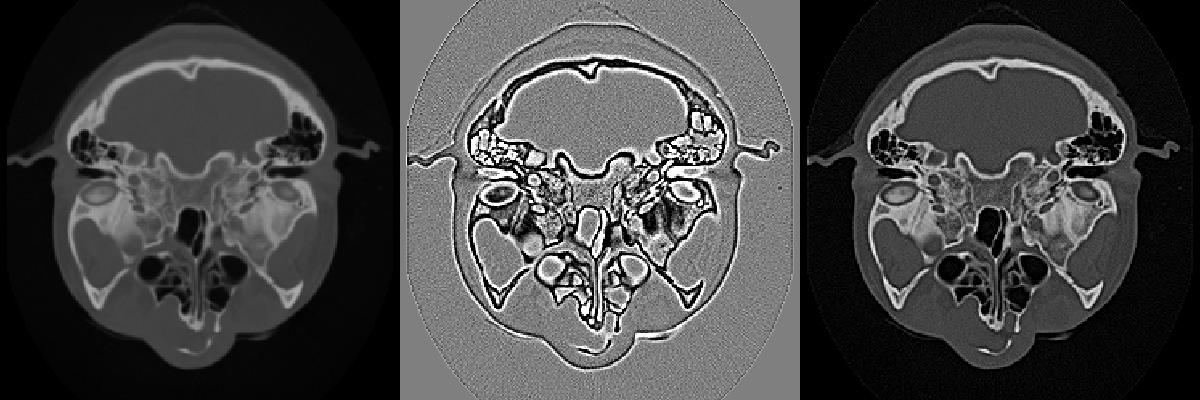 |
| Flip | Flip an image. |  |
| GaussianSmooth | Low-pass filters can be implemented as convolution with a Gaussian kernel. |  |
| Gradient | Compute the gradient vector at every pixel. |  |
| HybridMedianComparison | Comparison of median and hybrid-median filters. The hybrid filter preserves corners and thin lines, better than the median filter. |  |
| IdealHighPass | This figure shows two high-pass filters in the frequency domain. The Butterworth high-pass filter has a gradual attenuation that avoids ringing produced by the ideal high-pass filter with an abrupt transition. |  |
| ImageAccumulate | Histogram | |
| ImageAnisotropicDiffusion2D | Anisotropic diffusion (2D). |  |
| ImageContinuousDilate3D | Dilate an image. | 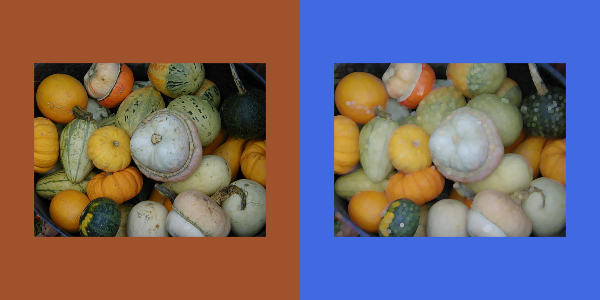 |
| ImageContinuousErode3D | Erode an image. |  |
| ImageConvolve | Convolve an image with a kernel. | 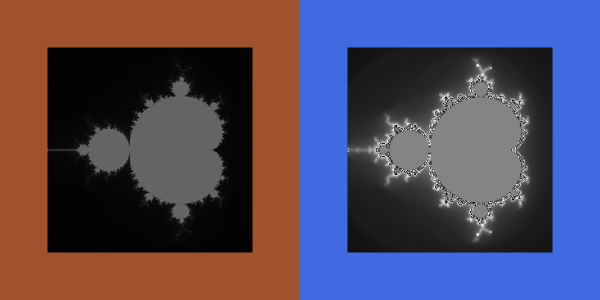 |
| ImageCorrelation | Correlate two images. |  |
| ImageDifference | Compute the difference image of two images. |  |
| ImageDivergence | Divergence of a vector field. | 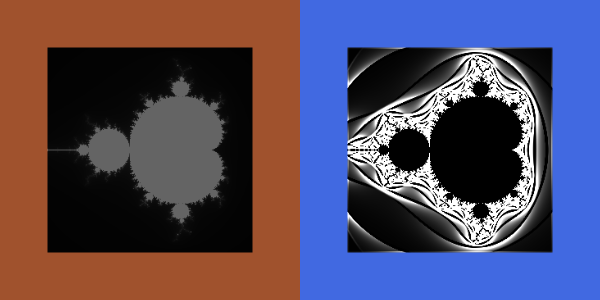 |
| ImageEllipsoidSource | Create an image of an ellipsoid. |  |
| ImageFFT | Compute the FFT of an image. |  |
| ImageGaussianSmooth | Smooth an image. |  |
| ImageGradient | Create an imaging pipeline to visualize gradient information. | 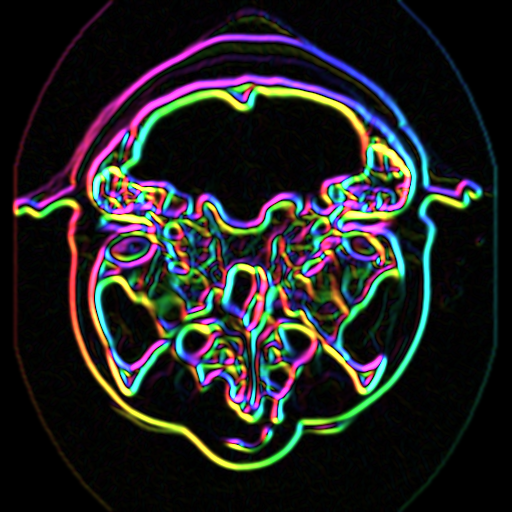 |
| ImageGradientMagnitude | Compute the magnitude of the gradient at each pixel of an image. |  |
| ImageLaplacian | Compute the Laplacian of an image. |  |
| ImageLuminance | Convert RGB image to greyscale (luminance). | 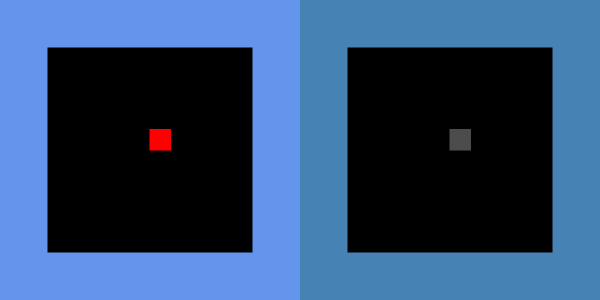 |
| ImageMagnitude | grayscaleConvert RGB image to grey scale. | 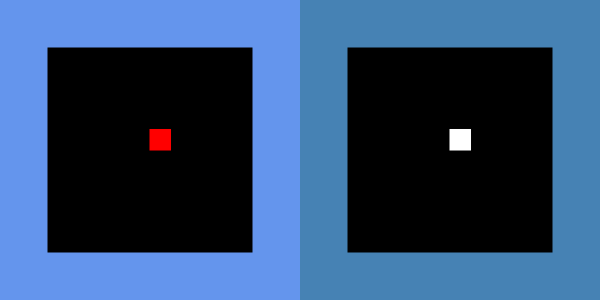 |
| ImageMapToColors | Use a lookup table to map scalar (gray scale) values to colorsConvert grey scale image to RGB. |  |
| ImageNoiseSource | Create an image of noise. |  |
| ImagePermute | Switch axes of an image. |  |
| ImageShrink3D | Resample an image. |  |
| ImageSobel2D | Sobel edge detection 2D. |  |
| ImageValueRange | Get the range of image pixel values (min/max). | |
| ImageVariance3D | Construct a new image consisting of the variance of the input image at each pixel. |  |
| ImageWarp | Combine the imaging and visualization pipelines to deform an image in the z-direction. The vtkMergeFilter is used to combine the warped surface with the original color data. | 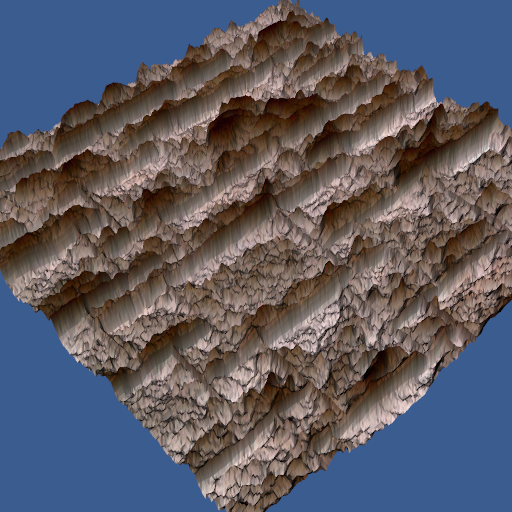 |
| IsoSubsample | This figure demonstrates aliasing that occurs when a high-frequency signal is subsampled. High frequencies appear as low frequency artifacts. The left image is an isosurface of a skull after subsampling. The right image used a low-pass filter before subsampling to reduce aliasing. | 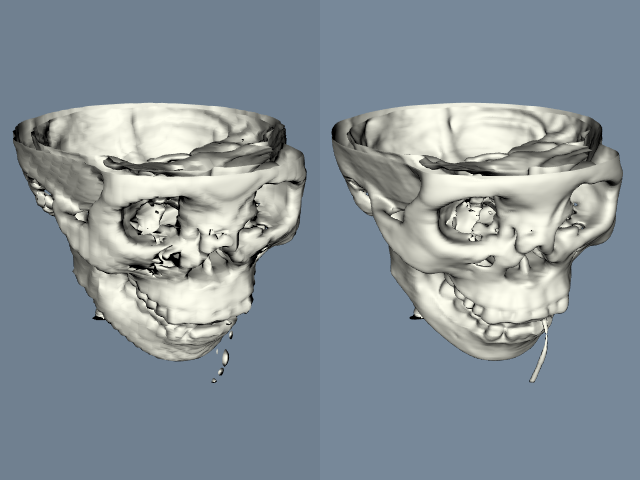 |
| MedianComparison | Comparison of Gaussian and Median smoothing for reducing low-probability high-amplitude noise. |  |
| MorphologyComparison | This figure demonstrates various binary filters that can alter the shape of segmented regions. | 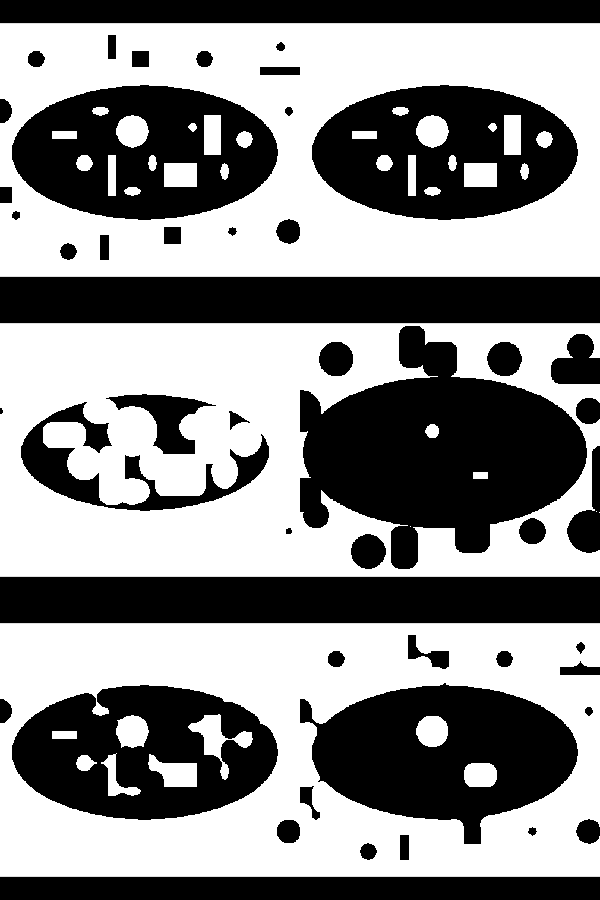 |
| Pad | Convolution in frequency space treats the image as a periodic function. A large kernel can pick up features from both sides of the image. The lower-left image has been padded with zeros to eliminate wraparound during convolution. On the right, mirror padding has been used to remove artificial edges introduced by borders. |  |
| RGBToHSI | Convert RGB to HSI. |  |
| RGBToHSV | Convert RGB to HSV. |  |
| RGBToYIQ | Convert RGB to YIQ. |  |
| RescaleAnImage | Rescale an image | |
| ResizeImage | Resize an image using a sinc interpolator. |  |
| ResizeImageDemo | Demonstrate allsinc interpolators to resize an image. |  |
| VTKSpectrum | The discrete Fourier transform changes an image from the spatial domain into the frequency domain, where each pixel represents a sinusoidal function. This figure shows an image and its power spectrum displayed using a logarithmic transfer function. |  |
Widgets
| Example Name | Description | Image |
|---|---|---|
| AffineWidget | Apply an affine transformation interactively. |  |
| AngleWidget |  | |
| AngleWidget2D | vtkAngleWidget + vtkAngleRepresentation2D. |  |
| BalloonWidget |  | |
| BiDimensionalWidget | When would you use this? |  |
| BorderWidget | 2D selection, 2D box. | 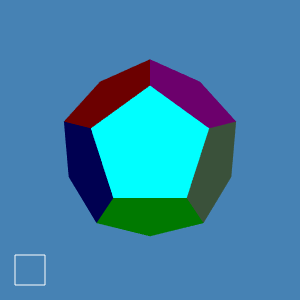 |
| BoxWidget |  | |
| BoxWidget2 | 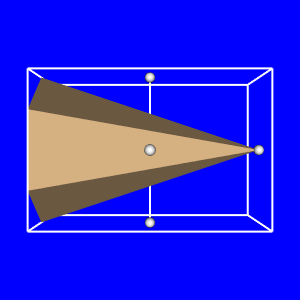 | |
| CameraOrientationWidget | Demonstrates a 3D camera orientation widget. |  |
| CaptionWidget |  | |
| CheckerboardWidget | Compare two images using a checkerboard. |  |
| CompassWidget | Draws an interactive compass. |  |
| ContourWidget | Create a contour from a set of points and dynamically change the contour using the points as control points. |  |
| Cursor2D |  | |
| DistanceWidget |  | |
| HoverWidget | How to detect a hover? |  |
| ImagePlaneWidget |  | |
| ImageTracerWidget | Scribble on an image. |  |
| ImageTracerWidgetInsideContour | Highlight pixels inside a non-regular region scribbled on an image. |  |
| ImageTracerWidgetNonPlanar | Draw on a non-planar surface. |  |
| ImplicitPlaneWidget2 | Clip polydata with an implicit plane. |  |
| LineWidget2 |  | |
| LogoWidget | Logo widget. |  |
| OrientationMarkerWidget | Draws two cubes. One of them can be clicked to be rotated, and will rotate the second one. The second one has annotations on it, and can also be moved. |  |
| OrientationMarkerWidget1 | Display a polydata as an orientation icon. |  |
| PlaneWidget | Interact with a plane. |  |
| PolygonalSurfacePointPlacer | Used in conjunction with vtkContourWidget to draw curves on a surface. |  |
| RectilinearWipeWidget | Compare two images. |  |
| ScalarBarWidget | The ScalarBarWidget displays a scalar bar that is movable and changes orientation automatically when close to the borders of the image. It needs a ScalarBarActor |  |
| SeedWidget | Seed widget. |  |
| SeedWidgetImage | How to start the interaction? |  |
| SeedWidgetWithCustomCallback | How to place points in a scene using a custom callback. |  |
| Slider | 3D Slider. |  |
| Slider2D | 2D Slider. | 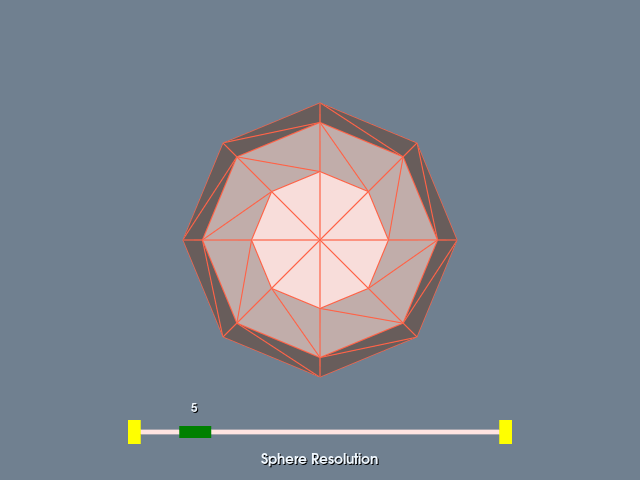 |
| SphereWidget | Sphere widget. |  |
| SphereWidget2 |  | |
| SphereWidgetEvents | Sphere widget events. |  |
| SplineWidget |  | |
| TextWidget | Draw movable text. |  |
| TexturedButtonWidget | Create a textured 2D button. |  |
Plotting
| Example Name | Description | Image |
|---|---|---|
| AreaPlot | Plot area between two curves. |  |
| BarChart | Bar chart. |  |
| BoxChart | Box plot. |  |
| ChartMatrix | Create a marix of plots. |  |
| ChartsOn3DScene | Draw a chart in a 3D scene. |  |
| CompareRandomGeneratorsCxx | Compare STL random number generators. | 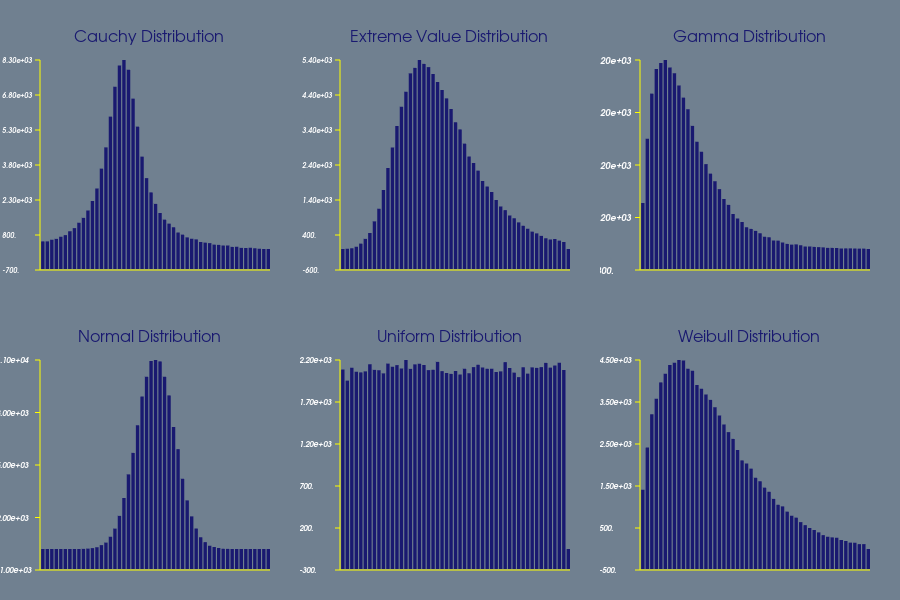 |
| Diagram | Draw a custom diagram. | 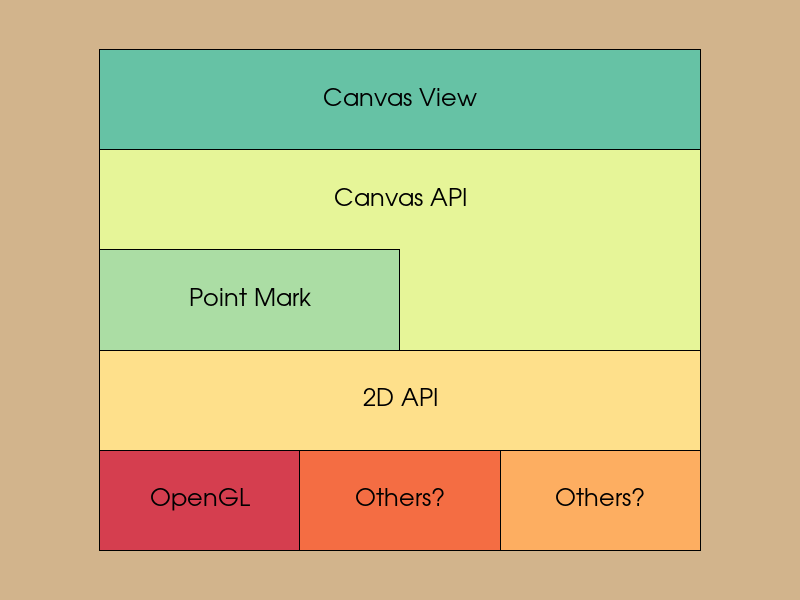 |
| FunctionalBagPlot | Functional Bag Plot. |  |
| Histogram2D | 2D Histogram of a vtkImageData. | 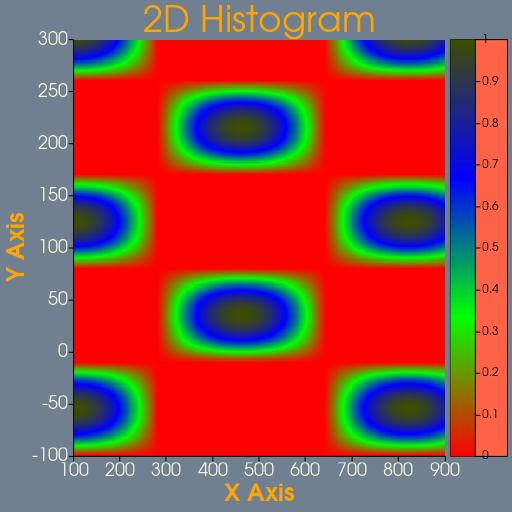 |
| HistogramBarChart | Histogram using bar chart. |  |
| LinePlot | Line plot. |  |
| LinePlot3D | Line plot of 3d data. |  |
| MultiplePlots | Display multiple plots by using viewports in a single render window. |  |
| ParallelCoordinates | Parallel coordinates. |  |
| PieChart | Pie chart. |  |
| PieChartActor | Pie chart. |  |
| ScatterPlot | Scatter plot. | 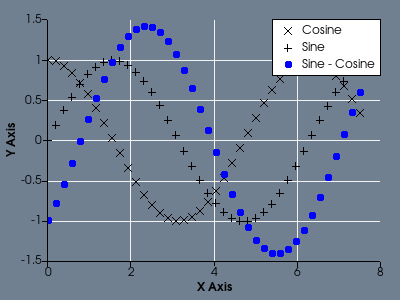 |
| SpiderPlot | Spider plot. |  |
| StackedBar | Stacked bar. |  |
| StackedPlot | Stacked plot. | 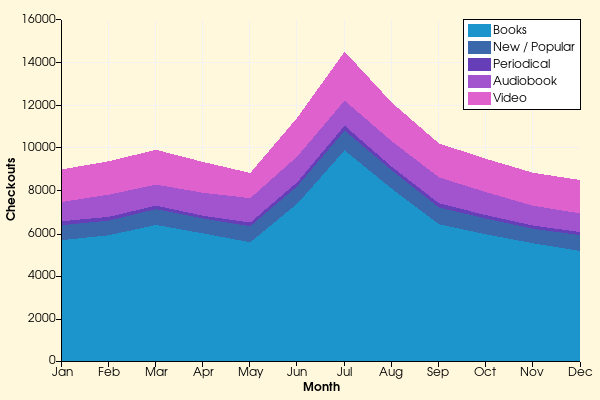 |
| SurfacePlot | SurfacePlot. |  |
Animation
| Example Name | Description | Image |
|---|---|---|
| AnimateActors | Animate actors. |  |
| Animation | Move a sphere across a scene. | 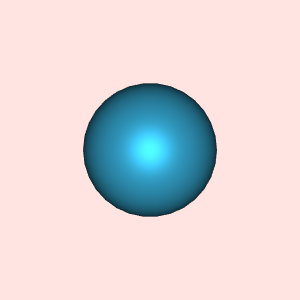 |
| AnimationScene | Animation (the right way). Zoom in on a sphere. |  |
| DataAnimation | Data Animation. Update points in a dataset every specified interval. |  |
| DataAnimationSubclass | Update points in a dataset every specified interval (using a vtkCommand subclass instead of a callback function. |  |
| RotatingSphere | A rotating sphere. |  |
InfoVis
| Example Name | Description | Image |
|---|---|---|
| ParallelCoordinatesView | Parallel coordinates. |  |
| TreeMapView | Tree map. |  |
| WordCloud | Create a word cloud. |  |
Qt
Click here for a tutorial on how to setup Qt.
| Example Name | Description | Image |
|---|---|---|
| BarChartQt | Bar chart. |  |
| BorderWidgetQt | 2D selection, 2D box. | 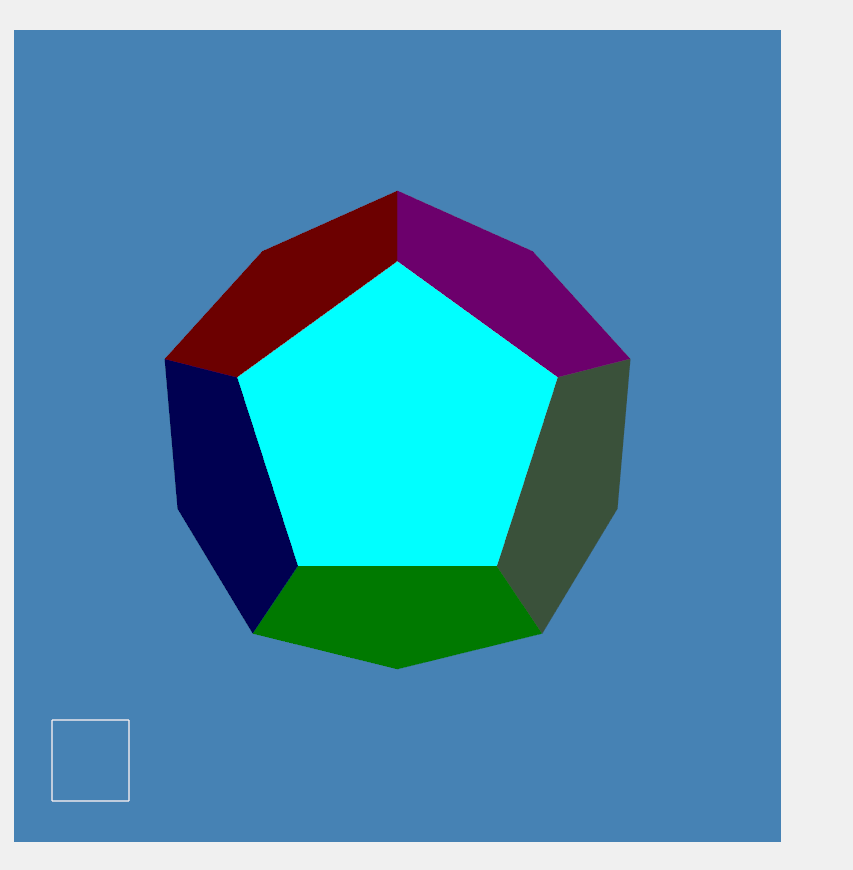 |
| EventQtSlotConnect | Connect a VTK event to a Qt slot. |  |
| ImageDataToQImage | Convert a vtkImageData to a QImage. | |
| MinimalQtVTKApp | A minimal Qt/VTK application. |  |
| QImageToImageSource | Convert a QImage to a vtkImageData. | |
| RenderWindowNoUiFile | This is a very basic example that shows how to create a Qt window. Typically, one would want to design a form in the QtDesigner (this is shown in RenderWindowUISingleInheritance). |  |
| RenderWindowUISingleInheritance | Using a QVTKOpenGLWidget with the Qt Single Inheritance model. |  |
| ShareCameraQt | Share the camera between QVTKOpenGLWidgets. | 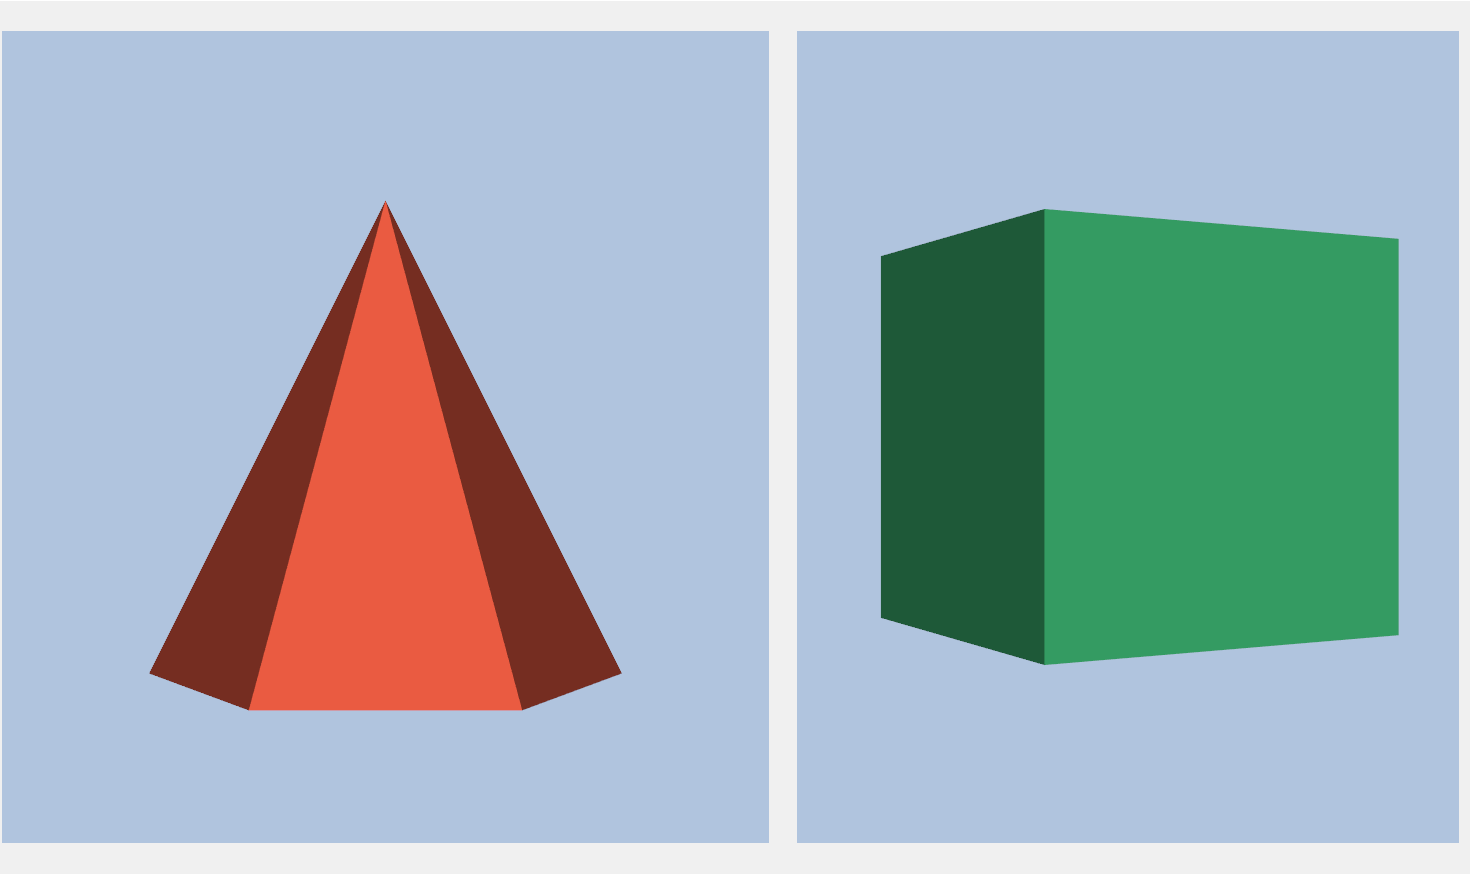 |
| ShowEvent | Use QMainWindow::showEvent event to do things that you might want to do in the constructor | |
| SideBySideRenderWindowsQt | Side by side render windows. |  |
Matlab
You must turn on VTK_USE_MATLAB_MEX to use these.
| Example Name | Description | Image |
|---|---|---|
| MatlabEngineFilter |
Databases
SQL
If you have any trouble or errors with the following examples, please troubleshoot using these instructions.
| Example Name | Description | Image |
|---|---|---|
| ConnectAndRead | Connect to and read a MySQL database. | |
| CreateDatabase | Create a MySQL database. | |
| WriteToDatabase | Write to a MySQL database. |
RenderMan
RenderMan is a high quality rendering system created by Pixar. VTK can export RenderMan RIB files for rendering by prman. In the spring of 2015, Pixar released a non-commercial version of its RenderMan products.
| Example Name | Description | Image |
|---|---|---|
| PolyDataRIB | Apply a RenderMan Shader to a PolyData. | 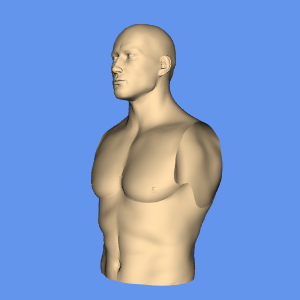 |