XYPlot
vtk-examples/Cxx/Annotation/XYPlot
Description
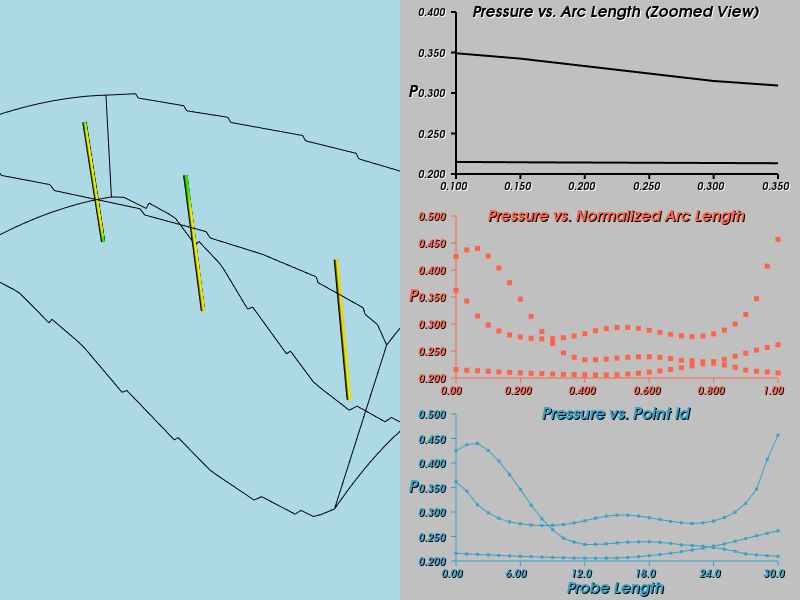
This example demonstrates the use of vtkXYPlotActor to display three probe lines using three different techniques. In this example, we are loading data using the vtkPLOT3DReader. We are using the vtkProbeFilter to extract the underlying point data along three probe lines.
Note
The image was generated with this volume data: src/Testing/Data/combxyz.bin and src/Testing/Data/combq.bin?raw=true.
Question
If you have a question about this example, please use the VTK Discourse Forum
Code
XYPlot.cxx
// This example demonstrates the use of vtkXYPlotActor to display three
// probe lines using three different techniques.  In this example, we
// are loading data using the vtkPLOT3DReader.  We are using the
// vtkProbeFilter to extract the underlying point data along three
// probe lines.

#include <vtkActor.h>
#include <vtkAppendPolyData.h>
#include <vtkCamera.h>
#include <vtkLineSource.h>
#include <vtkMultiBlockDataSet.h>
#include <vtkMultiBlockPLOT3DReader.h>
#include <vtkNamedColors.h>
#include <vtkNew.h>
#include <vtkPolyDataMapper.h>
#include <vtkProbeFilter.h>
#include <vtkProperty.h>
#include <vtkProperty2D.h>
#include <vtkRenderWindow.h>
#include <vtkRenderWindowInteractor.h>
#include <vtkRenderer.h>
#include <vtkStructuredGrid.h>
#include <vtkStructuredGridOutlineFilter.h>
#include <vtkTextProperty.h>
#include <vtkTransform.h>
#include <vtkTransformPolyDataFilter.h>
#include <vtkTubeFilter.h>
#include <vtkXYPlotActor.h>

int main(int argc, char* argv[])
{
  if (argc < 3)
  {
    std::cout << "Usage: " << argv[0] << " combxyz.bin combq.bin" << std::endl;
    return EXIT_FAILURE;
  }

  // Create a PLOT3D reader and load the data.
  vtkNew<vtkMultiBlockPLOT3DReader> pl3d;
  pl3d->SetXYZFileName(argv[1]);
  pl3d->SetQFileName(argv[2]);
  pl3d->SetScalarFunctionNumber(100);
  pl3d->SetVectorFunctionNumber(202);
  pl3d->Update();

  auto pl3d_output =
      dynamic_cast<vtkStructuredGrid*>(pl3d->GetOutput()->GetBlock(0));

  // Create three line sources to use for the probe lines.
  vtkNew<vtkLineSource> line;
  line->SetResolution(30);

  // Move the line into place and create the probe filter. For
  // vtkProbeFilter, the probe line is the input, and the underlying data
  // set is the source.
  vtkNew<vtkTransform> transL1;
  transL1->Translate(3.7, 0.0, 28.37);
  transL1->Scale(5, 5, 5);
  transL1->RotateY(90);

  vtkNew<vtkTransformPolyDataFilter> tf;
  tf->SetInputConnection(line->GetOutputPort());
  tf->SetTransform(transL1);

  vtkNew<vtkProbeFilter> probe;
  probe->SetInputConnection(tf->GetOutputPort());
  probe->SetSourceData(pl3d_output);

  // Move the line again and create another probe filter.
  vtkNew<vtkTransform> transL2;
  transL2->Translate(9.2, 0.0, 31.20);
  transL2->Scale(5, 5, 5);
  transL2->RotateY(90);

  vtkNew<vtkTransformPolyDataFilter> tf2;
  tf2->SetInputConnection(line->GetOutputPort());
  tf2->SetTransform(transL2);
  vtkNew<vtkProbeFilter> probe2;
  probe2->SetInputConnection(tf2->GetOutputPort());
  probe2->SetSourceData(pl3d_output);

  // Move the line again and create a third probe filter.
  vtkNew<vtkTransform> transL3;
  transL3->Translate(13.27, 0.0, 33.40);
  transL3->Scale(4.5, 4.5, 4.5);
  transL3->RotateY(90);
  vtkNew<vtkTransformPolyDataFilter> tf3;
  tf3->SetInputConnection(line->GetOutputPort());
  tf3->SetTransform(transL3);
  vtkNew<vtkProbeFilter> probe3;
  probe3->SetInputConnection(tf3->GetOutputPort());
  probe3->SetSourceData(pl3d_output);

  // Create a vtkAppendPolyData to merge the output of the three probe
  // filters into one data set.
  vtkNew<vtkAppendPolyData> appendF;
  appendF->AddInputConnection(probe->GetOutputPort());
  appendF->AddInputConnection(probe2->GetOutputPort());
  appendF->AddInputConnection(probe3->GetOutputPort());

  // Create a tube filter to represent the lines as tubes.  Set up the
  // associated mapper and actor.
  vtkNew<vtkTubeFilter> tuber;
  tuber->SetInputConnection(appendF->GetOutputPort());
  tuber->SetRadius(0.1);
  vtkNew<vtkPolyDataMapper> lineMapper;
  lineMapper->SetInputConnection(tuber->GetOutputPort());
  vtkNew<vtkActor> lineActor;
  lineActor->SetMapper(lineMapper);

  // Create an xy-plot using the output of the 3 probe filters as input.
  // The x-values we are plotting are arc length.
  vtkNew<vtkNamedColors> colors;

  vtkNew<vtkXYPlotActor> xyplot;
  xyplot->AddDataSetInputConnection(probe->GetOutputPort());
  xyplot->AddDataSetInputConnection(probe2->GetOutputPort());
  xyplot->AddDataSetInputConnection(probe3->GetOutputPort());
  xyplot->GetPositionCoordinate()->SetValue(0.0, 0.67, 0);
  xyplot->GetPosition2Coordinate()->SetValue(1.0, 0.33,
                                             0); // relative to Position;
  xyplot->SetXValuesToArcLength();
  xyplot->SetNumberOfXLabels(6);
  xyplot->SetTitle("Pressure vs. Arc Length (Zoomed View)");
  xyplot->SetXTitle("");
  xyplot->SetYTitle("P");
  xyplot->SetXRange(.1, .35);
  xyplot->SetYRange(.2, .4);
  xyplot->GetProperty()->SetColor(colors->GetColor3d("Black").GetData());
  xyplot->GetProperty()->SetLineWidth(2);
  // Set text prop color
  // Assign same object to all text props
  vtkTextProperty* tprop = xyplot->GetTitleTextProperty();
  tprop->SetColor(xyplot->GetProperty()->GetColor());
  xyplot->SetAxisTitleTextProperty(tprop);
  xyplot->SetAxisLabelTextProperty(tprop);

  // Create an xy-plot using the output of the 3 probe filters as input.
  // The x-values we are plotting are normalized arc length.
  vtkNew<vtkXYPlotActor> xyplot2;
  xyplot2->AddDataSetInputConnection(probe->GetOutputPort());
  xyplot2->AddDataSetInputConnection(probe2->GetOutputPort());
  xyplot2->AddDataSetInputConnection(probe3->GetOutputPort());
  xyplot2->GetPositionCoordinate()->SetValue(0.00, 0.33, 0);
  xyplot2->GetPosition2Coordinate()->SetValue(1.0, 0.33,
                                              0); // relative to Position;
  xyplot2->SetXValuesToNormalizedArcLength();
  xyplot2->SetNumberOfXLabels(6);
  xyplot2->SetTitle("Pressure vs. Normalized Arc Length");
  xyplot2->SetXTitle("");
  xyplot2->SetYTitle("P");
  xyplot2->PlotPointsOn();
  xyplot2->PlotLinesOff();
  xyplot2->GetProperty()->SetColor(colors->GetColor3d("Tomato").GetData());
  xyplot2->GetProperty()->SetPointSize(5);
  // Set text prop color
  // Assign same object to all text props
  tprop = xyplot2->GetTitleTextProperty();
  tprop->SetColor(xyplot2->GetProperty()->GetColor());
  xyplot2->SetAxisTitleTextProperty(tprop);
  xyplot2->SetAxisLabelTextProperty(tprop);

  // Create an xy-plot using the output of the 3 probe filters as input.
  // The x-values we are plotting are the underlying point data values.
  vtkNew<vtkXYPlotActor> xyplot3;
  xyplot3->AddDataSetInputConnection(probe->GetOutputPort());
  xyplot3->AddDataSetInputConnection(probe2->GetOutputPort());
  xyplot3->AddDataSetInputConnection(probe3->GetOutputPort());
  xyplot3->GetPositionCoordinate()->SetValue(0.0, 0.0, 0);
  xyplot3->GetPosition2Coordinate()->SetValue(1.0, 0.33,
                                              0); // relative to Position;
  xyplot3->SetXValuesToIndex();
  xyplot3->SetNumberOfXLabels(6);
  xyplot3->SetTitle("Pressure vs. Point Id");
  xyplot3->SetXTitle("Probe Length");
  xyplot3->SetYTitle("P");
  xyplot3->PlotPointsOn();
  xyplot3->GetProperty()->SetColor(colors->GetColor3d("Peacock").GetData());
  xyplot3->GetProperty()->SetPointSize(3);
  // Set text prop color
  // Assign same object to all text props
  tprop = xyplot3->GetTitleTextProperty();
  tprop->SetColor(xyplot3->GetProperty()->GetColor());
  xyplot3->SetAxisTitleTextProperty(tprop);
  xyplot3->SetAxisLabelTextProperty(tprop);

  // Draw an outline of the PLOT3D data set.
  vtkNew<vtkStructuredGridOutlineFilter> outline;
  outline->SetInputData(pl3d_output);
  vtkNew<vtkPolyDataMapper> outlineMapper;
  outlineMapper->SetInputConnection(outline->GetOutputPort());
  vtkNew<vtkActor> outlineActor;
  outlineActor->SetMapper(outlineMapper);
  outlineActor->GetProperty()->SetColor(colors->GetColor3d("Black").GetData());

  // Create the Renderers, RenderWindow, and RenderWindowInteractor.
  vtkNew<vtkRenderer> renderer;
  vtkNew<vtkRenderer> renderer2;
  vtkNew<vtkRenderWindow> renderWindow;
  renderWindow->AddRenderer(renderer);
  renderWindow->AddRenderer(renderer2);
  vtkNew<vtkRenderWindowInteractor> interactor;
  interactor->SetRenderWindow(renderWindow);

  // Set the background, viewport (necessary because we want to have the
  // renderers draw to different parts of the render window) of the first
  // renderer.  Add the outline and line actors to the renderer.
  renderer->SetBackground(colors->GetColor3d("blue_light").GetData());
  renderer->SetViewport(0, 0, .5, 1);
  renderer->AddActor(outlineActor);
  renderer->AddActor(lineActor);

  // Set the background and viewport of the second renderer.  Add the
  // xy-plot actors to the renderer.  Set the size of the render window.
  renderer2->SetBackground(colors->GetColor3d("silver").GetData());
  renderer2->SetViewport(0.5, 0.0, 1.0, 1.0);
  renderer2->AddActor2D(xyplot);
  renderer2->AddActor2D(xyplot2);
  renderer2->AddActor2D(xyplot3);
  renderWindow->SetSize(800, 600);

  // Set up the camera parameters.
  vtkCamera* cam1 = renderer->GetActiveCamera();
  cam1->SetClippingRange(3.95297, 100);
  cam1->SetFocalPoint(8.88908, 0.595038, 29.3342);
  cam1->SetPosition(-12.3332, 31.7479, 41.2387);
  cam1->SetViewUp(0.060772, -0.319905, 0.945498);

  interactor->Initialize();
  renderWindow->SetWindowName("XYPlot");
  renderWindow->Render();
  interactor->Start();

  return EXIT_SUCCESS;
}
CMakeLists.txt
cmake_minimum_required(VERSION 3.12 FATAL_ERROR)

project(XYPlot)

find_package(VTK COMPONENTS
  CommonColor
  CommonCore
  CommonDataModel
  CommonTransforms
  FiltersCore
  FiltersGeneral
  FiltersSources
  IOParallel
  InteractionStyle
  RenderingAnnotation
  RenderingContextOpenGL2
  RenderingCore
  RenderingFreeType
  RenderingGL2PSOpenGL2
  RenderingOpenGL2
)

if (NOT VTK_FOUND)
  message(FATAL_ERROR "XYPlot: Unable to find the VTK build folder.")
endif()

# Prevent a "command line is too long" failure in Windows.
set(CMAKE_NINJA_FORCE_RESPONSE_FILE "ON" CACHE BOOL "Force Ninja to use response files.")
add_executable(XYPlot MACOSX_BUNDLE XYPlot.cxx )
  target_link_libraries(XYPlot PRIVATE ${VTK_LIBRARIES}
)
# vtk_module_autoinit is needed
vtk_module_autoinit(
  TARGETS XYPlot
  MODULES ${VTK_LIBRARIES}
)
Download and Build XYPlot
Click here to download XYPlot and its CMakeLists.txt file. Once the tarball XYPlot.tar has been downloaded and extracted,
cd XYPlot/build
If VTK is installed:
cmake ..
If VTK is not installed but compiled on your system, you will need to specify the path to your VTK build:
cmake -DVTK_DIR:PATH=/home/me/vtk_build ..
Build the project:
make
and run it:
./XYPlot
WINDOWS USERS
Be sure to add the VTK bin directory to your path. This will resolve the VTK dll's at run time.