Histogram2D
vtk-examples/Cxx/Plotting/Histogram2D
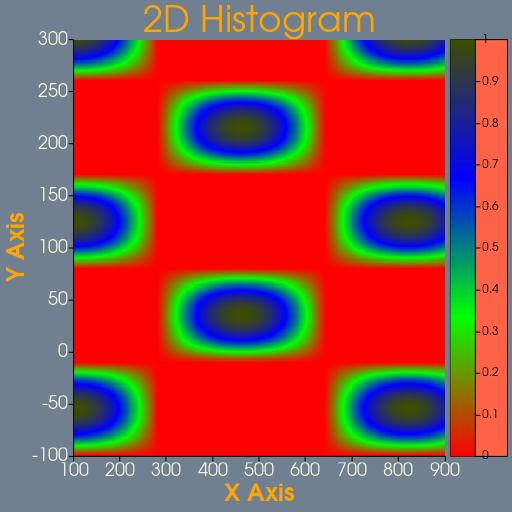
Description
This examples uses a vtkChartHistogram to draw a 2D histogram represented as an image.
The example shows how to set various properties.
Question
If you have a question about this example, please use the VTK Discourse Forum
Code
Histogram2D.cxx
#include <vtkAxis.h>
#include <vtkBrush.h>
#include <vtkChartHistogram2D.h>
#include <vtkColorLegend.h>
#include <vtkColorTransferFunction.h>
#include <vtkContextView.h>
#include <vtkImageData.h>
#include <vtkMath.h>
#include <vtkNamedColors.h>
#include <vtkNew.h>
#include <vtkRenderWindow.h>
#include <vtkRenderWindowInteractor.h>
#include <vtkRenderer.h>
#include <vtkTextProperty.h>

//----------------------------------------------------------------------------
int main(int, char*[])
{
  // Define colors.
  vtkNew<vtkNamedColors> colors;
  vtkColor3d backgroundColor = colors->GetColor3d("SlateGray");
  vtkColor3d titleColor = colors->GetColor3d("Orange");
  vtkColor3d axisTitleColor = colors->GetColor3d("Orange");
  vtkColor3d axisLabelColor = colors->GetColor3d("Beige");
  vtkColor4ub legendBackgroundColor = colors->GetColor4ub("Tomato");

  // Set up a 2D scene, add an XY chart to it.
  int size = 400;
  vtkNew<vtkContextView> view;
  view->GetRenderWindow()->SetSize(512, 512);
  view->GetRenderWindow()->SetWindowName("Histogram2D");

  view->GetRenderer()->SetBackground(backgroundColor.GetData());

  // Define a chart
  vtkNew<vtkChartHistogram2D> chart;

  // Chart Title.
  chart->SetTitle("2D Histogram");
  chart->GetTitleProperties()->SetFontSize(36);
  chart->GetTitleProperties()->SetColor(titleColor.GetData());

  // Chart Axes.
  chart->GetAxis(0)->GetTitleProperties()->SetFontSize(24);
  chart->GetAxis(0)->GetTitleProperties()->SetColor(axisTitleColor.GetData());
  chart->GetAxis(0)->GetLabelProperties()->SetColor(axisLabelColor.GetData());
  chart->GetAxis(0)->GetLabelProperties()->SetFontSize(18);

  chart->GetAxis(1)->GetTitleProperties()->SetFontSize(24);
  chart->GetAxis(1)->GetTitleProperties()->SetColor(
      colors->GetColor3d("orange").GetData());
  chart->GetAxis(1)->GetLabelProperties()->SetColor(
      colors->GetColor3d("beige").GetData());
  chart->GetAxis(1)->GetLabelProperties()->SetFontSize(18);

  // Chart Legend.
  dynamic_cast<vtkColorLegend*>(chart->GetLegend())->DrawBorderOn();
  chart->GetLegend()->GetBrush()->SetColor(legendBackgroundColor);

  // Add the chart to the view.
  view->GetScene()->AddItem(chart);

  vtkNew<vtkImageData> data;
  data->SetExtent(0, size - 1, 0, size - 1, 0, 0);
  data->AllocateScalars(VTK_DOUBLE, 1);

  data->SetOrigin(100.0, -100.0, 0.0);
  data->SetSpacing(2.0, 1.0, 1.0);

  double* dPtr = static_cast<double*>(data->GetScalarPointer(0, 0, 0));
  for (int i = 0; i < size; ++i)
  {
    for (int j = 0; j < size; ++j)
    {
      dPtr[i * size + j] =
          std::sin(vtkMath::RadiansFromDegrees(double(2 * i))) *
          std::cos(vtkMath::RadiansFromDegrees(double(j)));
    }
  }
  chart->SetInputData(data);

  vtkNew<vtkColorTransferFunction> transferFunction;
  transferFunction->AddHSVSegment(0.0, 0.0, 1.0, 1.0, 0.3333, 0.3333, 1.0, 1.0);
  transferFunction->AddHSVSegment(0.3333, 0.3333, 1.0, 1.0, 0.6666, 0.6666, 1.0,
                                  1.0);
  transferFunction->AddHSVSegment(0.6666, 0.6666, 1.0, 1.0, 1.0, 0.2, 1.0, 0.3);
  transferFunction->Build();
  chart->SetTransferFunction(transferFunction);

  view->GetRenderWindow()->Render();
  view->GetInteractor()->Start();

  return EXIT_SUCCESS;
}
CMakeLists.txt
cmake_minimum_required(VERSION 3.12 FATAL_ERROR)

project(Histogram2D)

find_package(VTK COMPONENTS
  ChartsCore
  CommonColor
  CommonCore
  CommonDataModel
  InteractionStyle
  RenderingContext2D
  RenderingContextOpenGL2
  RenderingCore
  RenderingFreeType
  RenderingGL2PSOpenGL2
  RenderingOpenGL2
  ViewsContext2D
)

if (NOT VTK_FOUND)
  message(FATAL_ERROR "Histogram2D: Unable to find the VTK build folder.")
endif()

# Prevent a "command line is too long" failure in Windows.
set(CMAKE_NINJA_FORCE_RESPONSE_FILE "ON" CACHE BOOL "Force Ninja to use response files.")
add_executable(Histogram2D MACOSX_BUNDLE Histogram2D.cxx )
  target_link_libraries(Histogram2D PRIVATE ${VTK_LIBRARIES}
)
# vtk_module_autoinit is needed
vtk_module_autoinit(
  TARGETS Histogram2D
  MODULES ${VTK_LIBRARIES}
)
Download and Build Histogram2D
Click here to download Histogram2D and its CMakeLists.txt file. Once the tarball Histogram2D.tar has been downloaded and extracted,
cd Histogram2D/build
If VTK is installed:
cmake ..
If VTK is not installed but compiled on your system, you will need to specify the path to your VTK build:
cmake -DVTK_DIR:PATH=/home/me/vtk_build ..
Build the project:
make
and run it:
./Histogram2D
WINDOWS USERS
Be sure to add the VTK bin directory to your path. This will resolve the VTK dll's at run time.