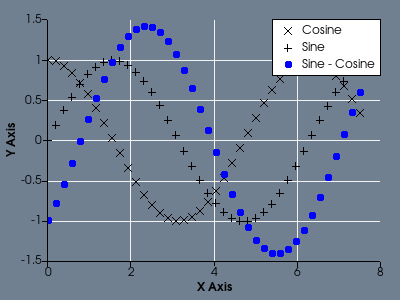
ScatterPlot
vtk-examples/Cxx/Plotting/ScatterPlot
Other languages
See (Python)
Question
If you have a question about this example, please use the VTK Discourse Forum
Code
ScatterPlot.cxx
#include <vtkChartXY.h>
#include <vtkContextView.h>
#include <vtkFloatArray.h>
#include <vtkNamedColors.h>
#include <vtkNew.h>
#include <vtkPlotPoints.h>
#include <vtkRenderWindow.h>
#include <vtkRenderWindowInteractor.h>
#include <vtkRenderer.h>
#include <vtkTable.h>

int main(int, char*[])
{
  vtkNew<vtkNamedColors> colors;

  // Set up a 2D scene, add an XY chart to it.
  vtkNew<vtkContextView> view;
  view->GetRenderWindow()->SetSize(400, 300);
  view->GetRenderWindow()->SetWindowName("ScatterPlot");
  view->GetRenderer()->SetBackground(colors->GetColor3d("SlateGray").GetData());

  vtkNew<vtkChartXY> chart;
  view->GetScene()->AddItem(chart);
  chart->SetShowLegend(true);

  // Create a table with some points in it...
  vtkNew<vtkTable> table;

  vtkNew<vtkFloatArray> arrX;
  arrX->SetName("X Axis");
  table->AddColumn(arrX);

  vtkNew<vtkFloatArray> arrC;
  arrC->SetName("Cosine");
  table->AddColumn(arrC);

  vtkNew<vtkFloatArray> arrS;
  arrS->SetName("Sine");
  table->AddColumn(arrS);

  vtkNew<vtkFloatArray> arrT;
  arrT->SetName("Sine - Cosine");
  table->AddColumn(arrT);

  // Test charting with a few more points...
  int numPoints = 40;
  float inc = 7.5 / (numPoints - 1);
  table->SetNumberOfRows(numPoints);
  for (int i = 0; i < numPoints; ++i)
  {
    table->SetValue(i, 0, i * inc);
    table->SetValue(i, 1, cos(i * inc) + 0.0);
    table->SetValue(i, 2, sin(i * inc) + 0.0);
    table->SetValue(i, 3, sin(i * inc) - cos(i * inc));
  }

  // Add multiple scatter plots, setting the colors etc.
  vtkPlot* points = chart->AddPlot(vtkChart::POINTS);
  points->SetInputData(table, 0, 1);
  points->SetColor(0, 0, 0, 255);
  points->SetWidth(1.0);
  dynamic_cast<vtkPlotPoints*>(points)->SetMarkerStyle(vtkPlotPoints::CROSS);

  points = chart->AddPlot(vtkChart::POINTS);
  points->SetInputData(table, 0, 2);
  points->SetColor(0, 0, 0, 255);
  points->SetWidth(1.0);
  dynamic_cast<vtkPlotPoints*>(points)->SetMarkerStyle(vtkPlotPoints::PLUS);

  points = chart->AddPlot(vtkChart::POINTS);
  points->SetInputData(table, 0, 3);
  points->SetColor(0, 0, 255, 255);
  points->SetWidth(1.0);
  dynamic_cast<vtkPlotPoints*>(points)->SetMarkerStyle(vtkPlotPoints::CIRCLE);

  // Finally render the scene.
  view->GetRenderWindow()->SetMultiSamples(0);
  view->GetRenderWindow()->Render();
  view->GetInteractor()->Initialize();
  view->GetInteractor()->Start();

  return EXIT_SUCCESS;
}
CMakeLists.txt
cmake_minimum_required(VERSION 3.12 FATAL_ERROR)

project(ScatterPlot)

find_package(VTK COMPONENTS
  ChartsCore
  CommonColor
  CommonCore
  CommonDataModel
  InteractionStyle
  RenderingContextOpenGL2
  RenderingCore
  RenderingFreeType
  RenderingGL2PSOpenGL2
  RenderingOpenGL2
  ViewsContext2D
)

if (NOT VTK_FOUND)
  message(FATAL_ERROR "ScatterPlot: Unable to find the VTK build folder.")
endif()

# Prevent a "command line is too long" failure in Windows.
set(CMAKE_NINJA_FORCE_RESPONSE_FILE "ON" CACHE BOOL "Force Ninja to use response files.")
add_executable(ScatterPlot MACOSX_BUNDLE ScatterPlot.cxx )
  target_link_libraries(ScatterPlot PRIVATE ${VTK_LIBRARIES}
)
# vtk_module_autoinit is needed
vtk_module_autoinit(
  TARGETS ScatterPlot
  MODULES ${VTK_LIBRARIES}
)
Download and Build ScatterPlot
Click here to download ScatterPlot and its CMakeLists.txt file. Once the tarball ScatterPlot.tar has been downloaded and extracted,
cd ScatterPlot/build
If VTK is installed:
cmake ..
If VTK is not installed but compiled on your system, you will need to specify the path to your VTK build:
cmake -DVTK_DIR:PATH=/home/me/vtk_build ..
Build the project:
make
and run it:
./ScatterPlot
WINDOWS USERS
Be sure to add the VTK bin directory to your path. This will resolve the VTK dll's at run time.