Python Examples
Please see this page to learn how to setup your environment to use VTK in Python.
It would be appreciated if there are any Python VTK experts who could convert any of the c++ examples to Python!
VTK Classes Summary
This Python script, SelectExamples, will let you select examples based on a VTK Class and language. It requires Python 3.7 or later. The following tables will produce similar information.
-
VTK Classes with Examples, this table is really useful when searching for example(s) using a particular class.
-
VTK Classes with No Examples, please add examples in your area of expertise!
Tutorials
If you are new to VTK then these tutorials will help to get you started.
Hello World
| Example Name | Description | Image |
|---|---|---|
| A hello world example | Cylinder example from the VTK Textbook and source code. A hello world example. | 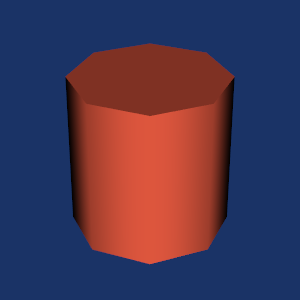 |
Simple Operations
| Example Name | Description | Image |
|---|---|---|
| DistanceBetweenPoints |
Input and Output
Graph Formats
3D File Formats
Standard Formats
Input
| Example Name | Description | Image |
|---|---|---|
| CSVReadEdit | Read and edit a CSV file using pandas and numpy. |  |
| CSVReadEdit1 | Read and edit a CSV file using pandas and vtkDelimitedTextReader. |  |
| ReadExodusData | A simple script for reading and viewing ExodusII data interactively. |  |
| ReadPLOT3D | Read CFD (computational fluid dynamics) data produced by PLOT3D. | 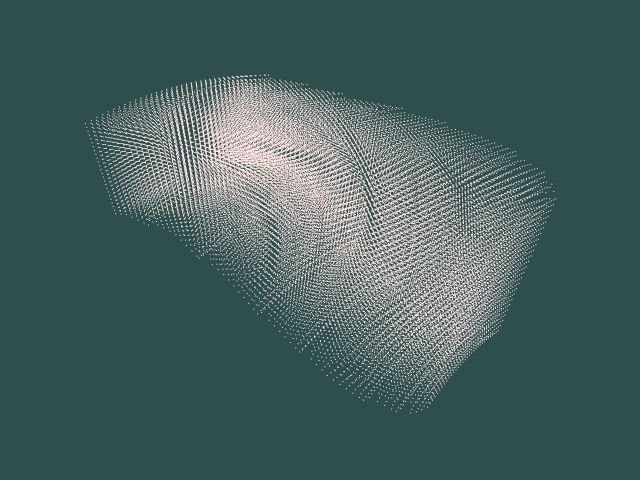 |
| ReadSLC | Read an SLC file. |  |
| ReadSTL | Read an STL file. | 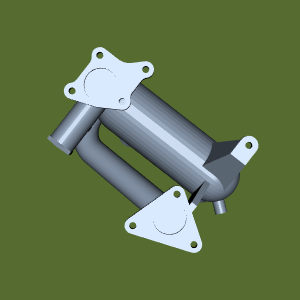 |
| ReadUnstructuredGrid | Using vtkUnstructuredGridReader to read a (legacy) *.vtk file |  |
| ReadVTP | Read a VTK XML PolyData file. | 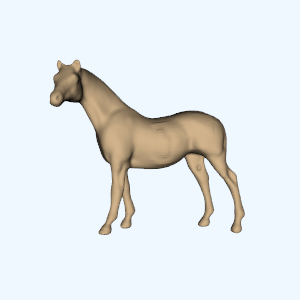 |
| TransientHDFReader | Read transient data written inside a vtkhdf file. | |
Importers
| Example Name | Description | Image |
|---|---|---|
| 3DSImporter | Import a 3D Studio scene that includes multiple actors. |  |
Output
| Example Name | Description | Image |
|---|---|---|
| WritePLY |  | |
| WriteSTL |  | |
VTK Formats
Input
| Example Name | Description | Image |
|---|---|---|
| ReadImageData | Read an image data (.vti) file |  |
| ReadPolyData | Read a polygonal data (.vtp) file |  |
Output
Legacy VTK Formats
| Example Name | Description | Image |
|---|---|---|
| ReadLegacyUnstructuredGrid | Read an unstructured grid that contains 11 linear cells. | 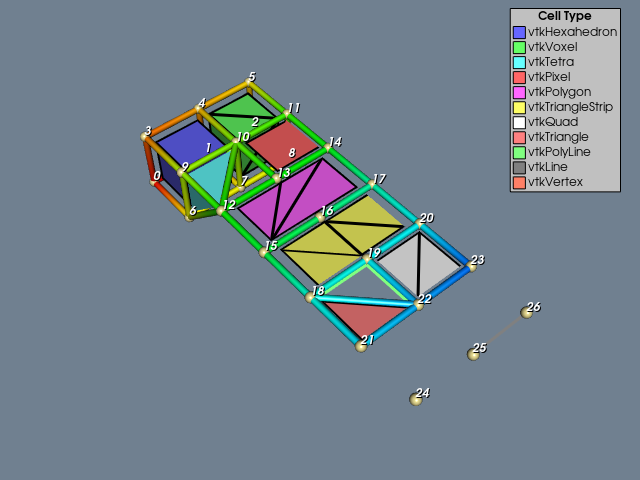 |
| WriteLegacyLinearCells | Write each linear cell into a legacy UnstructuredGrid file. | |
| WriteXMLLinearCells | Write each linear cell into an XML UnstructuredGrid file (.vtu). |
Image Format
Input
| Example Name | Description | Image |
|---|---|---|
| HDRReader | Read a high-dynamic-range imaging file. | 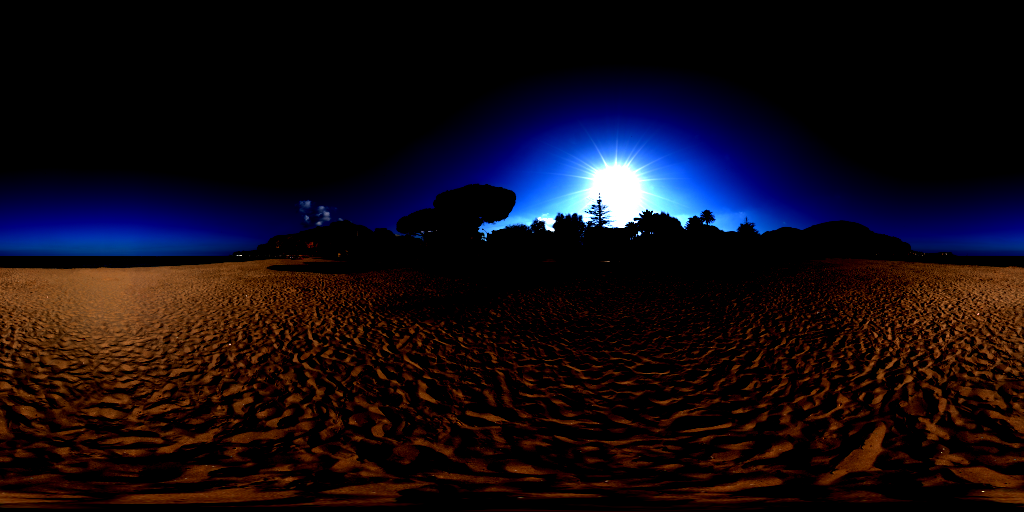 |
| ReadDICOM | Read DICOM file. |  |
| ReadDICOMSeries | This example demonstrates how to read a series of DICOM images and scroll through slices |  |
Output
| Example Name | Description | Image |
|---|---|---|
| ImageWriter | Write an imagefile based on the file extension. | 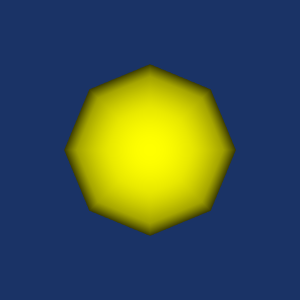 |
Geometric Objects
| Example Name | Description | Image |
|---|---|---|
| Axes | 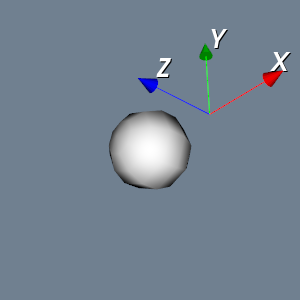 | |
| Circle | A disk is shown however this can be modified to show a circle. |  |
| ColoredLines | 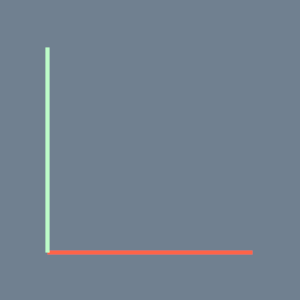 | |
| Dodecahedron | Create a dodecahedron using vtkPolyhedron. |  |
| EllipticalCylinder | Create an elliptical cylinder using extrusion. | 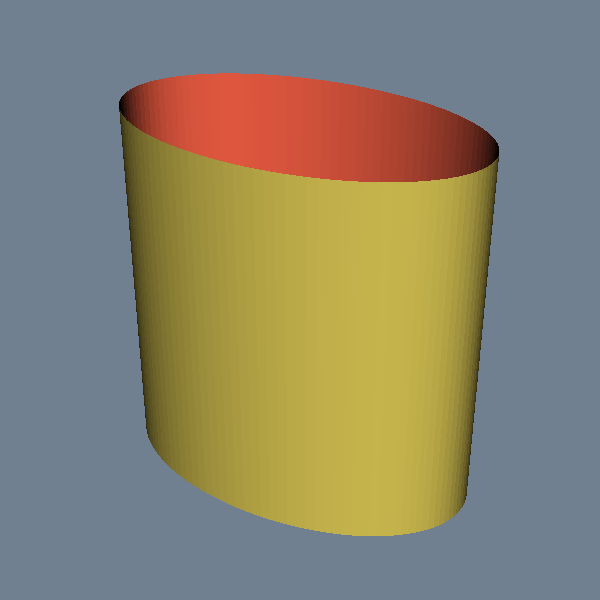 |
| EllipticalCylinderDemo | Show the base and extrusion vector. |  |
| GeometricObjectsDemo |  | |
| Planes | We create a convex hull of the planes for display purposes. |  |
| PlanesIntersection | ||
| PolygonIntersection | IntersectWithLine() | |
| SourceObjectsDemo | Examples of source objects that procedurally generate polygonal models. These nine images represent just some of the capability of VTK. From upper left in reading order: sphere, cone, cylinder, cube, plane, text, random point cloud, disk (with or without hole), and line source. Other polygonal source objects are available; check subclasses of vtkPolyDataAlgorithm. |  |
Cells
| Example Name | Description | Image |
|---|---|---|
| Cell3DDemonstration | Sample objects are generated from the classes derived from vtkCell3D and displayed. |  |
| CellTypeSource | Generate tessellated cells. | 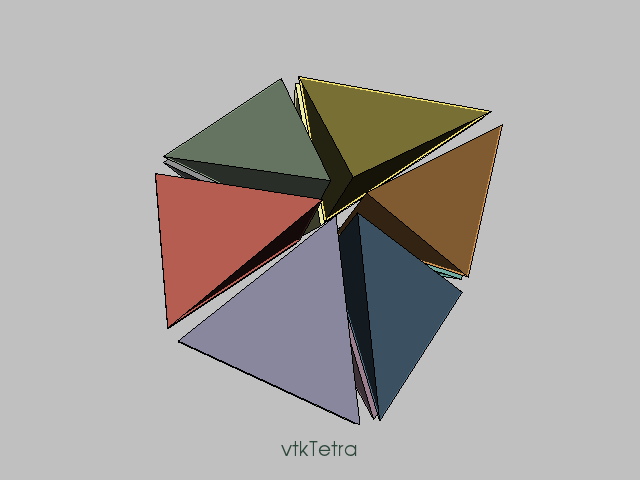 |
| ConvexPointSet | Generate a ConvexPointSetCell. |  |
| Hexahedron | 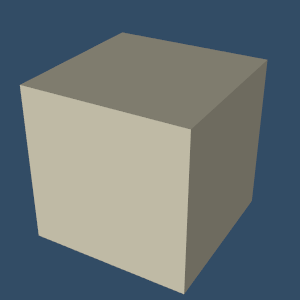 | |
| LinearCellDemo | Linear cell types found in VTK. Numbers define ordering of the defining points. |  |
| LongLine | Manually create a polyline. |  |
| Point |  | |
| PolyLine |  | |
| Polygon |  | |
| Polyhedron | Create an unstructured grid representation of a polyhedron (cube) and write it out to a file. |  |
| Pyramid |  | |
| Quad |  | |
| Tetrahedron |  | |
| Triangle |  | |
| TriangleStrip |  | |
| Vertex |  | |
Sources
| Example Name | Description | Image |
|---|---|---|
| Arrow |  | |
| Cone |  | |
| Cube | Manually build a polygonal cube. |  |
| Cube1 | A nice simple example that demonstrates the operation of the VTK pipeline. |  |
| Cylinder |  | |
| Disk | A circle with a hole in it. |  |
| EarthSource | Create the Earth. |  |
| Frustum |  | |
| Line |  | |
| OrientedArrow | Orient an arrow along an arbitrary vector. |  |
| OrientedCylinder | Orient a cylinder along an arbitrary vector. |  |
| Plane |  | |
| PlatonicSolids | All five platonic solids are displayed. |  |
| PolyLine1 | This example demonstrates how to create a polygon through several ordered points. |  |
| RegularPolygonSource |  | |
| ShrinkCube | Applying shrink filter to an object. |  |
| Sphere |  | |
| TessellatedBoxSource | Generate a box with tessellated sides. | 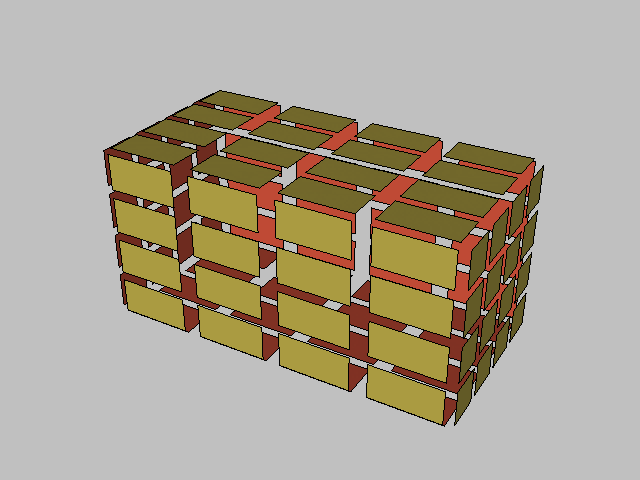 |
| TextActor | 2D "HUD-type" text |  |
Non Linear
| Example Name | Description | Image |
|---|---|---|
| IsoparametricCellsDemo | Nonlinear isoparametric cell types in VTK. |  |
| QuadraticHexahedron | Create and tessellate a nonlinear cell. | 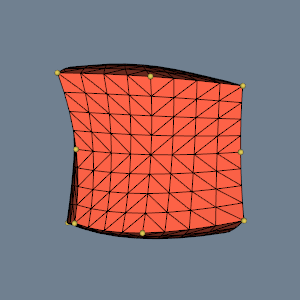 |
| QuadraticHexahedronDemo | Interactively adjust chord error. |  |
| QuadraticTetra | Create and tessellate a nonlinear cell. |  |
| QuadraticTetraDemo | Interactively adjust chord error. |  |
Parametric Objects
| Example Name | Description | Image |
|---|---|---|
| ParametricKuenDemo | Interactively change the parameters for a Kuen Surface. | 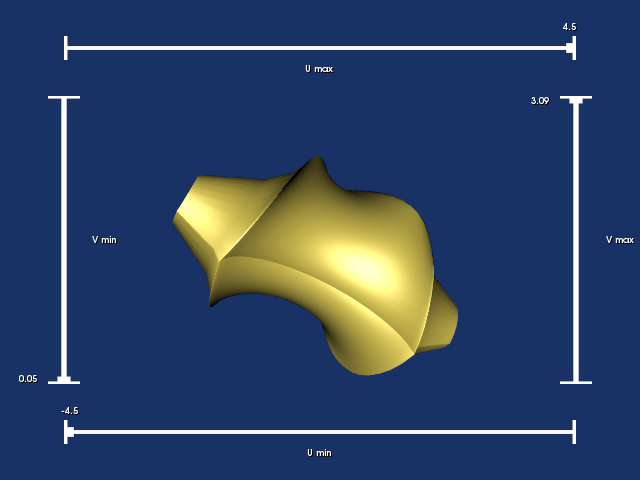 |
| ParametricObjectsDemo | Demonstrates the Parametric classes added by Andrew Maclean and additional classes added by Tim Meehan. The parametric spline is also included. Options are provided to display single objects, add backface, add normals and print out an image. | 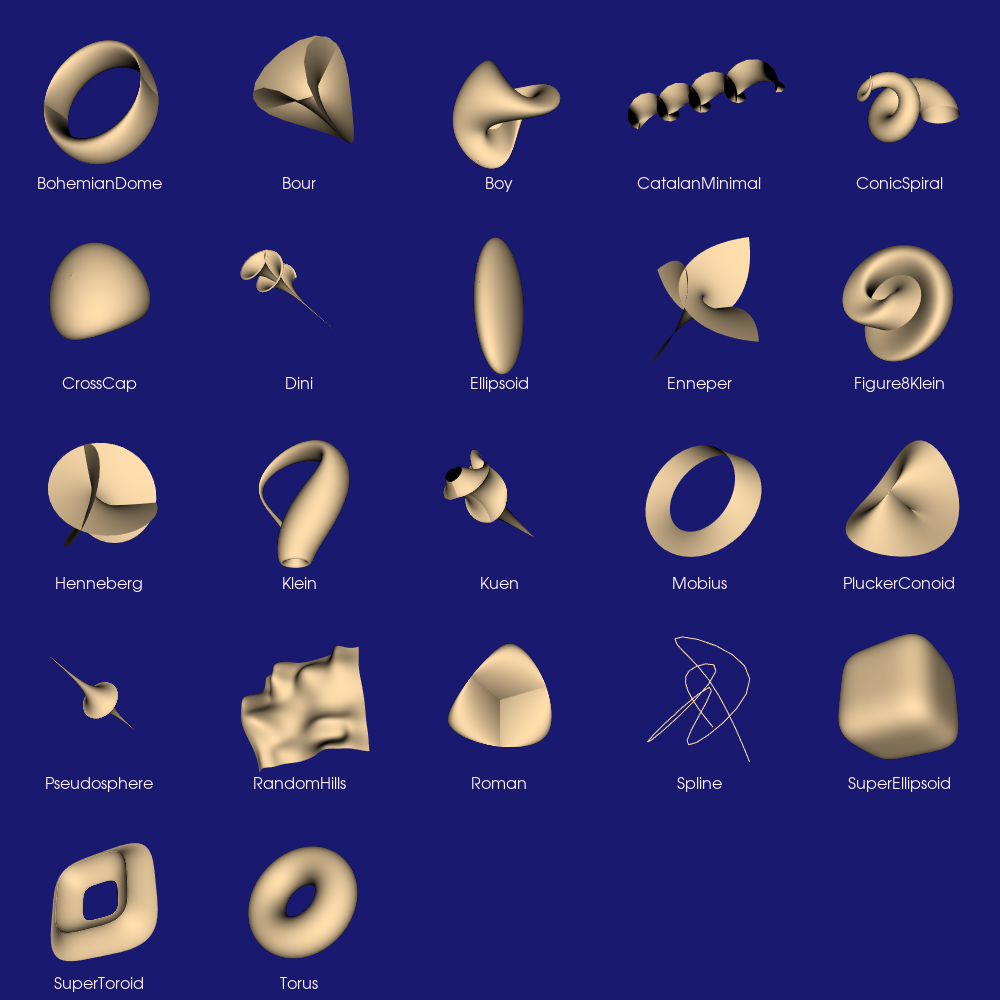 |
| ParametricSuperEllipsoidDemo | Interactively change the parameters for a SuperEllipsoid Surface. | 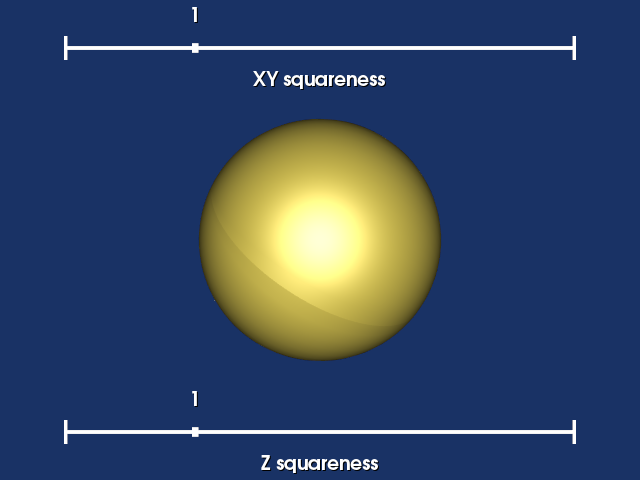 |
| ParametricSuperToroidDemo | Interactively change the parameters for a SuperToroid Surface. |  |
Implicit Functions and Iso-surfaces
| Example Name | Description | Image |
|---|---|---|
| BooleanOperationImplicitFunctions | Demonstrate booleans of two different implicit functions |  |
| ContourTriangulator | Create a contour from a structured point set (image) and triangulate it. | 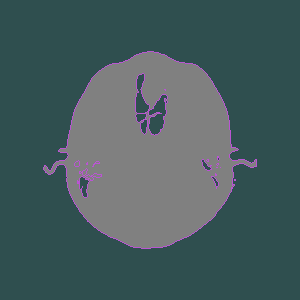 |
| CutWithScalars | Cut a surface with scalars. | 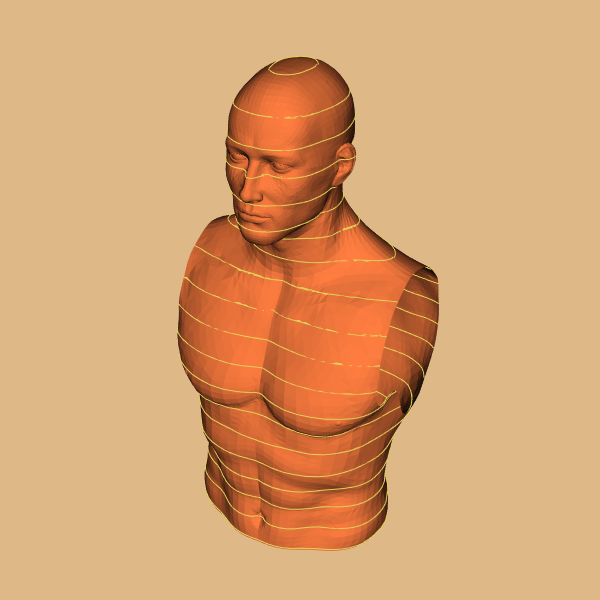 |
| DiscreteMarchingCubes | Generate surfaces from labeled data. | |
| ExtractData | Implicit functions used to select data: Two ellipsoids are combined using the union operation used to select voxels from a volume. Voxels are shrunk 50 percent. | 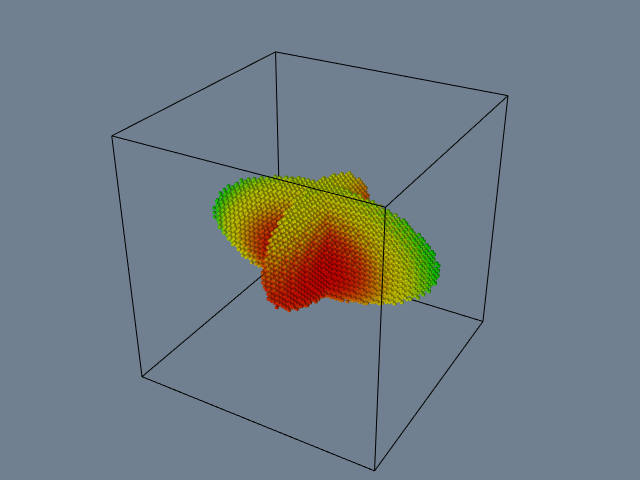 |
| ExtractLargestIsosurface | Extract largest isosurface. |  |
| Hello | Implicit modelling used to thicken a stroked font. |  |
| IceCream | How to use boolean combinations of implicit functions to create a model of an ice cream cone. | 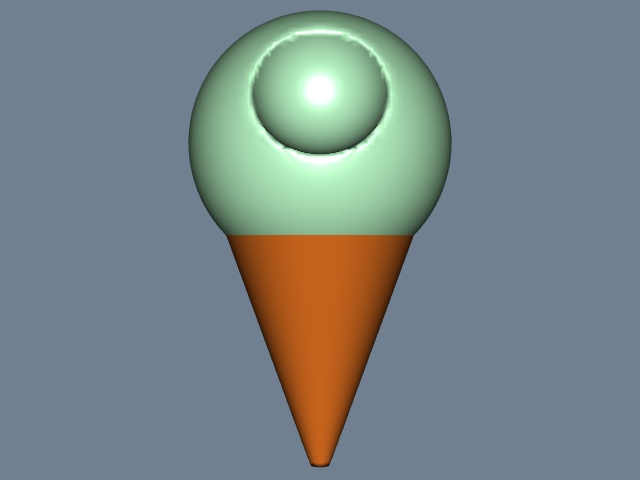 |
| ImplicitQuadric | Create an ellipsoid using an implicit quadric |  |
| ImplicitSphere | Demonstrate sampling of a sphere implicit function |  |
| ImplicitSphere1 | Demonstrate sampling of a sphere implicit function |  |
| Lorenz | Visualizing a Lorenz strange attractor by integrating the Lorenz equations in a volume. |  |
| MarchingCases | Explore the Marching Cubes cases. | 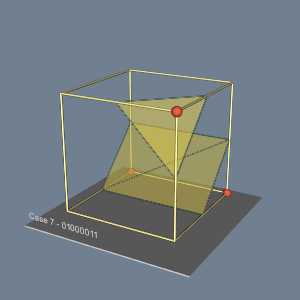 |
| MarchingCasesA | The 256 possible cases have been reduced to 15 cases using symmetry. | 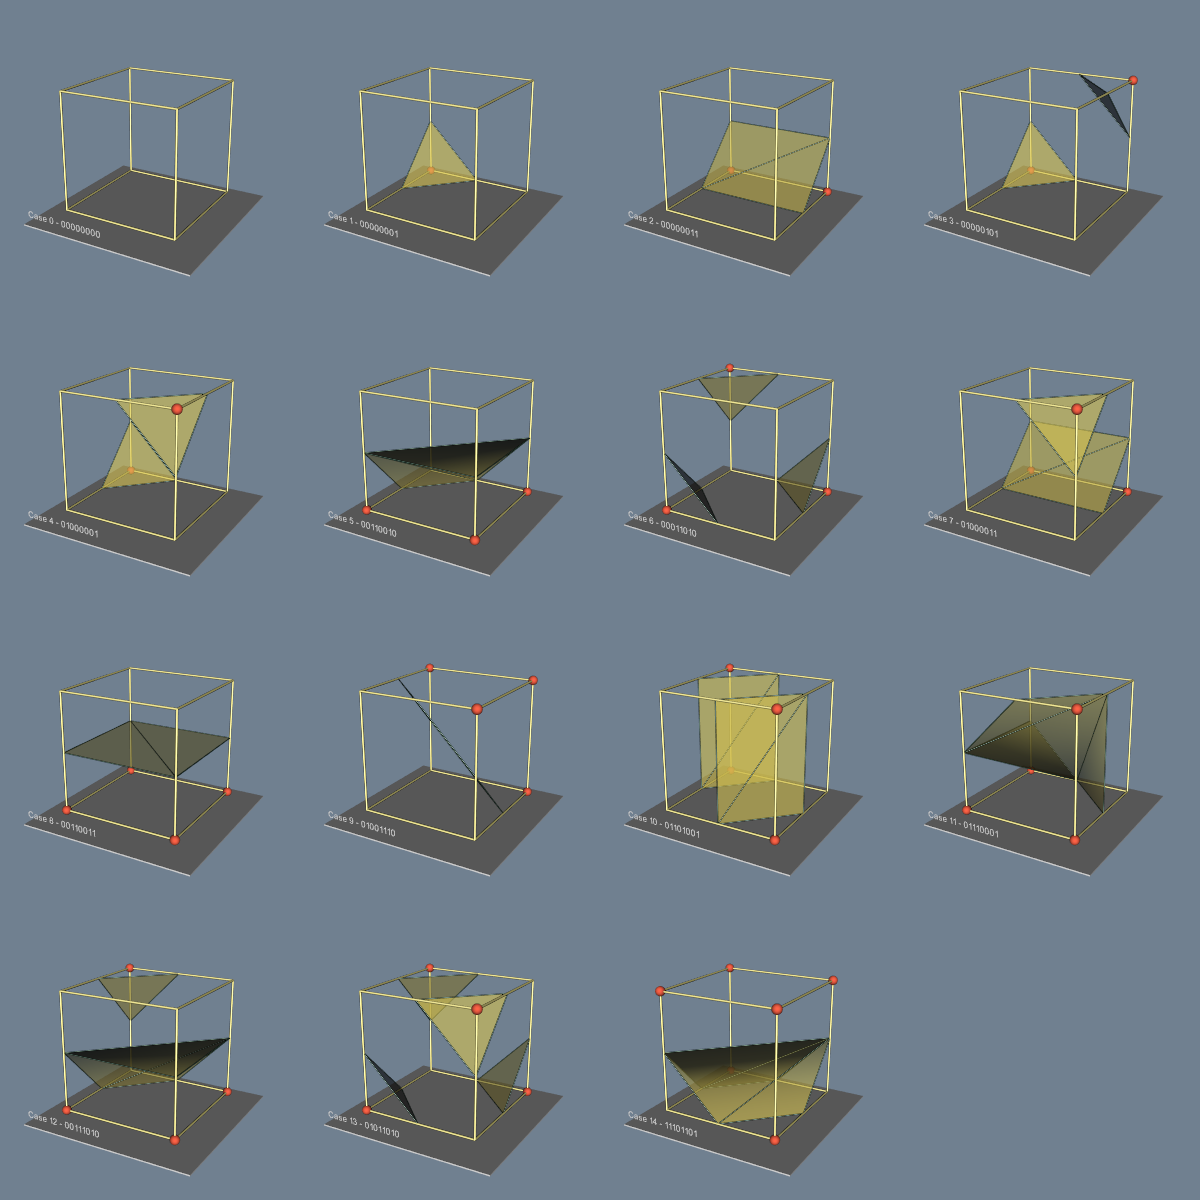 |
| MarchingCasesB | Marching cubes complementary cases. Cases 3c, 6c, 7c, 10c, 12c and 13c are displayed. |  |
| MarchingCasesC | Marching cubes, case 3 is rotated 90 degrees about the y-axis with no label. | 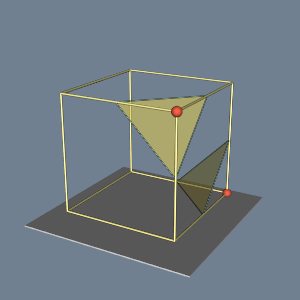 |
| MarchingCasesD | Marching cubes, case 7 is rotated 180 degrees about the y-axis with no label. |  |
| MarchingCubes | Create a voxelized sphere. | 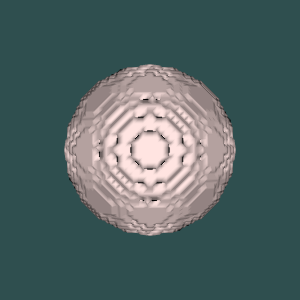 |
| SampleFunction | Sample and visualize an implicit function. | 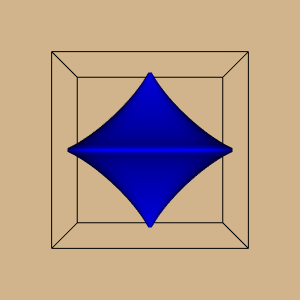 |
| SmoothDiscreteMarchingCubes | Generate smooth surfaces from labeled data. | 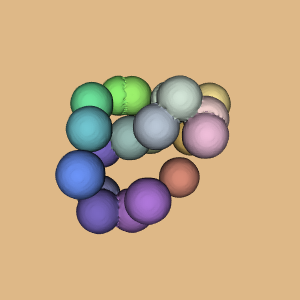 |
Working with 3D Data
| Example Name | Description | Image |
|---|---|---|
| AlignTwoPolyDatas | Align two vtkPolyData's. | 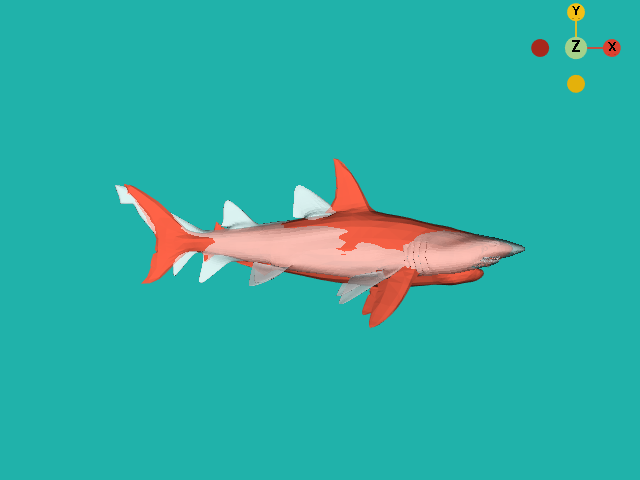 |
| AppendFilter | Append different types of data, |  |
| BooleanOperationPolyDataFilter | This example performs a boolean operation (Intersection, Union, Difference) of two PolyData |  |
| Bottle | Rotationally symmetric objects. |  |
| CappedSphere | Rotate an arc to create a capped sphere. | 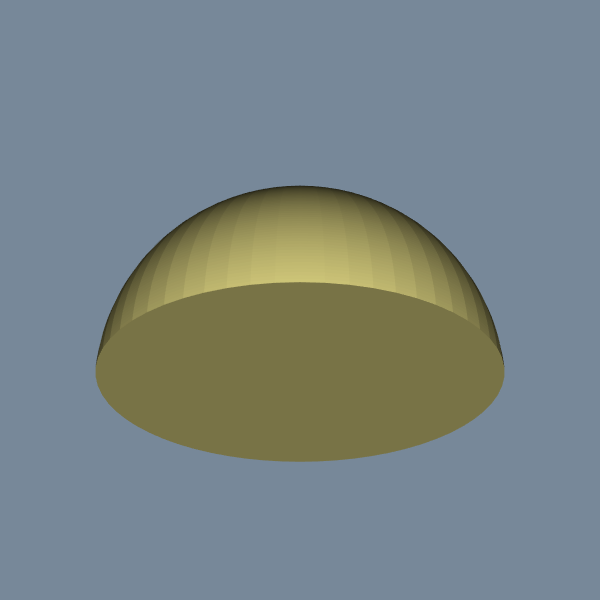 |
| CellsInsideObject | Extract cells inside a closed surface. |  |
| ColoredTriangle | Creates a file TriangleColored.vtp. | |
| CombinePolyData | This example combines Polydata objects, and displays the result to the screen. | 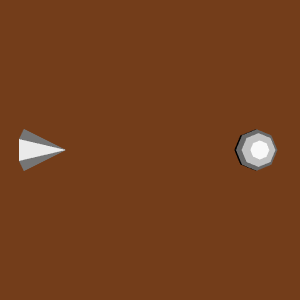 |
| ConnectivityFilter | Color any dataset type based on connectivity. |  |
| CurvaturesAdjustEdges | Get the Gaussian and Mean curvatures of a surface with adjustments for edge effects. | 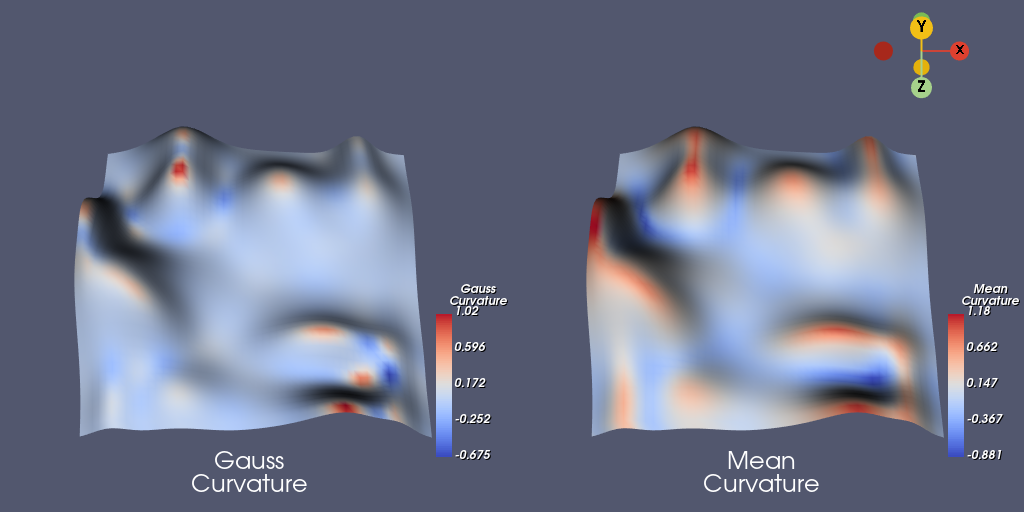 |
| CurvaturesDemo | Demonstrates how to get the Gaussian and Mean curvatures of a surface. | 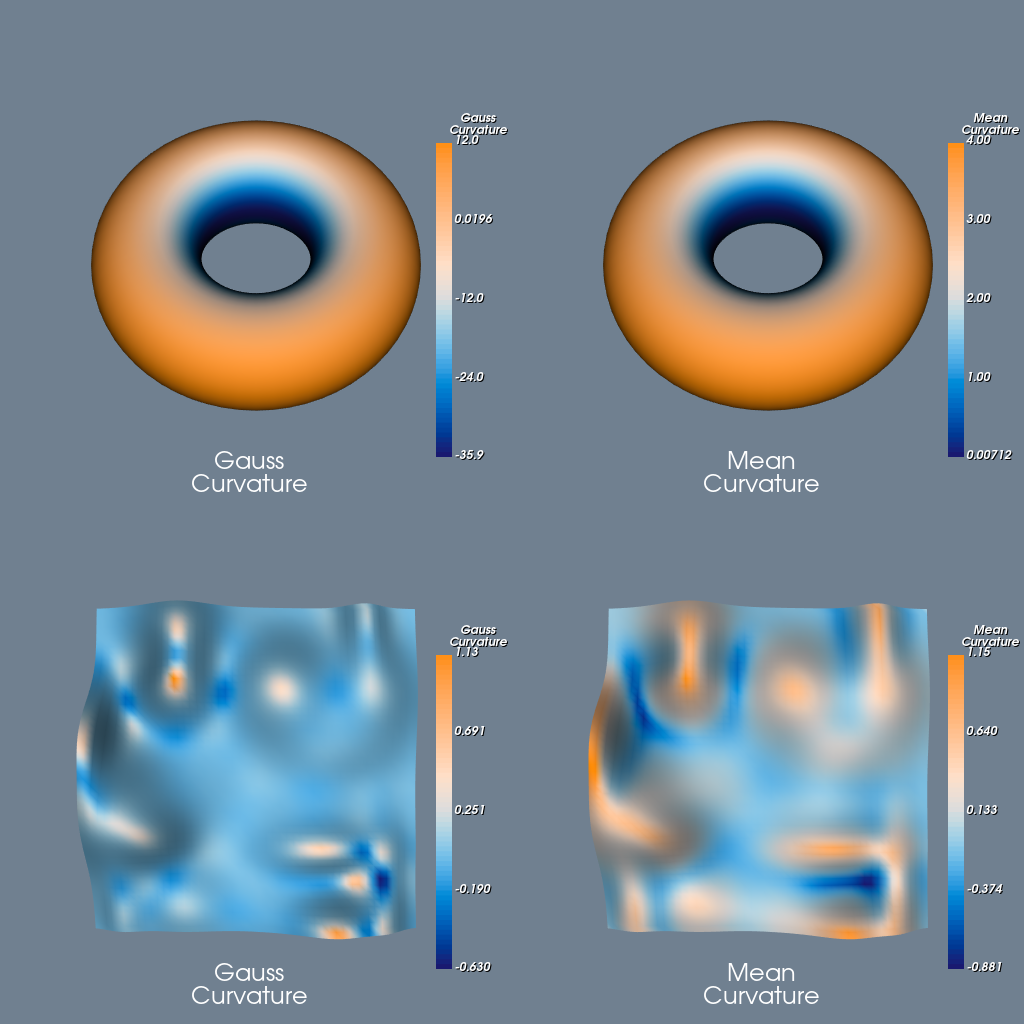 |
| ExtractPolyLinesFromPolyData | Extract polylines from polydata. |  |
| ExtractSelection | Extract selected points. | 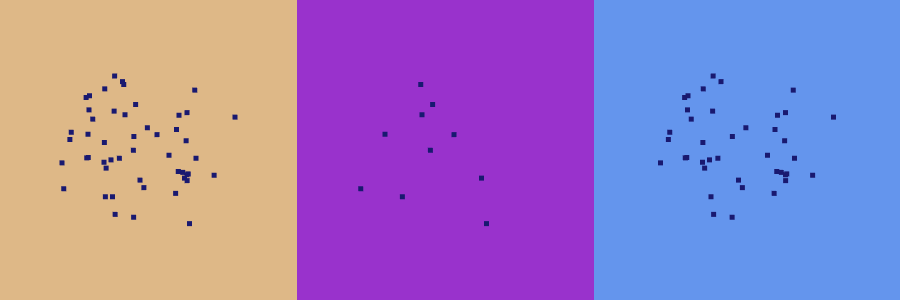 |
| ExtractSelectionCells | Extract cell, select cell. | 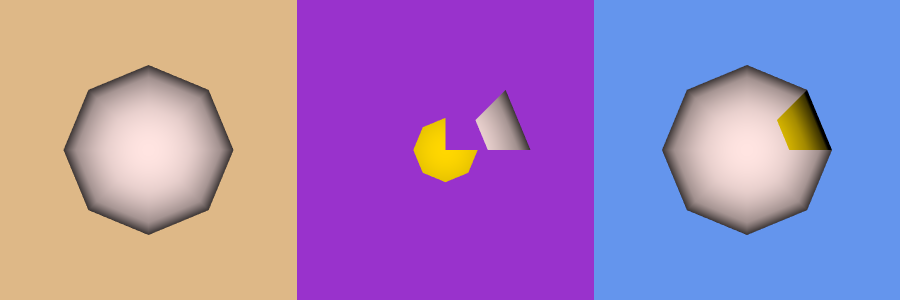 |
| FilledPolygon |  | |
| Finance | Visualization of multidimensional financial data. The gray/wireframe surface represents the total data population. The red surface represents data points delinquent on loan payment. |  |
| FinanceFieldData | Visualization of multidimensional financial data. The yellow surface represents the total data population. The red surface represents data points delinquent on loan payment. |  |
| Glyph2D | 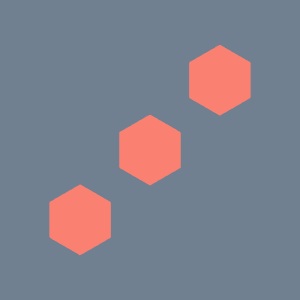 | |
| Glyph3D |  | |
| ImplicitPolyDataDistance |  | |
| IterateOverLines | Iterate through the lines of a PolyData. | |
| IterativeClosestPoints | ||
| LineOnMesh |  | |
| MeshLabelImageColor |  | |
| Outline |  | |
| PerlinNoise | 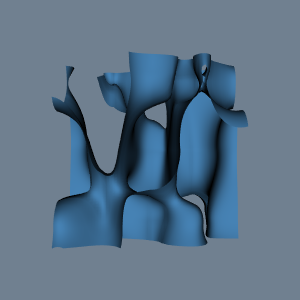 | |
| PolyDataContourToImageData | ||
| PolyDataToImageDataStencil |  | |
| RotationAroundLine |  | |
| RuledSurfaceFilter |  | |
| SmoothMeshGrid | 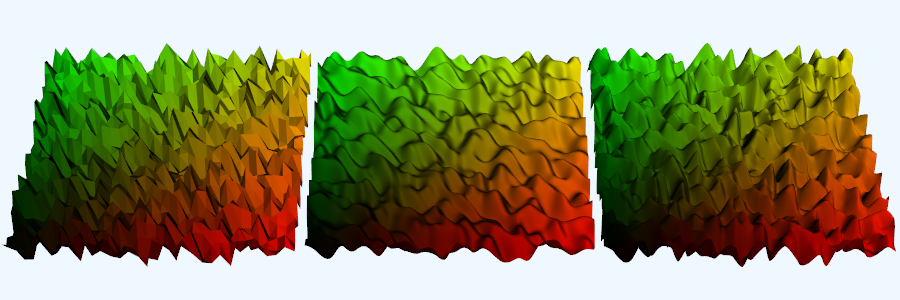 | |
| SolidColoredTriangle | Writes out a file TriangleSolidColor.vtp. | |
| Spring | Rotation in combination with linear displacement and radius variation. |  |
| TransformPolyData | Apply a Transformation to a PolyData. | |
| TriangleColoredPoints | ||
| TriangleCornerVertices | ||
| TriangleCorners | ||
| TriangulateTerrainMap | Generate heights (z values) on a 10x10 grid (a terrain map) and then triangulate the points to form a surface. |  |
| TubeFilter | Give lines a thickness (produce a cylinder around lines). |  |
| VertexGlyphFilter | Add a vertex to each point. |  |
| WarpTo | Deform geometry by warping towards a point. |  |
| WarpVector | This example warps/deflects a line. |  |
| WriteTriangleToFile |
Data Types
| Example Name | Description | Image |
|---|---|---|
| CompositePolyDataMapper |  | |
| MultiBlockDataSet | Demonstrates how to make and use VTK's MultiBlock type data |  |
| OverlappingAMR | Demonstrates how to create and populate a VTK's Overlapping AMR Grid type Data | 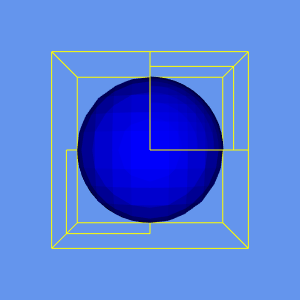 |
Data Type Conversions
Point Cloud Operations
| Example Name | Description | Image |
|---|---|---|
| PointSource | Generate a random point cloud. |  |
Working with Meshes
This section includes examples of manipulating meshes.
| Example Name | Description | Image |
|---|---|---|
| BoundaryEdges | Find the edges that are used by only one face. |  |
| ClosedSurface | Check if a surface is closed. | |
| ColoredElevationMap | Color a mesh by height. | 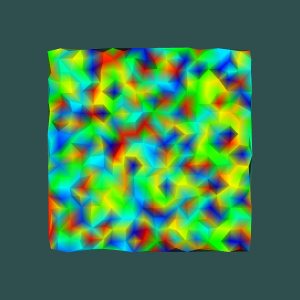 |
| Curvatures | Compute Gaussian, and Mean Curvatures. | 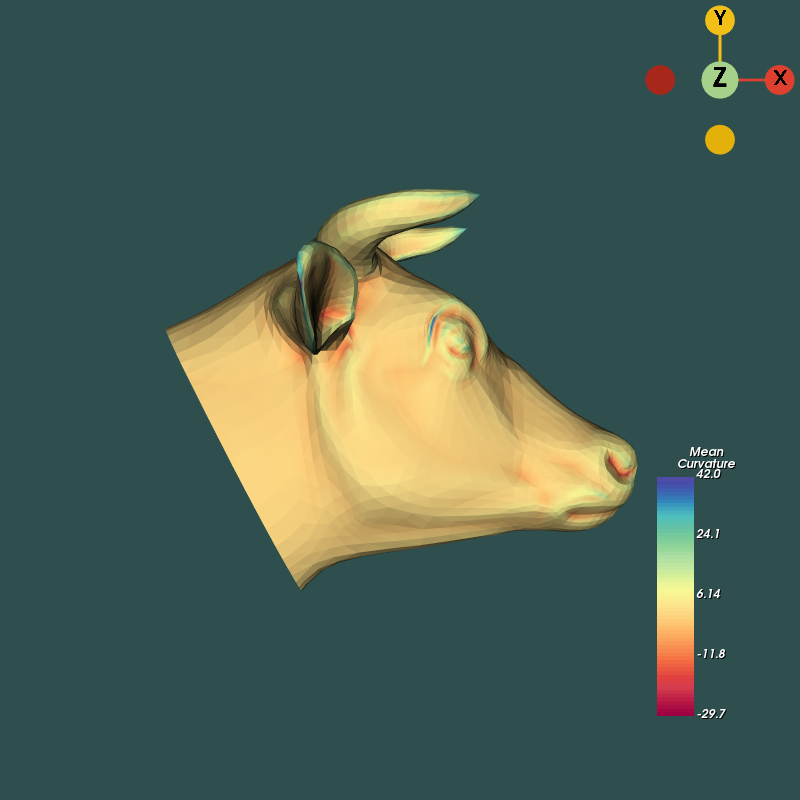 |
| Decimation | Reduce the number of triangles in a mesh. |  |
| DeformPointSet | Use the vtkDeformPointSet filter to deform a vtkSphereSource with arbitrary polydata. |  |
| DelaunayMesh | Two-dimensional Delaunay triangulation of a random set of points. Points and edges are shown highlighted with sphere glyphs and tubes. |  |
| PointInterpolator | Plot a scalar field of points onto a PolyData surface. |  |
Clipping
| Example Name | Description | Image |
|---|---|---|
| CapClip | Cap a clipped polydata with a polygon. |  |
| ClipDataSetWithPolyData | Clip a vtkRectilinearGrid with arbitrary polydata. In this example, use a vtkConeSource to generate polydata to slice the grid, resulting in an unstructured grid. | 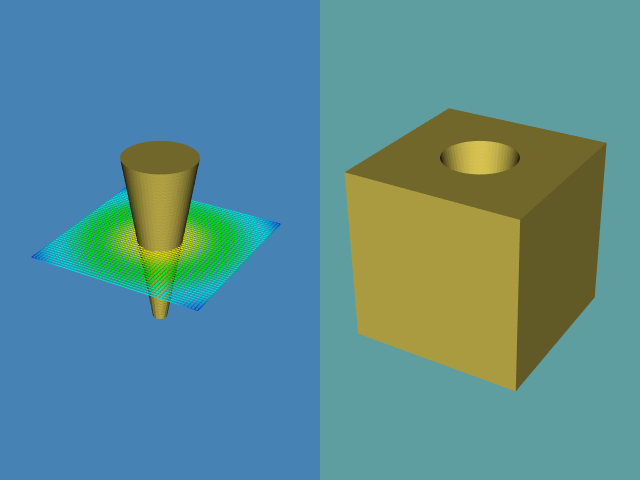 |
| ClipDataSetWithPolyData1 | Clip a vtkRectilinearGrid with arbitrary polydata. In this example, use a vtkConeSource to generate polydata to slice the grid, resulting in an unstructured grid. |  |
| SolidClip | Create a "solid" clip. The "ghost" of the part clipped away is also shown. | 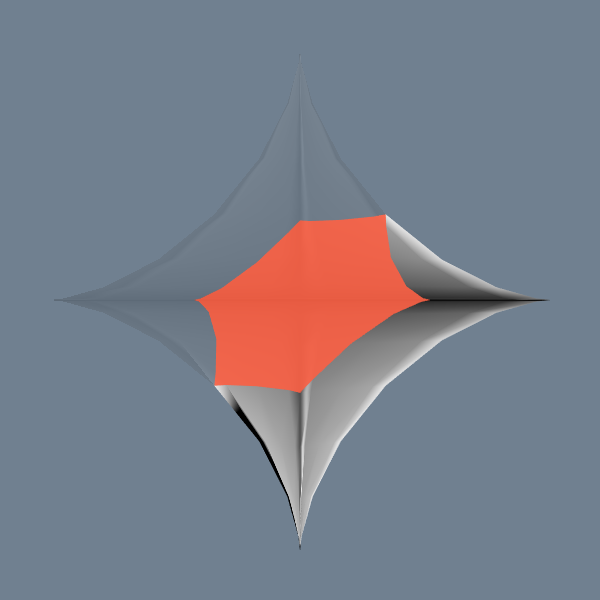 |
Working with Structured 3D Data
This section includes vtkImageData, vtkExplicitStructuredGrid, vtkStructuredGrid, vtkStructuredPoints and vtkRectilinearGrid.
"ImageData" is not the traditional "flat, 2D image" you are used to. It is a special VTK data structure in the collection of 3D data structures provided by VTK. Image data can represent at typical 2D image, but also, a 3D volume.
vtkImageData
| Example Name | Description | Image |
|---|---|---|
| ImageWeightedSum | Add two or more images. |  |
vtkExplicitStructuredGrid
| Example Name | Description | Image |
|---|---|---|
| CreateESGrid | Create an explicit structured grid and convert this to an unstructured grid or vice versa. |  |
| LoadESGrid | Load a VTU file and convert the dataset to an explicit structured grid. |  |
vtkStructuredGrid
| Example Name | Description | Image |
|---|---|---|
| BlankPoint | Blank a point of a vtkStructuredGrid. | |
| SGrid | Creating a structured grid dataset of a semi-cylinder. Vectors are created whose magnitude is proportional to radius and oriented in tangential direction. |  |
vtkStructuredPoints
| Example Name | Description | Image |
|---|---|---|
| Vol | Creating a image data dataset. Scalar data is generated from the equation for a sphere. Volume dimensions are 26 x 26 x 26. |  |
vtkRectilinearGrid
| Example Name | Description | Image |
|---|---|---|
| RGrid | Creating a rectilinear grid dataset. The coordinates along each axis are defined using an instance of vtkDataArray. | 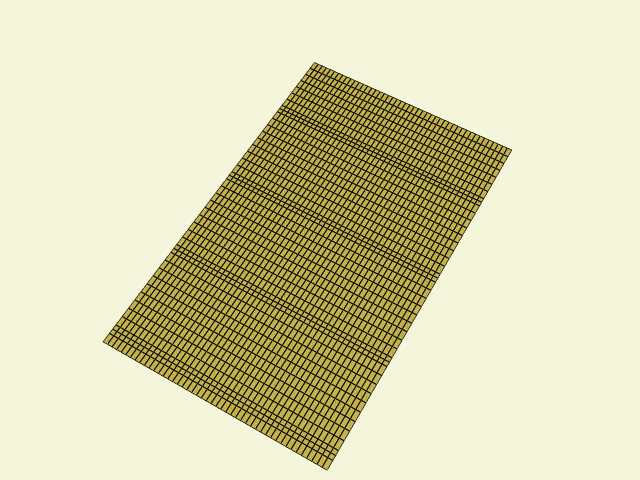 |
| RectilinearGrid | Create a rectilinear grid. |  |
| VisualizeRectilinearGrid | Visualize the cells of a rectilinear grid. |  |
Working with Unstructured 3D Data
This section includes vtkUnstructuredGrid.
vtkUnstructuredGrid
| Example Name | Description | Image |
|---|---|---|
| ClipUnstructuredGridWithPlane | Clip a UGrid with a plane. |  |
| ClipUnstructuredGridWithPlane2 | Clip a UGrid with a plane. | 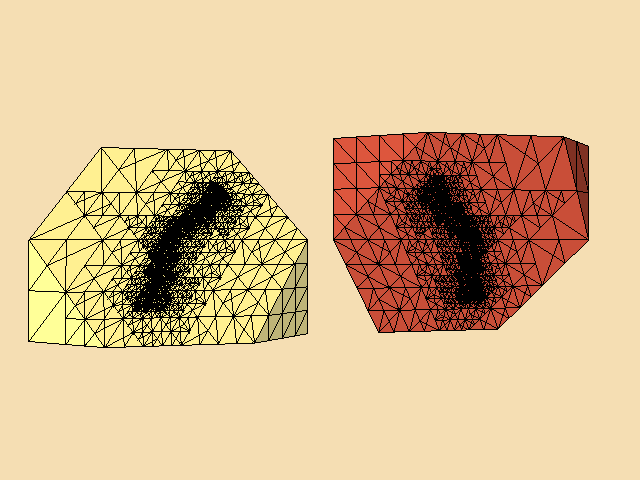 |
| UGrid | Creation of an unstructured grid. |  |
Registration
Medical
| Example Name | Description | Image |
|---|---|---|
| GenerateCubesFromLabels | Create cubes from labeled volume data. |  |
| GenerateModelsFromLabels | Create models from labeled volume data. | |
| MedicalDemo1 | Create a skin surface from volume data. | 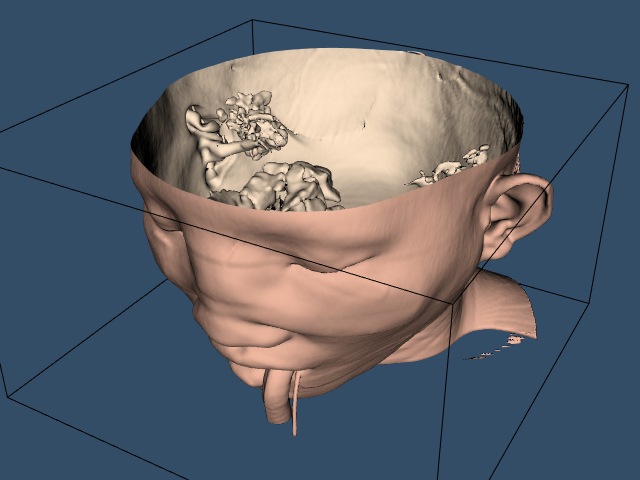 |
| MedicalDemo2 | Create a skin and bone surface from volume data. |  |
| MedicalDemo3 | Create skin, bone and slices from volume data. |  |
| MedicalDemo4 | Create a volume rendering. | 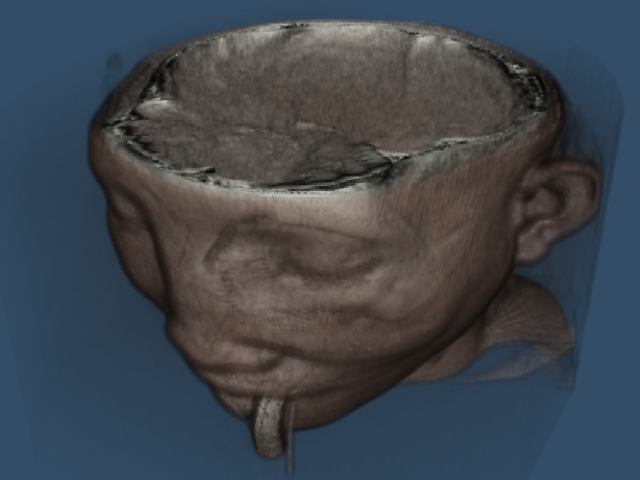 |
| TissueLens | Cut a volume with a sphere. |  |
Surface reconstruction
| Example Name | Description | Image |
|---|---|---|
| GaussianSplat | Create a surface from Unorganized Points (Gaussian Splat). |  |
Utilities
| Example Name | Description | Image |
|---|---|---|
| CheckVTKVersion | Check the VTK version and provide alternatives for different VTK versions. | |
| ColorMapToLUT_JSON | Take an JSON description of a colormap and convert it to a VTK colormap. | 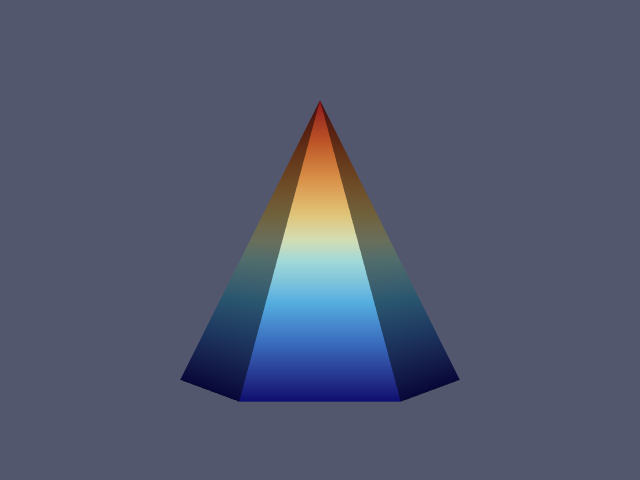 |
| ColorMapToLUT_XML | Take an XML description of a colormap and convert it to a VTK colormap. |  |
| ColorMapToLUT | Use vtkDiscretizableColorTransferFunction to generate a VTK colormap. |  |
| ConstrainedDelaunay2D | Perform a 2D Delaunay triangulation on a point set respecting a specified boundary. |  |
| Delaunay2D |  | |
| LUTUtilities | A utility class for vtkLookupTable allowing you to output the table contents or to compare tables. | |
| MultipleRenderWindows | Multiple Render Windows. |  |
| MultipleViewports | Multiple Viewports. |  |
| RescaleReverseLUT | Demonstrate how to adjust a colormap so that the colormap scalar range matches the scalar range on the object. You can optionally reverse the colors. |  |
| ResetCameraOrientation | Reset camera orientation to a previously saved orientation. |  |
| SaveSceneToFieldData | Save a vtkCamera's state in a vtkDataSet's vtkFieldData and restore it. | 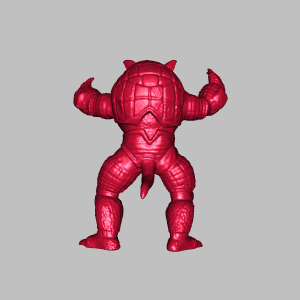 |
| SaveSceneToFile | Save a vtkCamera's state in a file and restore it. |  |
| SelectExamples | Given a VTK Class and a language, select the matching examples. | |
| Screenshot | 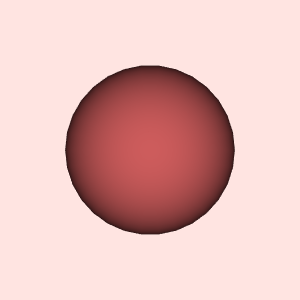 | |
| ShareCamera | Share a camera between multiple renderers. |  |
| VTKImportsForPython | Generate import statements for the VTK classes in your Python code. | |
| VTKModulesForCxx | Generate a find_package(VTK COMPONENTS ...) command for CMake. | |
| VTKWithNumpy |  | |
| Variant |
Arrays
| Example Name | Description | Image |
|---|---|---|
| GetValues | ||
| RenameArray |
Events
Math Operations
Graphs
| Example Name | Description | Image |
|---|---|---|
| ColorEdges | Color edges. |  |
| ColorVertexLabels | Set the color of vertex labels. |  |
| ColorVerticesLookupTable | Color vertices. |  |
| ConstructGraph | Construct a graph. |  |
| ConstructTree | Construct a tree. |  |
| CreateTree | Create a tree and label the vertices and edges. |  |
| EdgeWeights | 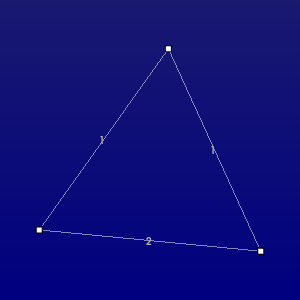 | |
| GraphToPolyData | Convert a graph to a PolyData. |  |
| LabelVerticesAndEdges | Label vertices and edges. |  |
| NOVCAGraph | ||
| RandomGraphSource | Create a random graph. | 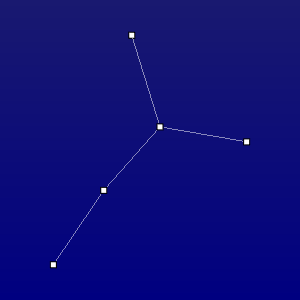 |
| ScaleVertices | Size/scale vertices based on a data array. | 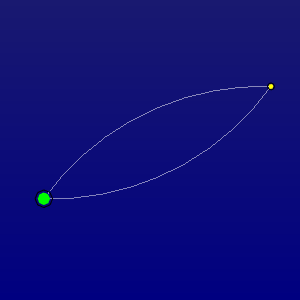 |
| SelectedVerticesAndEdges |  | |
| SideBySideGraphs | Display two graphs side by side. |  |
| VisualizeDirectedGraph | Visualize a directed graph. |  |
| VisualizeGraph |  | |
Graph Conversions
Data Structures
Timing Demonstrations
KD-Tree
Oriented Bounding Box (OBB) Tree
Octree
Modified BSP Tree
HyperTreeGrid
| Example Name | Description | Image |
|---|---|---|
| HyperTreeGridSource | Create a vtkHyperTreeGrid. | 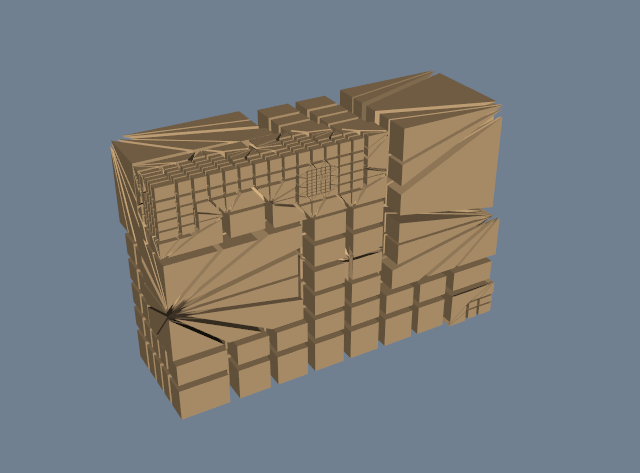 |
VTK Concepts
Rendering
| Example Name | Description | Image |
|---|---|---|
| AmbientSpheres | Demonstrates the effect of ambient lighting on spheres. |  |
| CameraBlur | Example of a scene rendered with focal depth. | 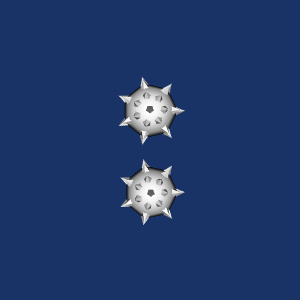 |
| ColoredSphere | A simple sphere. |  |
| Cone3 | Four frames of output, based on the VTK example Cone3.py. |  |
| Cone4 | Modifying properties and transformation matrix based on the VTK example Cone4.py. |  |
| DiffuseSpheres | Demonstrates the effect of diffuse lighting on spheres. |  |
| FlatVersusGouraud | Flat and Gouraud shading. Different shading methods can dramatically improve the look of an object represented with polygons. On the top, flat shading uses a constant surface normal across each polygon. On the bottom, Gouraud shading interpolates normals from polygon vertices to give a smoother look. |  |
| GradientBackground | Demonstrates the background shading options. |  |
| LayeredActors | Demonstrates the use of two linked renderers. The orientation of objects in the non active layer is linked to those in the active layer. |  |
| Mace | An example of multiple inputs and outputs. |  |
| Model | Illustrative diagram of graphics objects. |  |
| MotionBlur | Example of motion blur. |  |
| OutlineGlowPass | Demonstrates how to render a object in a scene with a glowing outline. |  |
| PBR_Anisotropy | Render spheres with different anisotropy values. | 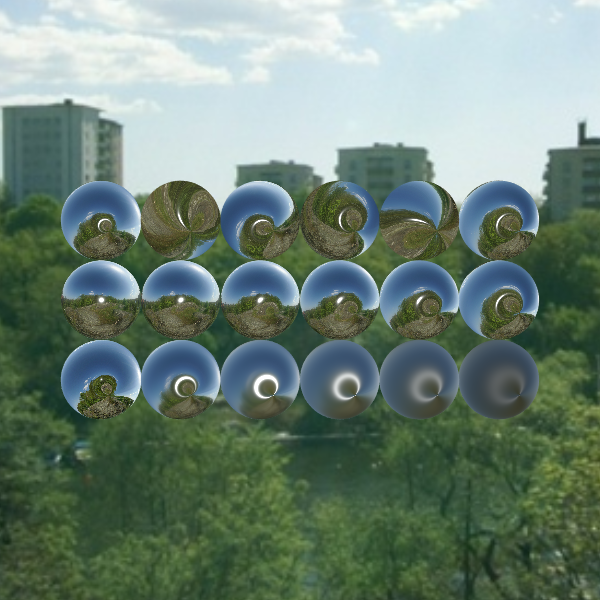 |
| PBR_Clear_Coat | Render a cube with custom texture mapping and a coat normal texture. | |
| PBR_Edge_Tint | Render spheres with different edge colors using a skybox as image based lighting. | 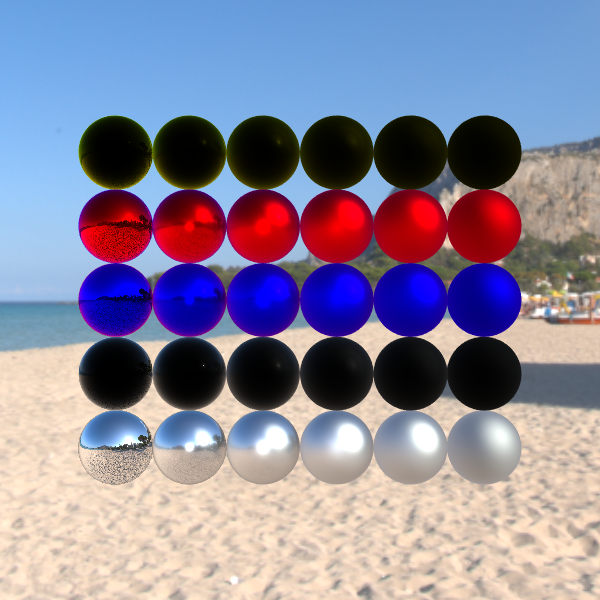 |
| PBR_HDR_Environment | Renders spheres with different materials using a skybox as image based lighting. |  |
| PBR_Mapping | Render a cube with custom texture mapping. |  |
| PBR_Materials | Renders spheres with different materials using a skybox as image based lighting. |  |
| PBR_Materials_Coat | Render spheres with different coat materials using a skybox as image based lighting. |  |
| PBR_Skybox | Demonstrates physically based rendering, a skybox and image based lighting. | 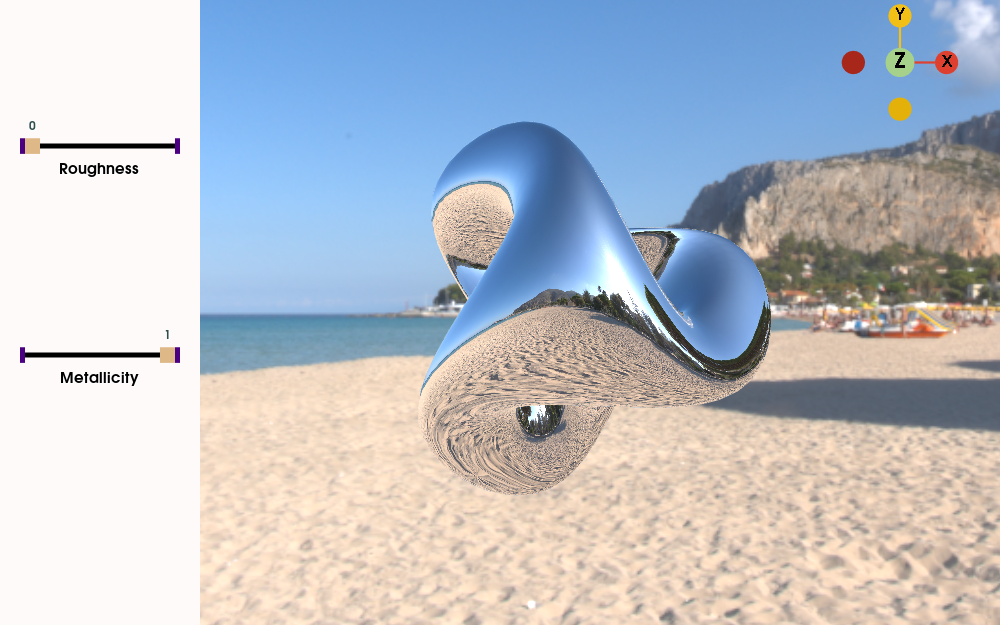 |
| PBR_Skybox_Texturing | Demonstrates physically based rendering, a skybox, image based lighting and texturing. | 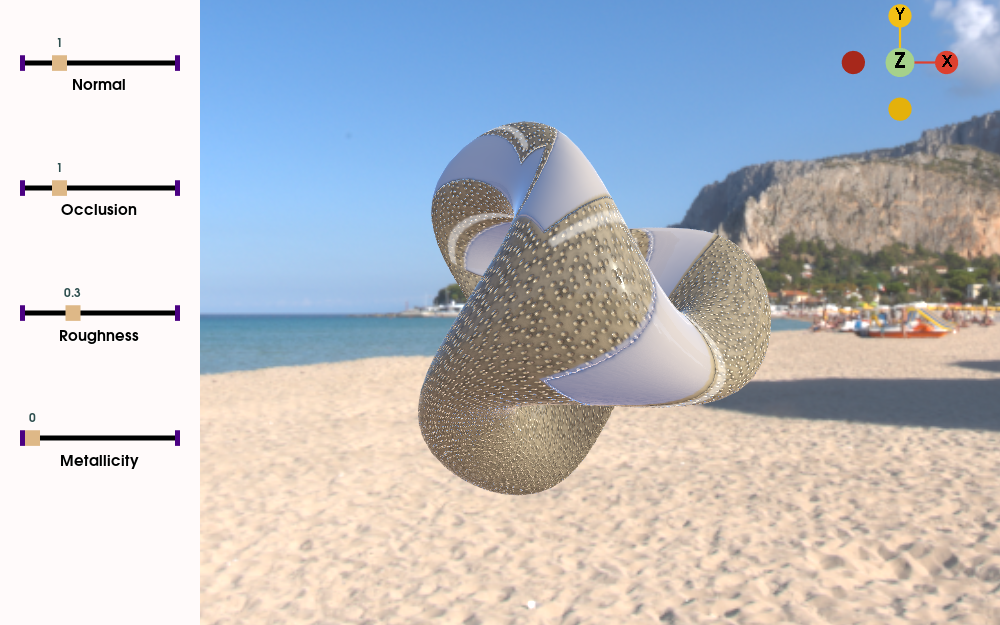 |
| PBR_Skybox_Anisotropy | Demonstrates physically based rendering, a skybox, image based lighting, and anisotropic texturing. | 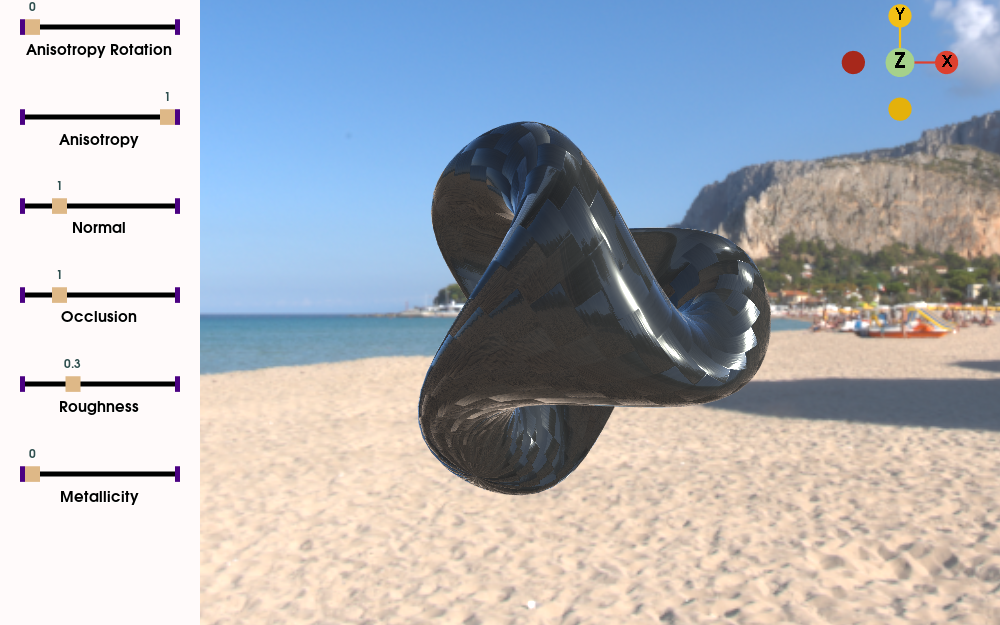 |
| Rainbow | Use and manipulation of vtkLookupTables. |  |
| Rotations | Rotations of a cow about her axes. |  |
| RotationsA | Perform six rotations of a cow about her x-axis (Figure 3-31a). |  |
| RotationsB | Perform six rotations of a cow about her y-axis (Figure 3-31b). | 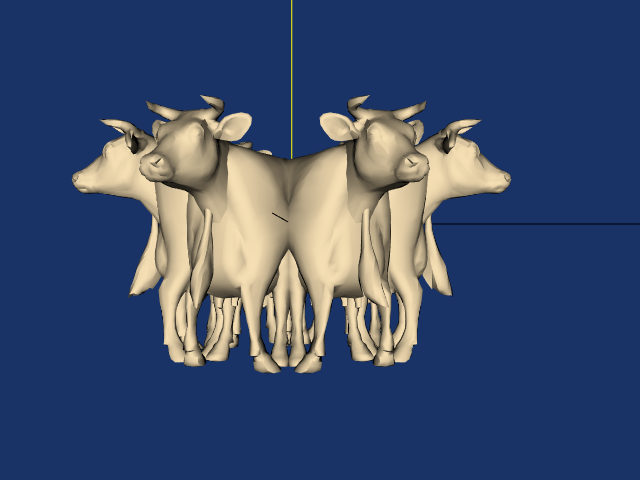 |
| RotationsC | Perform six rotations of a cow about her z-axis (Figure 3-31c). |  |
| RotationsD | First a rotation of a cow about her x-axis, then six rotations about her y-axis (Figure 3-31d). |  |
| Shadows | Draw model with shadows. |  |
| SpecularSpheres | Demonstrates the effect of specular lighting on spheres. |  |
| StippledLine | Draw a stippled line. |  |
| StripFran | Triangle strip examples. (a) Structured triangle mesh consisting of 134 strips each of 390 triangles. (b) Unstructured triangle mesh consisting of 2227 strips of average length 3.94, longest strip 101 triangles. Images are generated by displaying every other triangle strip. |  |
| TransformSphere | The addition of a transform filter to ColoredSphere. | |
| TransparentBackground | Demonstrates the use of two renderers. Notice that the second (and subsequent) renderers will have a transparent background. | |
| WalkCow | This generates Figs. 3-32, 3-33 found in VTKTextbook.pdf. | 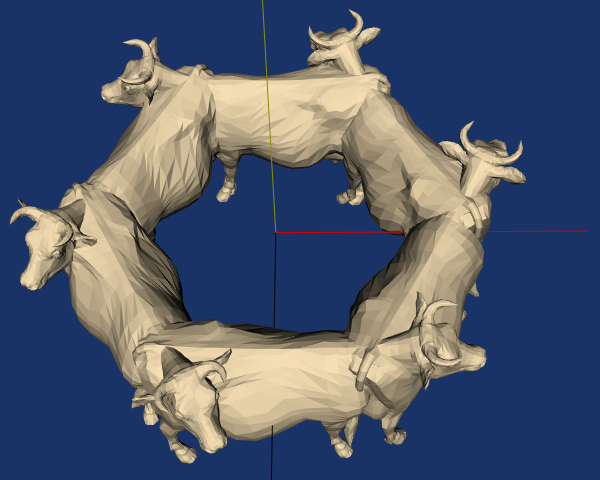 |
| WalkCowA | This generates Fig. 3-33a found in VTKTextbook.pdf. |  |
| WalkCowB | This generates Fig. 3-33b found in VTKTextbook.pdf. | 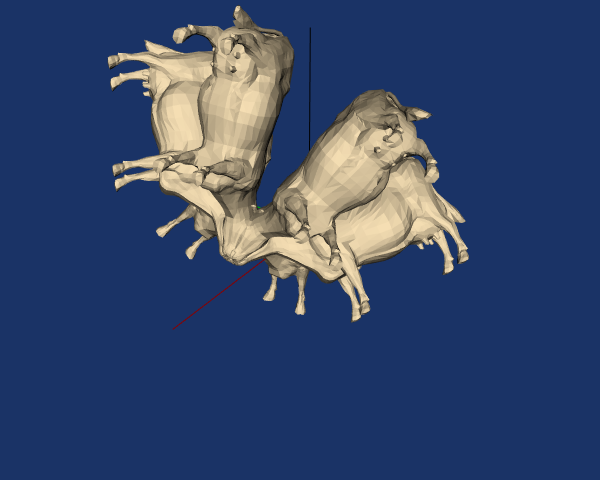 |
Lighting
| Example Name | Description | Image |
|---|---|---|
| ShadowsLightsDemo | Show lights casting shadows. |  |
Texture Mapping
| Example Name | Description | Image |
|---|---|---|
| AnimateVectors | One frame from a vector field animation using texture maps. |  |
| TextureCutQuadric | Cut a quadric with boolean textures. | 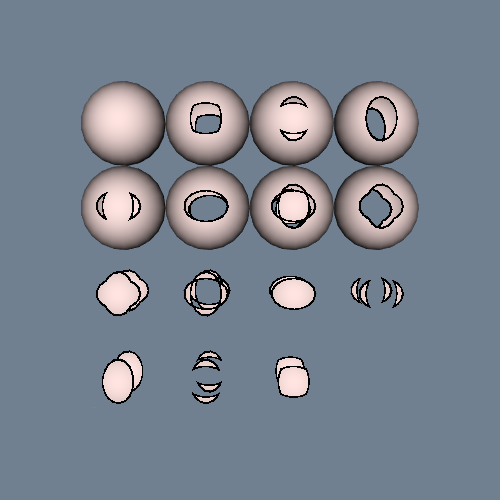 |
| TextureCutSphere | Examples of texture thresholding. (b) Boolean combination of two planes to cut nested spheres. |  |
| TexturePlane | Example of texture mapping. |  |
| TextureThreshold | Demonstrate the use of scalar thresholds to show values of flow density on three planes. |  |
Tutorial
If you are new to VTK then these tutorials will help to get you started.
| Tutorial | Description | Image |
|---|---|---|
| Step 1 | Create a cone, render it and rotate it through 360°. | 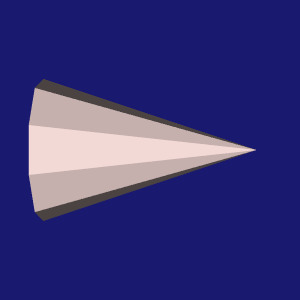 |
| Step 2 | Adding an observer. |  |
| Step 3 | Using multiple renderers within a render window. |  |
| Step 4 | The creation of multiple actors and the manipulation of their properties and transformations. |  |
| Step 5 | Introducing the concept of interaction. |  |
| Step 6 | Using a 3D widget. |  |
Visualization
See this tutorial for a brief explanation of the VTK terminology of mappers, actors, etc.
| Example Name | Description | Image |
|---|---|---|
| AlphaFrequency | Linearly extrude fonts to show letter frequencies in text. | 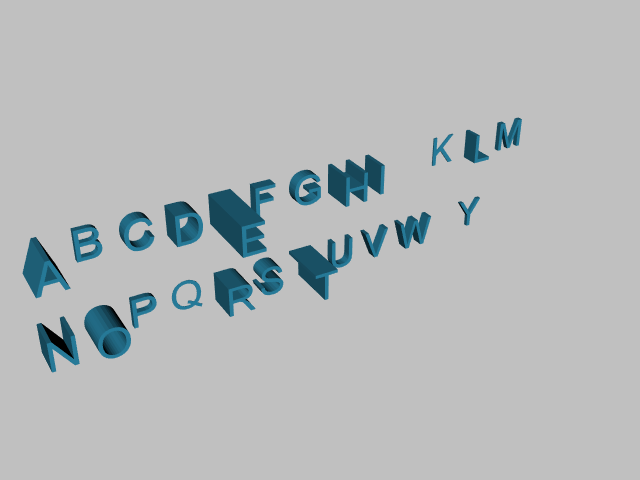 |
| AnatomicalOrientation | Show a labelled set of anatomical planes transecting a human figure. |  |
| AnnotatedCubeActor | Annotated cube. |  |
| AssignCellColorsFromLUT | Demonstrates how to assign colors to cells in a vtkPolyData structure using lookup tables. | 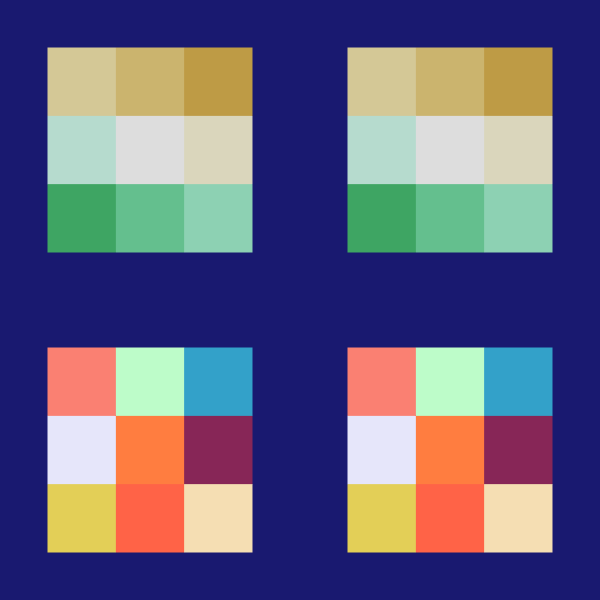 |
| BillboardTextActor3D | Label points with billboards. | 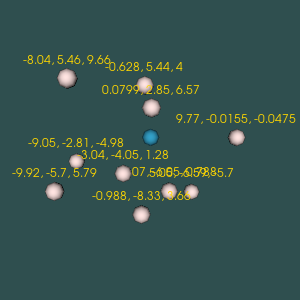 |
| BlobbyLogo | A logo created with vtkImplicitModeller. |  |
| Blow | Ten frames from a blow molding finite element analysis. |  |
| BluntStreamlines | Demonstrates airflow around a blunt fin using streamlines. | 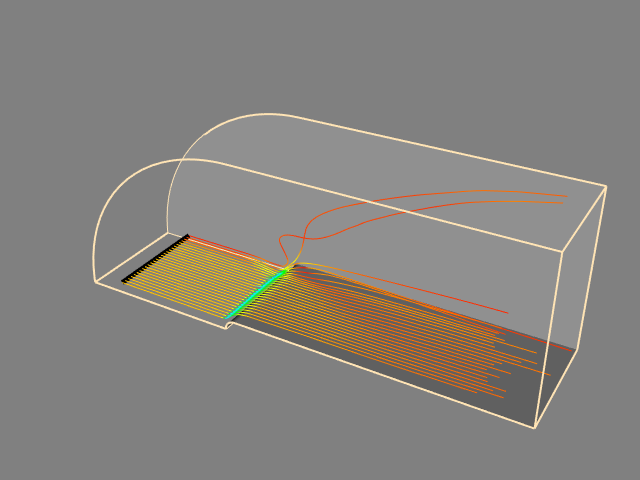 |
| Camera | Positioning and aiming the camera. |  |
| CameraModel1 | Illustrate camera movement around the focal point. | 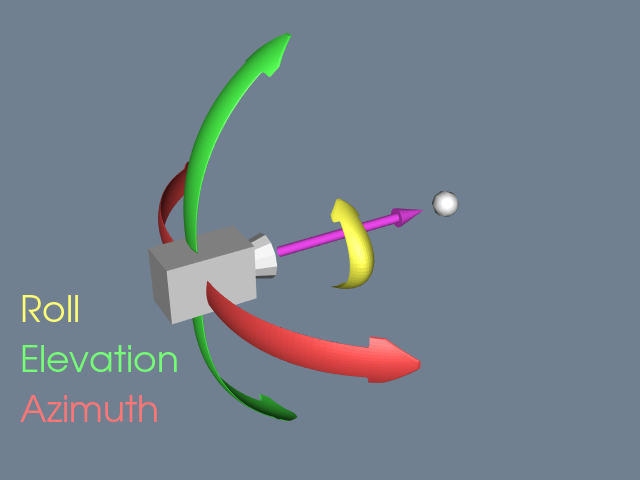 |
| CameraModel2 | camera movement centered at the camera position. |  |
| CarotidFlow | Visualizing blood flow in the human carotid arteries. Streamtubes of flow velocity are generated. |  |
| CarotidFlowGlyphs | Visualizing blood flow in human carotid arteries. Cone glyphs indicate flow direction and magnitude. |  |
| ClampGlyphSizes | Use vtkGlyph3D with ClampingOn to limit glyph sizes |  |
| ClipSphereCylinder | A plane clipped with a sphere and an ellipse. The two transforms place each implicit function into the appropriate position. Two outputs are generated by the clipper. | 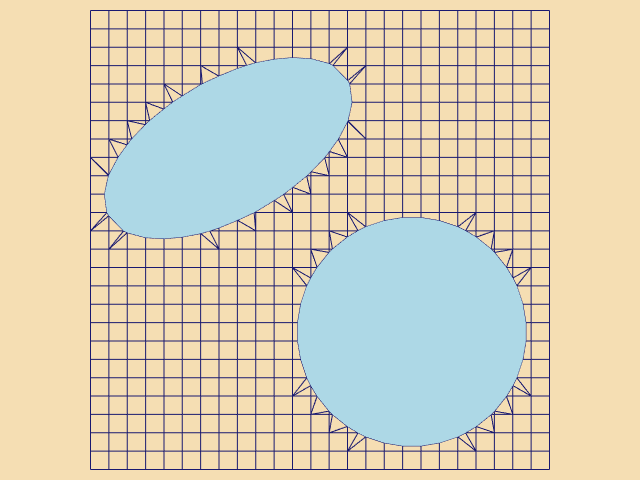 |
| CollisionDetection | Collison between two spheres. |  |
| ColorAnActor | Colour the actor. |  |
| ColorSeriesPatches | Creates a HTML file called VTKColorSeriesPatches | |
| ColoredAnnotatedCube | How to color the individual faces of an annotated cube. |  |
| CombustorIsosurface | Generate an isosurface of constant flow density. |  |
| ComplexV | ComplexV from the VTK Textbook. | 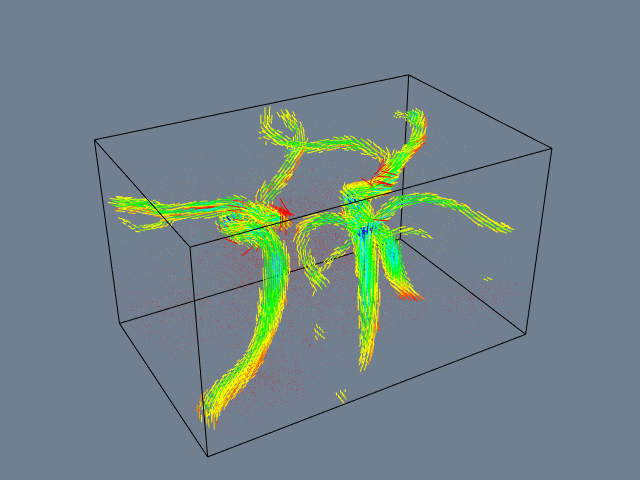 |
| ContourQuadric | Contouring a quadric function. |  |
| CreateBFont | A scanned image clipped with a scalar value of 1/2 its maximum intensity produces a mixture of quadrilaterals and triangles. |  |
| CreateColorSeriesDemo | Create a custom vtkColorSeries. | 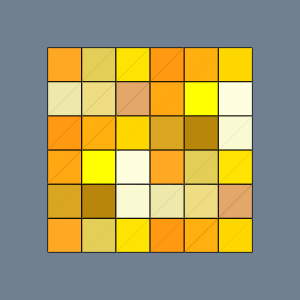 |
| CubeAxesActor | Display three orthogonal axes with labels.FWorking with 3D |  |
| CurvatureBandsWithGlyphs | Demonstrates the coloring of a surface by partitioning the gaussian curvature of a surface into bands and using arrows to display the normals on the surface. |  |
| CutStructuredGrid | Cut through structured grid with plane. The cut plane is shown solid shaded. A computational plane of constant k value is shown in wireframe for comparison. The colors correspond to flow density. Cutting surfaces are not necessarily planes: implicit functions such as spheres, cylinders, and quadrics can also be used. |  |
| Cutter | How to use vtkCutter by cutting through a cube. |  |
| DataSetSurface | Cutting a hexahedron with a plane. The red line on the surface shows the cut. |  |
| DecimateFran | Examples of decimation algorithm. (a) Decimation of laser digitizer data. |  |
| DecimateHawaii | Examples of decimation algorithm. (b) Decimation of terrain data. |  |
| DisplacementPlot | Show modal lines for a vibrating beam. |  |
| DisplayCoordinateAxes | Display coordinate axes. | 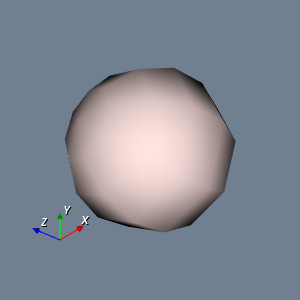 |
| DisplayQuadricSurfaces | Create and display a quadratic surface. |  |
| ElevationBandsWithGlyphs | Demonstrates the coloring of a surface by partitioning the elevation into bands and using arrows to display the normals on the surface. |  |
| ExponentialCosine | Carpet plots. Visualization of an exponential cosine function. Function values are indicated by surface displacement. Colors indicate derivative values. |  |
| FlyingHeadSlice | Flying edges used to generate contour lines. |  |
| FrogBrain | The frog's brain. Model extracted without smoothing (left) and with smoothing (right). |  |
| FroggieSurface | Construct surfaces from a segmented frog dataset. Up to fifteen different surfaces may be extracted. You can turn on and off surfaces and control the camera position. |  |
| FroggieView | View surfaces of a segmented frog dataset using preprocessed *.vtk tissue files. You can turn on and off surfaces, control their opacity through the use of sliders and control the camera position. |  |
| FrogSlice | Photographic slice of frog (upper left), segmented frog (upper right) and composite of photo and segmentation (bottom). The purple color represents the stomach and the kidneys are yellow. | 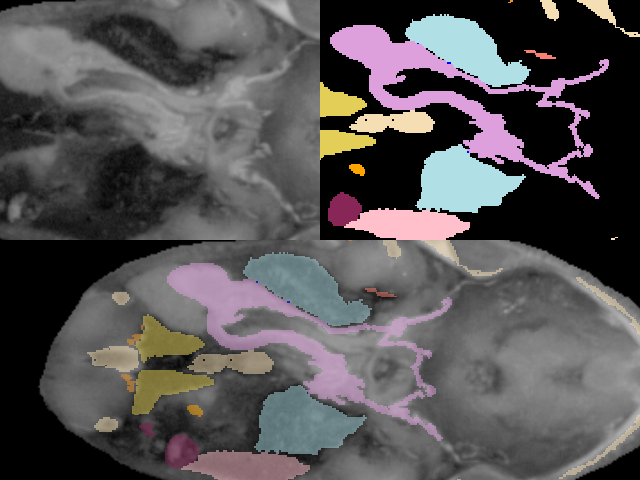 |
| GlyphTable | Vary the shapes of glyphed points using a glyph table | 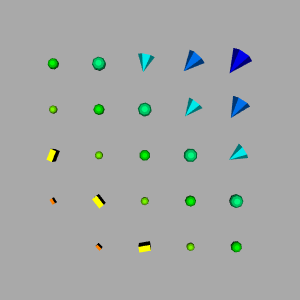 |
| Hanoi | Towers of Hanoi. |  |
| HanoiInitial | Towers of Hanoi - Initial configuration. | 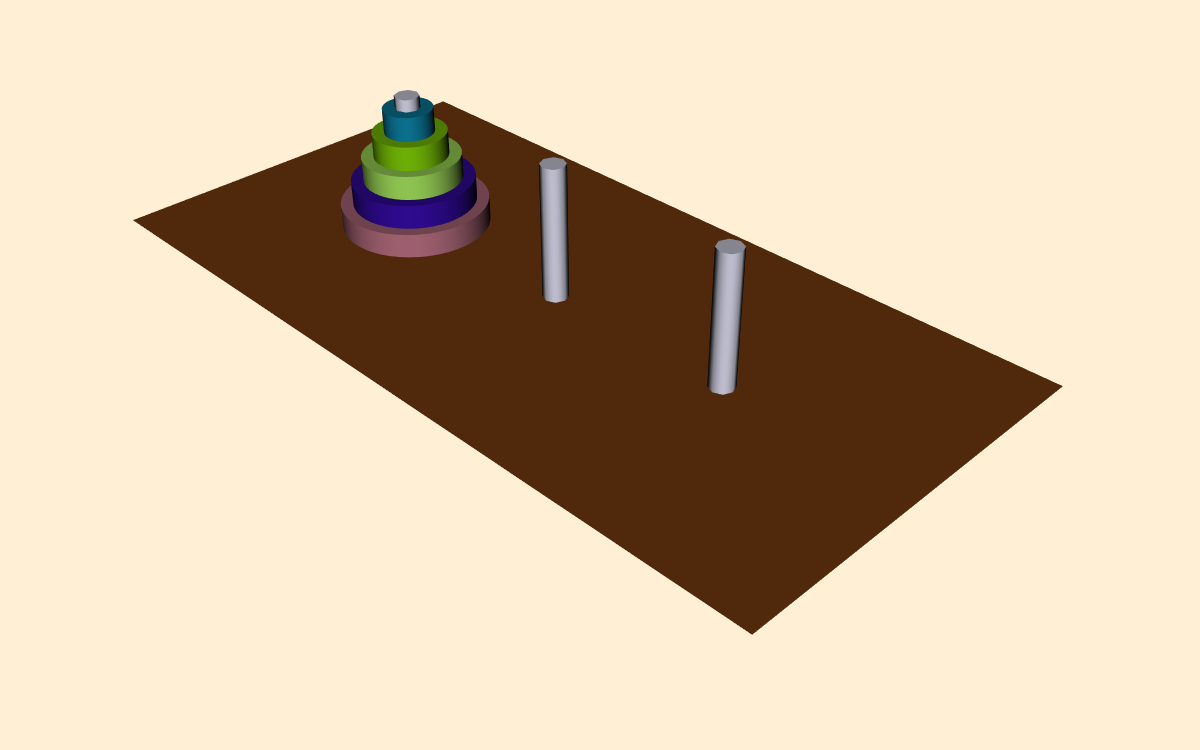 |
| HanoiIntermediate | Towers of Hanoi - Intermediate configuration. |  |
| HardwareSelector |  | |
| Hawaii | Visualize elevations by coloring the scalar values with a lookup table. | 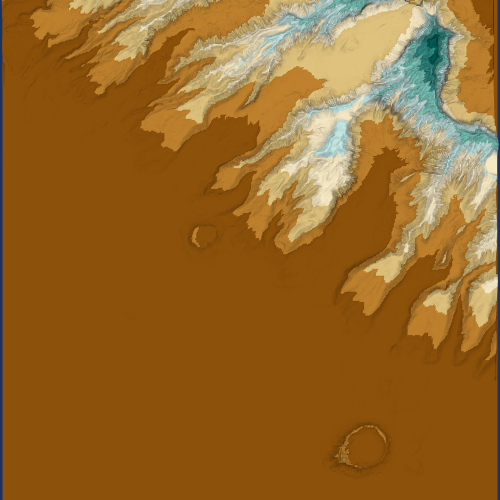 |
| HeadBone | Marching cubes surface of human bone. |  |
| HeadSlice | Marching squares used to generate contour lines. | 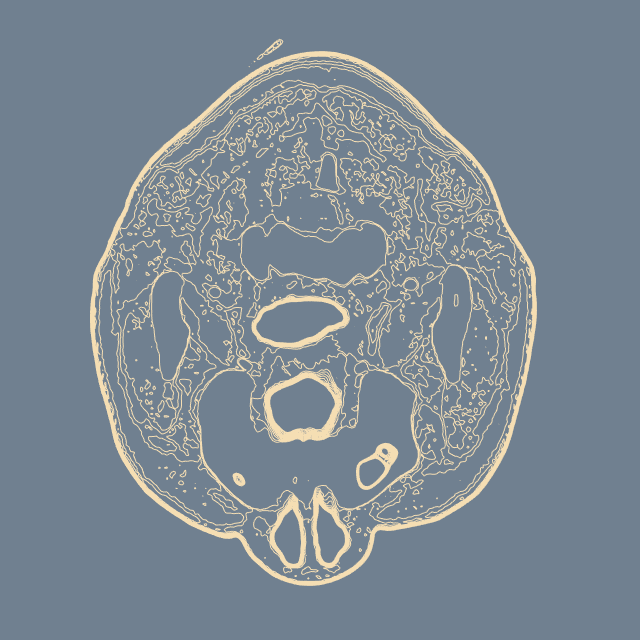 |
| HyperStreamline | Example of hyperstreamlines, the four hyperstreamlines shown are integrated along the minor principle stress axis. A plane (colored with a different lookup table) is also shown. |  |
| IronIsoSurface | Marching cubes surface of iron-protein. |  |
| IsosurfaceSampling | Demonstrates how to create point data on an isosurface. | 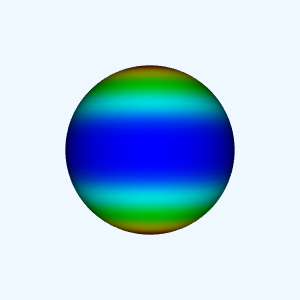 |
| Kitchen | Demonstrates stream tracing in a kitchen. |  |
| KochSnowflake | This example draws a Koch snowflake fractal using recursive functions and some of the convenient tools in the toolkit. |  |
| LOx | Streamtubes created by using the computational grid just in front of the post as a source for seeds. |  |
| LOxGrid | Portion of computational grid for the LOx post. | 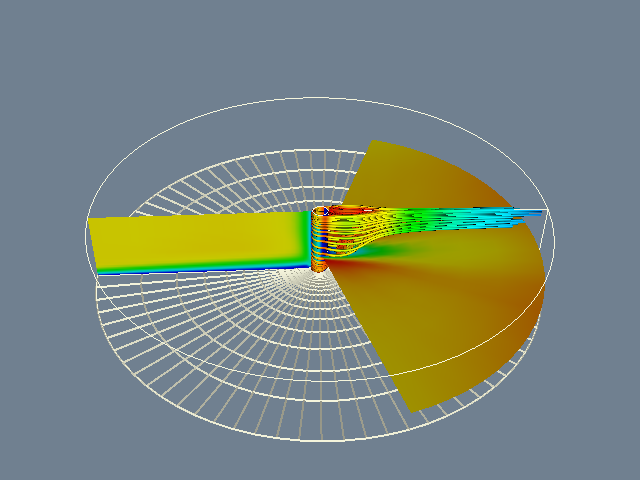 |
| LOxSeeds | Streamlines seeded with spherical cloud of points. Four separate cloud positions are shown. |  |
| LoopShrink | A network with a loop. VTK 5.0 does not allow you to execute a looping visualization network; this was possible in previous versions of VTK. | 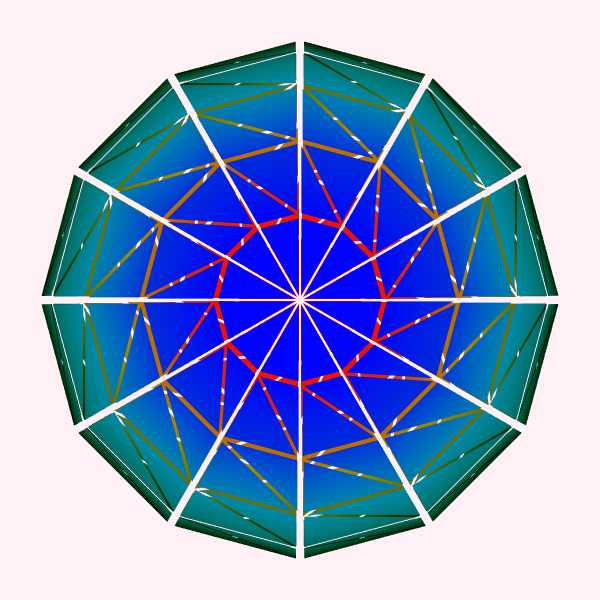 |
| Motor | Texture cut used to reveal internal structure of a motor. Two cut planes are used in combination with transparent texture. |  |
| NamedColorPatches | Creates a HTML file called VTKNamedColorPatches | |
| NamedColors | Demonstrates how to use the vtkNamedColors class. |  |
| NormalsDemo | Demo different options to generate normals. |  |
| Office | Using random point seeds to create streamlines. |  |
| OfficeA | Corresponds to Fig 9-47(a) in the VTK textbook. |  |
| OfficeTube | The stream polygon. Sweeping a polygon to form a tube. |  |
| OrientedGlyphs | Create oriented glyphs from vector data. |  |
| PineRootConnectivity | Applying the connectivity filter to remove noisy isosurfaces. |  |
| PineRootConnectivityA | The isosurface, with no connectivity filter applied. |  |
| PineRootDecimation | Applying the decimation and connectivity filters to remove noisy isosurfaces and reduce data size. |  |
| PlateVibration | Demonstrates the motion of a vibrating beam. |  |
| PointDataSubdivision | Vary the shapes of glyphed points using a programmable glyph filter |  |
| PointSize |  | |
| ProbeCombustor | Probing data in a combustor. Probes are regular arrays of 50 by 50 points that are then passed through a contouring filter. | 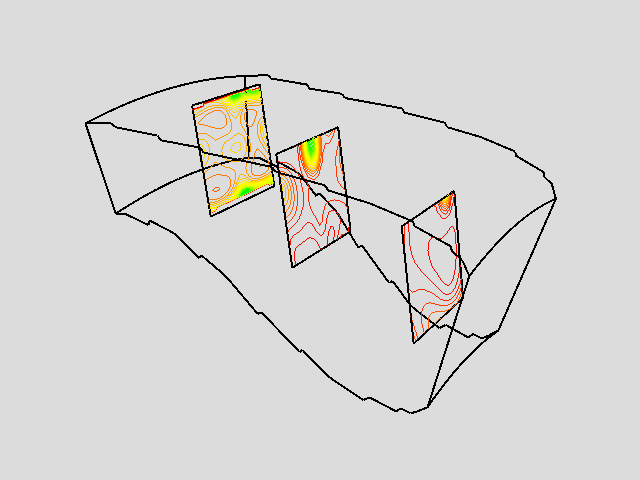 |
| ProgrammableGlyphFilter | Generate a custom glyph at each point. |  |
| ProgrammableGlyphs | Generate programmable glyphs. |  |
| PseudoVolumeRendering | Here we use 100 cut planes, each with an opacity of 0.05. They are then rendered back-to-front to simulate volume rendering. | 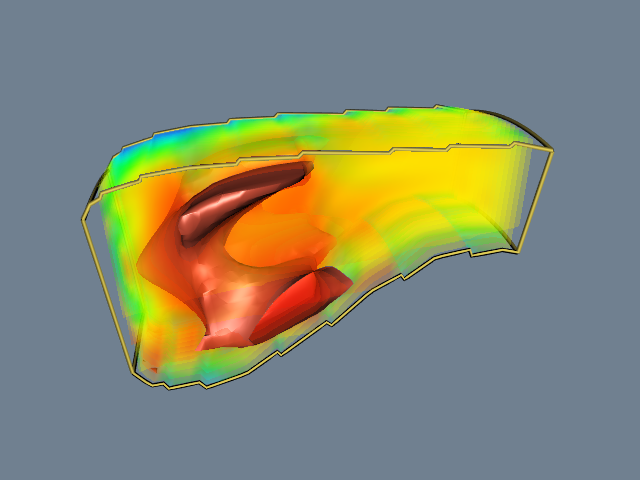 |
| QuadricVisualization | Visualizing a quadric function. |  |
| SingleSplat | Elliptical splatting. (a) Single elliptical splat with eccentricity E=10. Cone shows orientation of vector. | 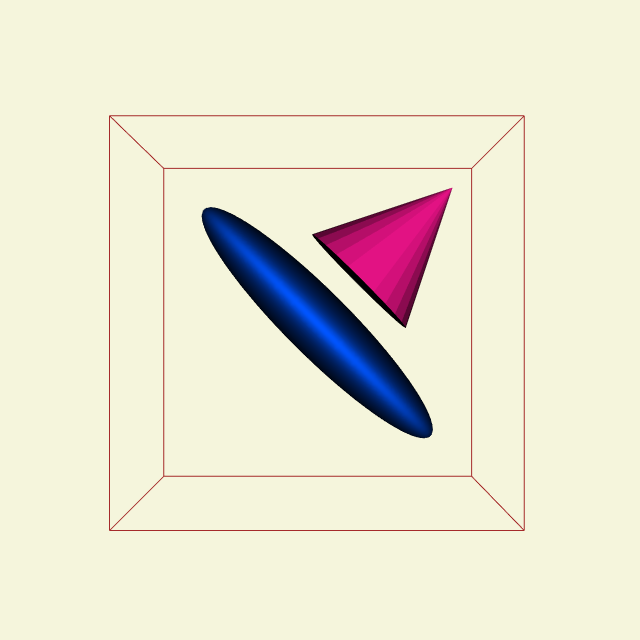 |
| SphereTexture | Apply an ImageData texture to an sphere |  |
| SpikeFran | Glyphs indicate surface normals on model of human face. Glyph positions are randomly selected. | 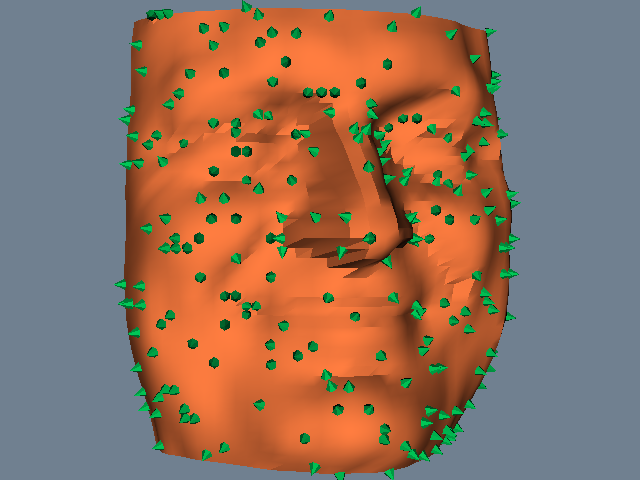 |
| SplatFace | Elliptical splatting. (b) Surface reconstructed using elliptical splats into 100^3 volume followed by isosurface extraction. Points regularly subsampled and overlaid on original mesh. |  |
| Stocks | Two views from the stock visualization script. The top shows closing price over time; the bottom shows volume over time. |  |
| StreamLines | Seed streamlines with vectors from a structured grid. |  |
| StreamlinesWithLineWidget | Using the vtkLineWidget to produce streamlines in the combustor dataset. The StartInteractionEvent turns the visibility of the streamlines on; the InteractionEvent causes the streamlines to regenerate themselves. |  |
| TensorAxes | Display the scaled and oriented principal axes of the stress tensor. | 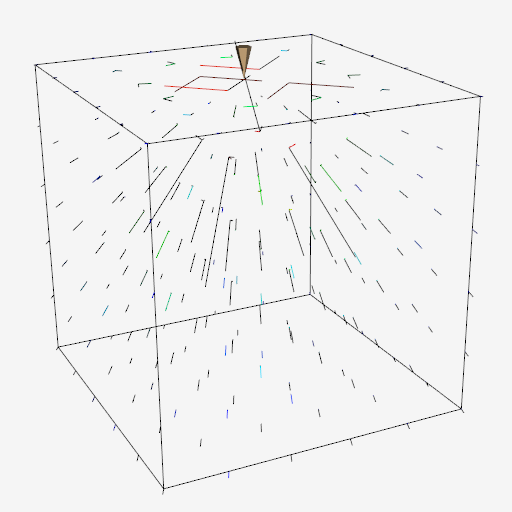 |
| TensorEllipsoids | Display the scaled and oriented principal axes as tensor ellipsoids representing the stress tensor. |  |
| TextSource |  | |
| VectorText | Display high resolution text. |  |
| VelocityProfile | Warping the geometry of three planes to show flow momentum. |  |
| WarpCombustor | Carpet plots of combustor flow energy in a structured grid. Colors and plane displacement represent energy values. |  |
| WindowTitle |  | |
Working with vtkImageData
| Example Name | Description | Image |
|---|---|---|
| ImageDataGeometryFilter | Convert a vtkImageData to a vtkPolyData. |  |
| ImageNormalize | Normalize an image. |  |
| SumVTKImages | A function to simplify the summing of images, where you can pass a list of images and weights. | |
| WriteReadVtkImageData | Generate, edit and read out vtk image data. |  |
Volume Rendering
| Example Name | Description | Image |
|---|---|---|
| SimpleRayCast | Volume rendering of a high potential iron protein. |  |
User Interaction
| Example Name | Description | Image |
|---|---|---|
| CallBack | Setting up a callback with client data. Two different methods are demonstrated. |  |
| CellPicking | Cell Picking. |  |
| HighlightPickedActor | Pick and highlight an actor based on mouse clicks. |  |
| HighlightWithSilhouette | Highlight a picked actor by adding a silhouette. |  |
| InteractorStyleTrackballActor | 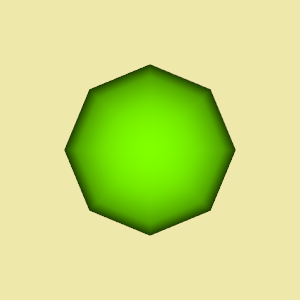 | |
| InteractorStyleTrackballCamera |  | |
| MouseEvents | Subclass the interactor style. |  |
| MouseEventsObserver | Use an observer. |  |
Working with Images
| Example Name | Description | Image |
|---|---|---|
| Actor2D | 2D actor and mapper. |  |
| BackgroundImage | Display an image as the "background" of a scene, and render a superquadric in front of it. | 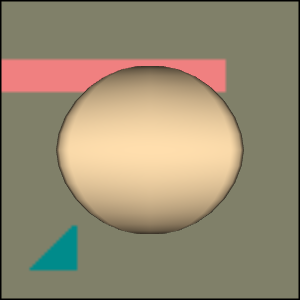 |
| Cast | Cast an image to a different type. | 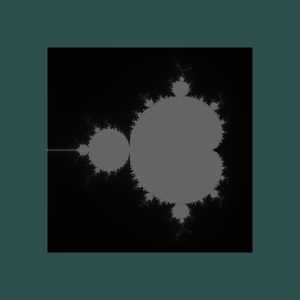 |
Image Processing
| Example Name | Description | Image |
|---|---|---|
| Attenuation | This MRI image illustrates attenuation that can occur due to sensor position. The artifact is removed by dividing by the attenuation profile determined manually. |  |
| EnhanceEdges | High-pass filters can extract and enhance edges in an image. Subtraction of the Laplacian (middle) from the original image (left) results in edge enhancement or a sharpening operation (right). |  |
| GaussianSmooth | Low-pass filters can be implemented as convolution with a Gaussian kernel. | 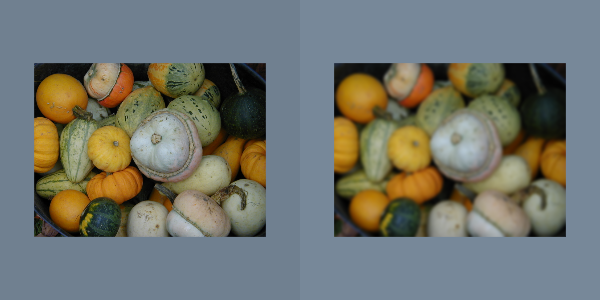 |
| HybridMedianComparison | Comparison of median and hybrid-median filters. The hybrid filter preserves corners and thin lines, better than the median filter. |  |
| IdealHighPass | This figure shows two high-pass filters in the frequency domain. The Butterworth high-pass filter has a gradual attenuation that avoids ringing produced by the ideal high-pass filter with an abrupt transition. |  |
| ImageGradient | Create an imaging pipeline to visualize gradient information. | 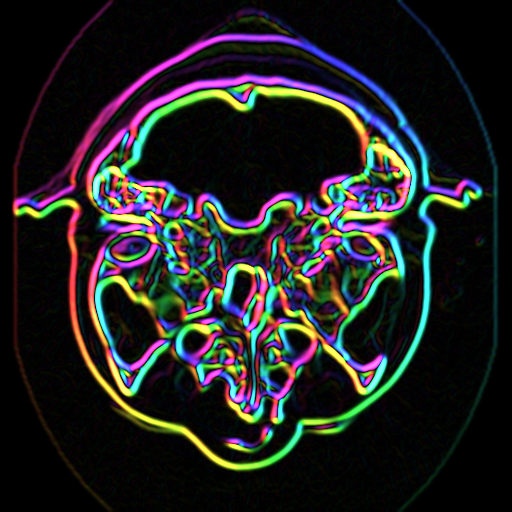 |
| ImageWarp | Combine the imaging and visualization pipelines to deform an image in the z-direction. The vtkMergeFilter is used to combine the warped surface with the original color data. | 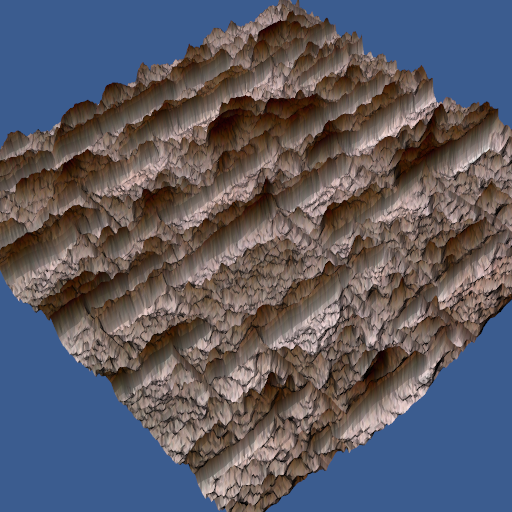 |
| IsoSubsample | This figure demonstrates aliasing that occurs when a high-frequency signal is subsampled. High frequencies appear as low frequency artifacts. The left image is an isosurface of a skull after subsampling. The right image used a low-pass filter before subsampling to reduce aliasing. |  |
| MedianComparison | Comparison of Gaussian and Median smoothing for reducing low-probability high-amplitude noise. | 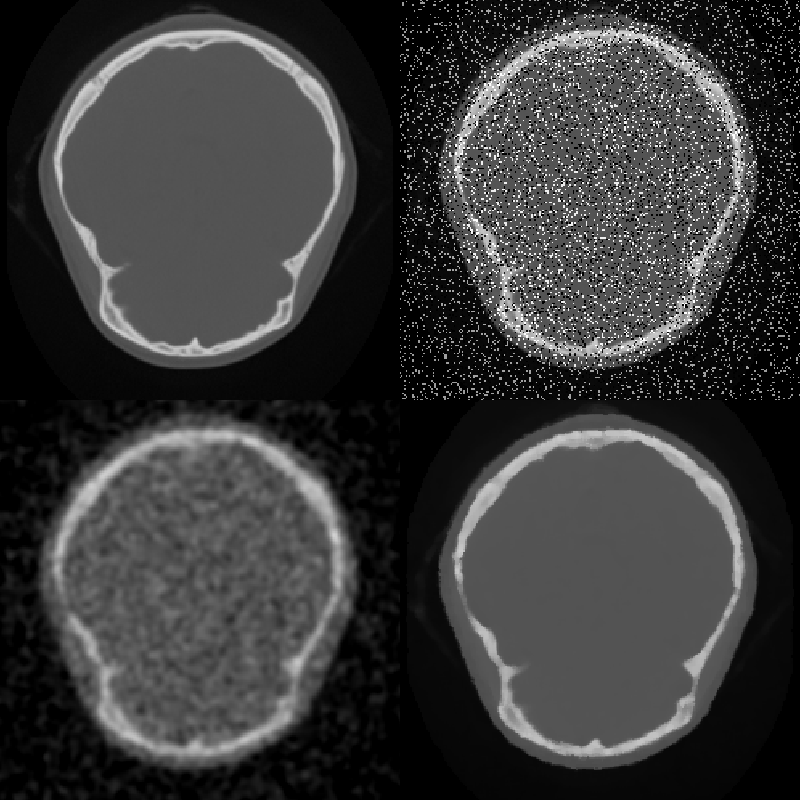 |
| MorphologyComparison | This figure demonstrates various binary filters that can alter the shape of segmented regions. |  |
| Pad | Convolution in frequency space treats the image as a periodic function. A large kernel can pick up features from both sides of the image. The lower-left image has been padded with zeros to eliminate wraparound during convolution. On the right, mirror padding has been used to remove artificial edges introduced by borders. |  |
| VTKSpectrum | The discrete Fourier transform changes an image from the spatial domain into the frequency domain, where each pixel represents a sinusoidal function. This figure shows an image and its power spectrum displayed using a logarithmic transfer function. | 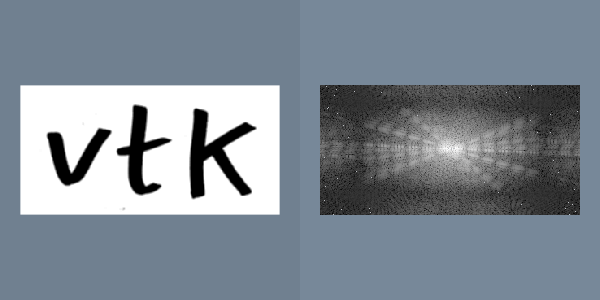 |
Widgets
| Example Name | Description | Image |
|---|---|---|
| BalloonWidget | Uses a vtkBalloonWidget to draw labels when the mouse stays above an actor. | 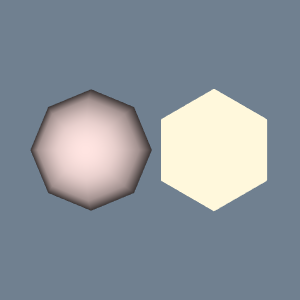 |
| BoxWidget | This 3D widget defines a region of interest that is represented by an arbitrarily oriented hexahedron with interior face angles of 90 degrees (orthogonal faces). The object creates 7 handles that can be moused on and manipulated. | 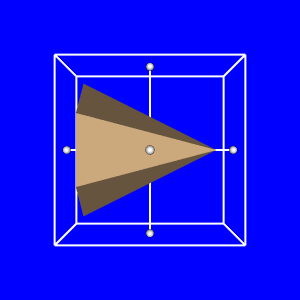 |
| CameraOrientationWidget | Demonstrates a 3D camera orientation widget. |  |
| CompassWidget | Draws an interactive compass. |  |
| ContourWidget | Draw a contour (line) which can be deformed by the user |  |
| ImplicitPlaneWidget2 | Clip polydata with an implicit plane. |  |
| OrientationMarkerWidget | Draws two cubes. One of them can be clicked to be rotated, and will rotate the second one. The second one has annotations on it, and can also be moved. |  |
| OrientationMarkerWidget1 | Display a polydata as an orientation icon. | 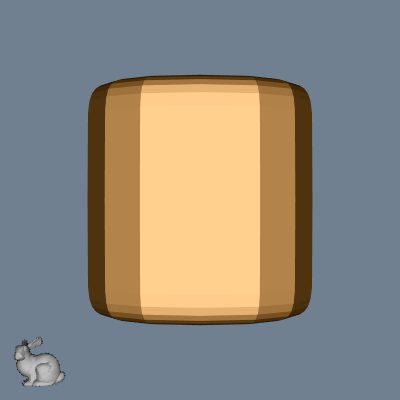 |
| ScalarBarWidget | The ScalarBarWidget displays a scalar bar that is movable and changes orientation automatically when close to the borders of the image. It needs a ScalarBarActor |  |
| SphereWidget | This 3D widget defines a sphere that can be interactively placed in a scene. |  |
| SplineWidget | This example shows how to use vtkSplineWidget with a callback being used to get the length of the spline widget. |  |
| TextWidget | Annotate a VTK image with movable text |  |
Plotting
| Example Name | Description | Image |
|---|---|---|
| MultiplePlots | Display multiple plots by using viewports in a single render window. |  |
| ScatterPlot | Scatter plot. |  |
| SpiderPlot | Spider plot. | 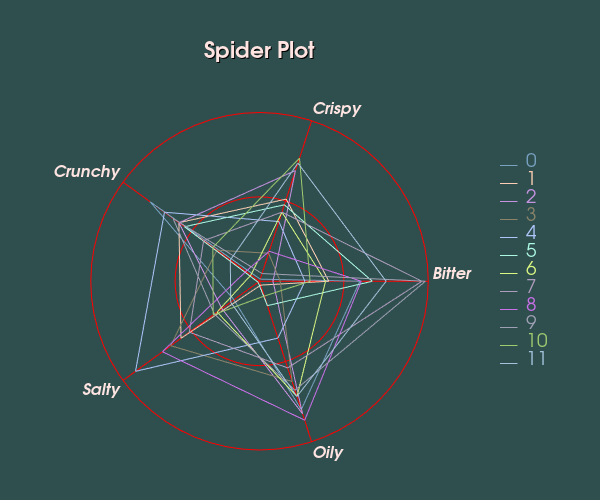 |
| SurfacePlot | Surface plot. |  |
Animation
| Example Name | Description | Image |
|---|---|---|
| Animation | Move a sphere across a scene. | 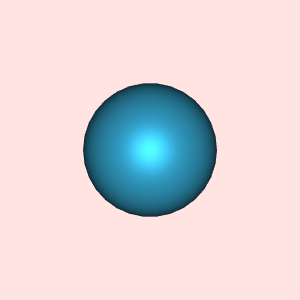 |
Annotation
| Example Name | Description | Image |
|---|---|---|
| MultiLineText | Display multiline text. | 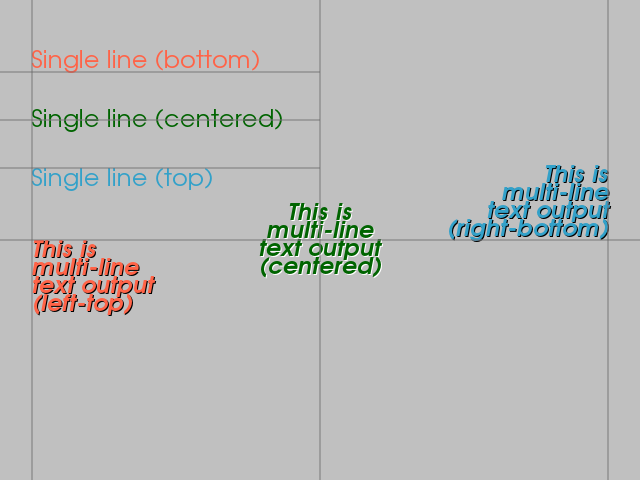 |
| TextOrigin | This example demonstrates the use of vtkVectorText and vtkFollower. vtkVectorText is used to create 3D annotation. |  |
InfoVis
| Example Name | Description | Image |
|---|---|---|
| ParallelCoordinatesExtraction | Extract data based on a selection in a Parallel Coordinates View |  |
| SelectedGraphIDs | Callback on vtkAnnotationLink in a Graph Layout View when selection is changed |  |
PyQt
| Example Name | Description | Image |
|---|---|---|
| EmbedInPyQt | Shows how to easily embed VTK in PyQt with QVTKRenderWindowInteractor, first example |  |
| EmbedInPyQt2 | Shows how to embed VTK in PyQt with QVTKRenderWindowInteractor, second example | 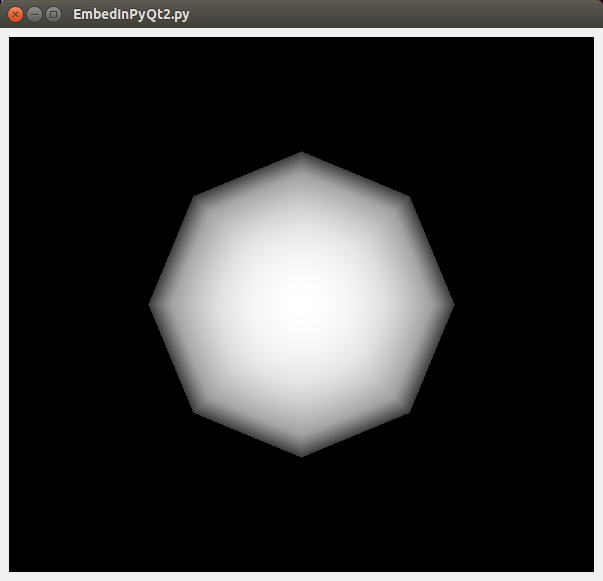 |