RGrid
vtk-examples/Python/RectilinearGrid/RGrid
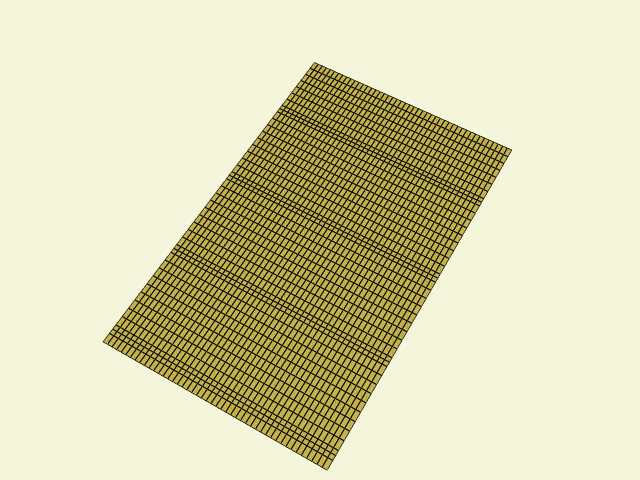
Description
Creating a rectilinear grid dataset. The coordinates along each axis are defined using an instance of vtkDataArray.
Info
See Figure 5-20 in Chapter 5 the VTK Textbook.
Other languages
See (Cxx)
Question
If you have a question about this example, please use the VTK Discourse Forum
Code
RGrid.py
#!/usr/bin/env python

"""
This example shows how to create a rectilinear grid.
"""

# noinspection PyUnresolvedReferences
import vtkmodules.vtkInteractionStyle
# noinspection PyUnresolvedReferences
import vtkmodules.vtkRenderingOpenGL2
from vtkmodules.vtkCommonColor import vtkNamedColors
from vtkmodules.vtkCommonCore import vtkDoubleArray
from vtkmodules.vtkCommonDataModel import vtkRectilinearGrid
from vtkmodules.vtkFiltersGeometry import vtkRectilinearGridGeometryFilter
from vtkmodules.vtkRenderingCore import (
    vtkActor,
    vtkPolyDataMapper,
    vtkRenderWindow,
    vtkRenderWindowInteractor,
    vtkRenderer
)


def main():
    colors = vtkNamedColors()

    x = [-1.22396, -1.17188, -1.11979, -1.06771, -1.01562, -0.963542, -0.911458, -0.859375, -0.807292, -0.755208,
         -0.703125, -0.651042, -0.598958, -0.546875, -0.494792, -0.442708, -0.390625, -0.338542, -0.286458, -0.234375,
         -0.182292, -0.130209, -0.078125, -0.026042, 0.0260415, 0.078125, 0.130208, 0.182291, 0.234375, 0.286458,
         0.338542, 0.390625, 0.442708, 0.494792, 0.546875, 0.598958, 0.651042, 0.703125, 0.755208, 0.807292, 0.859375,
         0.911458, 0.963542, 1.01562, 1.06771, 1.11979, 1.17188]
    y = [-1.25, -1.17188, -1.09375, -1.01562, -0.9375, -0.859375, -0.78125, -0.703125, -0.625, -0.546875, -0.46875,
         -0.390625, -0.3125, -0.234375, -0.15625, -0.078125, 0, 0.078125, 0.15625, 0.234375, 0.3125, 0.390625, 0.46875,
         0.546875, 0.625, 0.703125, 0.78125, 0.859375, 0.9375, 1.01562, 1.09375, 1.17188, 1.25]
    z = [0, 0.1, 0.2, 0.3, 0.4, 0.5, 0.6, 0.7, 0.75, 0.8, 0.9, 1, 1.1, 1.2, 1.3, 1.4, 1.5, 1.6, 1.7, 1.75, 1.8, 1.9, 2,
         2.1, 2.2, 2.3, 2.4, 2.5, 2.6, 2.7, 2.75, 2.8, 2.9, 3, 3.1, 3.2, 3.3, 3.4, 3.5, 3.6, 3.7, 3.75, 3.8, 3.9]
    print(len(x), len(y), len(z))

    # Create a rectilinear grid by defining three arrays specifying the
    # coordinates in the x-y-z directions.
    xCoords = vtkDoubleArray()
    for i in range(0, len(x)):
        xCoords.InsertNextValue(x[i])
    yCoords = vtkDoubleArray()
    for i in range(0, len(y)):
        yCoords.InsertNextValue(y[i])
    zCoords = vtkDoubleArray()
    for i in range(0, len(z)):
        zCoords.InsertNextValue(z[i])

    # The coordinates are assigned to the rectilinear grid. Make sure that
    # the number of values in each of the XCoordinates, YCoordinates,
    # and ZCoordinates is equal to what is defined in SetDimensions().
    #
    rgrid = vtkRectilinearGrid()
    rgrid.SetDimensions(len(x), len(y), len(z))
    rgrid.SetXCoordinates(xCoords)
    rgrid.SetYCoordinates(yCoords)
    rgrid.SetZCoordinates(zCoords)

    # Extract a plane from the grid to see what we've got.
    plane = vtkRectilinearGridGeometryFilter()
    plane.SetInputData(rgrid)
    plane.SetExtent(0, len(x) - 1, 16, 16, 0, len(z) - 1)

    rgridMapper = vtkPolyDataMapper()
    rgridMapper.SetInputConnection(plane.GetOutputPort())

    wireActor = vtkActor()
    wireActor.SetMapper(rgridMapper)
    wireActor.GetProperty().SetColor(colors.GetColor3d("Banana"))
    wireActor.GetProperty().EdgeVisibilityOn()

    # Create the usual rendering stuff.
    renderer = vtkRenderer()
    renWin = vtkRenderWindow()
    renWin.AddRenderer(renderer)
    iren = vtkRenderWindowInteractor()
    iren.SetRenderWindow(renWin)

    renderer.AddActor(wireActor)
    renderer.SetBackground(colors.GetColor3d("Beige"))
    renderer.ResetCamera()
    renderer.GetActiveCamera().Elevation(60.0)
    renderer.GetActiveCamera().Azimuth(30.0)
    renderer.GetActiveCamera().Zoom(1.0)

    renWin.SetSize(640, 480)
    renWin.SetWindowName('RGrid')

    # Interact with the data.
    renWin.Render()
    iren.Start()


if __name__ == "__main__":
    main()