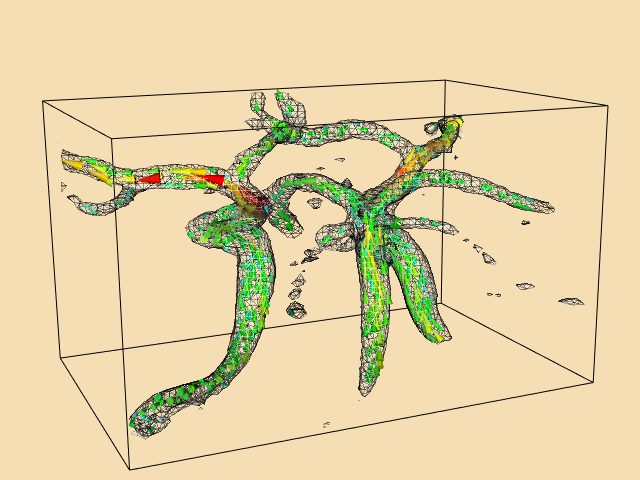
CarotidFlowGlyphs
vtk-examples/Python/VisualizationAlgorithms/CarotidFlowGlyphs
Other languages
See (Cxx)
Question
If you have a question about this example, please use the VTK Discourse Forum
Code
CarotidFlowGlyphs.py
#!/usr/bin/env python

# noinspection PyUnresolvedReferences
import vtkmodules.vtkInteractionStyle
# noinspection PyUnresolvedReferences
import vtkmodules.vtkRenderingOpenGL2
from vtkmodules.vtkCommonColor import vtkNamedColors
from vtkmodules.vtkCommonCore import vtkLookupTable
from vtkmodules.vtkFiltersCore import (
    vtkContourFilter,
    vtkGlyph3D,
    vtkMaskPoints,
    vtkThresholdPoints
)
from vtkmodules.vtkFiltersModeling import vtkOutlineFilter
from vtkmodules.vtkFiltersSources import vtkConeSource
from vtkmodules.vtkIOLegacy import vtkStructuredPointsReader
from vtkmodules.vtkRenderingCore import (
    vtkActor,
    vtkCamera,
    vtkPolyDataMapper,
    vtkRenderWindow,
    vtkRenderWindowInteractor,
    vtkRenderer
)


def main():
    fileName = get_program_parameters()

    colors = vtkNamedColors()

    ren1 = vtkRenderer()

    renWin = vtkRenderWindow()
    renWin.AddRenderer(ren1)

    iren = vtkRenderWindowInteractor()
    iren.SetRenderWindow(renWin)

    # Create the pipeline.
    #
    reader = vtkStructuredPointsReader()
    reader.SetFileName(fileName)

    threshold = vtkThresholdPoints()
    threshold.SetInputConnection(reader.GetOutputPort())
    threshold.ThresholdByUpper(200)

    mask = vtkMaskPoints()
    mask.SetInputConnection(threshold.GetOutputPort())
    mask.SetOnRatio(5)

    cone = vtkConeSource()
    cone.SetResolution(11)
    cone.SetHeight(1)
    cone.SetRadius(0.25)

    cones = vtkGlyph3D()
    cones.SetInputConnection(mask.GetOutputPort())
    cones.SetSourceConnection(cone.GetOutputPort())
    cones.SetScaleFactor(0.4)
    cones.SetScaleModeToScaleByVector()

    lut = vtkLookupTable()
    lut.SetHueRange(.667, 0.0)
    lut.Build()

    scalarRange = [0] * 2
    cones.Update()
    scalarRange[0] = cones.GetOutput().GetPointData().GetScalars().GetRange()[0]
    scalarRange[1] = cones.GetOutput().GetPointData().GetScalars().GetRange()[1]
    print("range: ", scalarRange[0], ", ", scalarRange[1])

    vectorMapper = vtkPolyDataMapper()
    vectorMapper.SetInputConnection(cones.GetOutputPort())
    vectorMapper.SetScalarRange(scalarRange[0], scalarRange[1])
    vectorMapper.SetLookupTable(lut)

    vectorActor = vtkActor()
    vectorActor.SetMapper(vectorMapper)

    # Speed contours.
    iso = vtkContourFilter()
    iso.SetInputConnection(reader.GetOutputPort())
    iso.SetValue(0, 175)

    isoMapper = vtkPolyDataMapper()
    isoMapper.SetInputConnection(iso.GetOutputPort())
    isoMapper.ScalarVisibilityOff()

    isoActor = vtkActor()
    isoActor.SetMapper(isoMapper)
    isoActor.GetProperty().SetRepresentationToWireframe()
    isoActor.GetProperty().SetOpacity(0.25)

    # Outline
    outline = vtkOutlineFilter()
    outline.SetInputConnection(reader.GetOutputPort())

    outlineMapper = vtkPolyDataMapper()
    outlineMapper.SetInputConnection(outline.GetOutputPort())

    outlineActor = vtkActor()
    outlineActor.SetMapper(outlineMapper)
    outlineActor.GetProperty().SetColor(colors.GetColor3d("Black"))

    # Add the actors to the renderer, set the background and size.
    #
    ren1.AddActor(outlineActor)
    ren1.AddActor(vectorActor)
    ren1.AddActor(isoActor)
    ren1.SetBackground(colors.GetColor3d("Wheat"))
    renWin.SetSize(640, 480)
    renWin.SetWindowName('CarotidFlowGlyphs')

    cam1 = vtkCamera()
    cam1.SetClippingRange(17.4043, 870.216)
    cam1.SetFocalPoint(136.71, 104.025, 23)
    cam1.SetPosition(204.747, 258.939, 63.7925)
    cam1.SetViewUp(-0.102647, -0.210897, 0.972104)
    cam1.Zoom(1.2)
    ren1.SetActiveCamera(cam1)

    # Render the image.
    #
    renWin.Render()
    iren.Start()


def get_program_parameters():
    import argparse
    description = 'Visualizing blood flow in human carotid arteries.'
    epilogue = '''
    Cone glyphs indicate flow direction and magnitude.
    '''
    parser = argparse.ArgumentParser(description=description, epilog=epilogue,
                                     formatter_class=argparse.RawDescriptionHelpFormatter)
    parser.add_argument('filename', help='carotid.')
    args = parser.parse_args()
    return args.filename


if __name__ == '__main__':
    main()
