TensorAxes
vtk-examples/Python/VisualizationAlgorithms/TensorAxes
Description
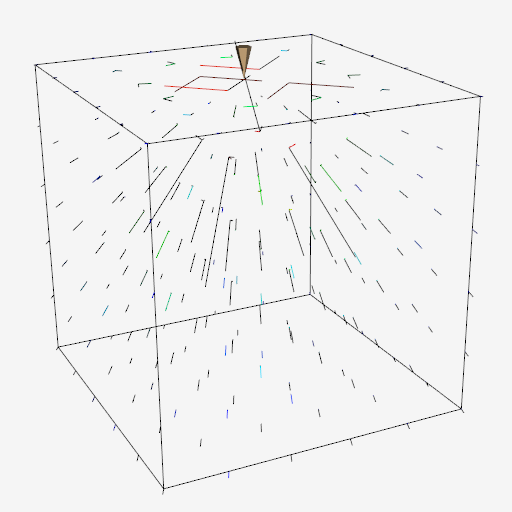
This example visualizes the analytical results of Boussinesq's problem from Saada. The figure shows the results by displaying the scaled and oriented principal axes of the stress tensor. (These are called tensor axes.)
Info
See Figure 6-22a in Chapter 6 the VTK Textbook.
Other languages
See (Cxx)
Question
If you have a question about this example, please use the VTK Discourse Forum
Code
TensorAxes.py
#!/usr/bin/env python

# Translated from TenAxes.tcl

# noinspection PyUnresolvedReferences
import vtkmodules.vtkInteractionStyle
# noinspection PyUnresolvedReferences
import vtkmodules.vtkRenderingOpenGL2
from vtkmodules.vtkCommonColor import vtkNamedColors
from vtkmodules.vtkCommonCore import vtkLookupTable
from vtkmodules.vtkFiltersCore import (
    vtkTensorGlyph,
    vtkTubeFilter
)
from vtkmodules.vtkFiltersGeneral import vtkAxes
from vtkmodules.vtkFiltersGeometry import vtkImageDataGeometryFilter
from vtkmodules.vtkFiltersModeling import vtkOutlineFilter
from vtkmodules.vtkFiltersSources import vtkConeSource
from vtkmodules.vtkImagingHybrid import vtkPointLoad
from vtkmodules.vtkRenderingCore import (
    vtkActor,
    vtkCamera,
    vtkPolyDataMapper,
    vtkRenderWindow,
    vtkRenderWindowInteractor,
    vtkRenderer
)


def main():
    colors = vtkNamedColors()

    # Create the RenderWindow, Renderer and interactive renderer.
    #
    ren = vtkRenderer()
    renWin = vtkRenderWindow()
    renWin.AddRenderer(ren)
    iren = vtkRenderWindowInteractor()
    iren.SetRenderWindow(renWin)

    # Generate the tensors.
    ptLoad = vtkPointLoad()
    ptLoad.SetLoadValue(100.0)
    ptLoad.SetSampleDimensions(6, 6, 6)
    ptLoad.ComputeEffectiveStressOn()
    ptLoad.SetModelBounds(-10, 10, -10, 10, -10, 10)

    # Extract a plane of data.
    plane = vtkImageDataGeometryFilter()
    plane.SetInputConnection(ptLoad.GetOutputPort())
    plane.SetExtent(2, 2, 0, 99, 0, 99)

    # Generate the tensor axes.
    axes = vtkAxes()
    axes.SetScaleFactor(0.5)

    tubeAxes = vtkTubeFilter()
    tubeAxes.SetInputConnection(axes.GetOutputPort())
    tubeAxes.SetRadius(0.1)
    tubeAxes.SetNumberOfSides(6)

    tensorAxes = vtkTensorGlyph()
    tensorAxes.SetInputConnection(ptLoad.GetOutputPort())
    tensorAxes.SetSourceConnection(axes.GetOutputPort())
    tensorAxes.SetScaleFactor(10)
    tensorAxes.ClampScalingOn()

    # Map contour
    lut = vtkLookupTable()
    MakeLogLUT(lut)
    # lut.SetHueRange(.6667, 0.0)
    tensorAxesMapper = vtkPolyDataMapper()
    tensorAxesMapper.SetInputConnection(tensorAxes.GetOutputPort())
    tensorAxesMapper.SetLookupTable(lut)
    plane.Update()  # force update for scalar range
    # This is deprecated from vtk 8.1 onwards.
    # tensorAxesMapper.ImmediateModeRenderingOn()
    tensorAxesMapper.SetScalarRange(plane.GetOutput().GetScalarRange())

    tensorActor = vtkActor()
    tensorActor.SetMapper(tensorAxesMapper)

    # Create an outline around the data.
    #
    outline = vtkOutlineFilter()
    outline.SetInputConnection(ptLoad.GetOutputPort())

    outlineMapper = vtkPolyDataMapper()
    outlineMapper.SetInputConnection(outline.GetOutputPort())

    outlineActor = vtkActor()
    outlineActor.SetMapper(outlineMapper)
    outlineActor.GetProperty().SetColor(colors.GetColor3d('Black'))

    #
    # Create a cone whose apex indicates the application of load.
    #
    coneSrc = vtkConeSource()
    coneSrc.SetRadius(.5)
    coneSrc.SetHeight(2)
    coneMap = vtkPolyDataMapper()
    coneMap.SetInputConnection(coneSrc.GetOutputPort())
    coneActor = vtkActor()
    coneActor.SetMapper(coneMap)
    coneActor.SetPosition(0, 0, 11)
    coneActor.RotateY(90)
    coneActor.GetProperty().SetColor(colors.GetColor3d('BurlyWood'))

    camera = vtkCamera()
    camera.SetFocalPoint(0.113766, -1.13665, -1.01919)
    camera.SetPosition(-29.4886, -63.1488, 26.5807)
    camera.SetViewAngle(24.4617)
    camera.SetViewUp(0.17138, 0.331163, 0.927879)
    camera.SetClippingRange(1, 100)

    ren.AddActor(tensorActor)
    ren.AddActor(outlineActor)
    ren.AddActor(coneActor)
    ren.SetBackground(colors.GetColor3d('WhiteSmoke'))
    ren.SetActiveCamera(camera)

    renWin.SetSize(512, 512)
    renWin.SetWindowName('TensorAxes')

    iren.Initialize()
    renWin.Render()
    iren.Start()


def MakeLogLUT(lut):
    # Original
    lut.SetScaleToLog10()
    lut.SetHueRange(.6667, 0.0)
    lut.Build()


if __name__ == '__main__':
    main()