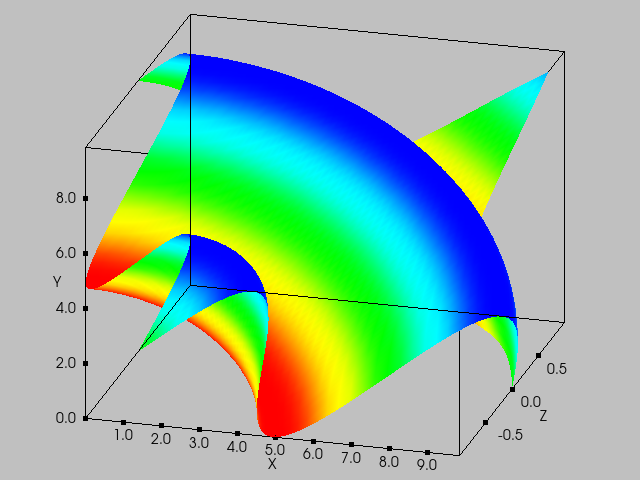
SurfacePlot
vtk-examples/PythonicAPI/Plotting/SurfacePlot
Question
If you have a question about this example, please use the VTK Discourse Forum
Code
SurfacePlot.py
#!/usr/bin/env python3

from math import sin, sqrt

# noinspection PyUnresolvedReferences
import vtkmodules.vtkInteractionStyle
# noinspection PyUnresolvedReferences
import vtkmodules.vtkRenderingContextOpenGL2
# noinspection PyUnresolvedReferences
import vtkmodules.vtkRenderingOpenGL2
from vtkmodules.vtkChartsCore import (
    vtkChartXYZ,
    vtkPlotSurface
)
from vtkmodules.vtkCommonColor import vtkNamedColors
from vtkmodules.vtkCommonCore import vtkFloatArray
from vtkmodules.vtkCommonDataModel import (
    vtkRectf,
    vtkTable,
    vtkVector2i
)
from vtkmodules.vtkRenderingContext2D import vtkContextMouseEvent
from vtkmodules.vtkViewsContext2D import vtkContextView


def main():
    colors = vtkNamedColors()

    geometry = vtkRectf(10.0, 10.0, 630, 470)
    chart = vtkChartXYZ(geometry=geometry)
    # chart.SetGeometry(vtkRectf(10.0, 10.0, 630, 470))

    view = vtkContextView()
    view.renderer.background = colors.GetColor3d("Silver")
    view.render_window.size = (640, 480)
    view.scene.AddItem(chart)

    # Create a surface
    table = vtkTable()
    num_points = 70
    inc = 9.424778 / (num_points - 1)
    for i in range(num_points):
        arr = vtkFloatArray()
        table.AddColumn(arr)

    table.SetNumberOfRows(num_points)
    for i in range(num_points):
        x = i * inc
        for j in range(num_points):
            y = j * inc
            table.SetValue(i, j, sin(sqrt(x * x + y * y)))

    # Set up the surface plot we wish to visualize and add it to the chart
    plot = vtkPlotSurface(x_range=(0, 9.424778), y_range=(0, 9.424778))
    plot.SetInputData(table)
    plot.GetPen().SetColorF(colors.GetColor3d("Tomato"))
    chart.AddPlot(plot)

    view.render_window.multi_samples = 0
    view.interactor.Initialize()
    view.render_window.window_name = 'SurfacePlot'
    view.render_window.Render()

    # Rotate
    mouse_event = vtkContextMouseEvent()
    mouse_event.interactor = view.interactor

    pos = vtkVector2i()
    last_pos = vtkVector2i()

    mouse_event.button = vtkContextMouseEvent.LEFT_BUTTON
    last_pos.Set(100, 50)
    mouse_event.SetLastScreenPos(last_pos)
    pos.Set(150, 100)
    mouse_event.SetScreenPos(pos)

    s_p = [float(x) for x in pos]
    l_sp = [float(x) for x in last_pos]
    screen_pos = mouse_event.screen_pos
    last_screen_pos = mouse_event.last_screen_pos

    chart.MouseMoveEvent(mouse_event)

    view.GetInteractor().Start()


if __name__ == '__main__':
    main()
