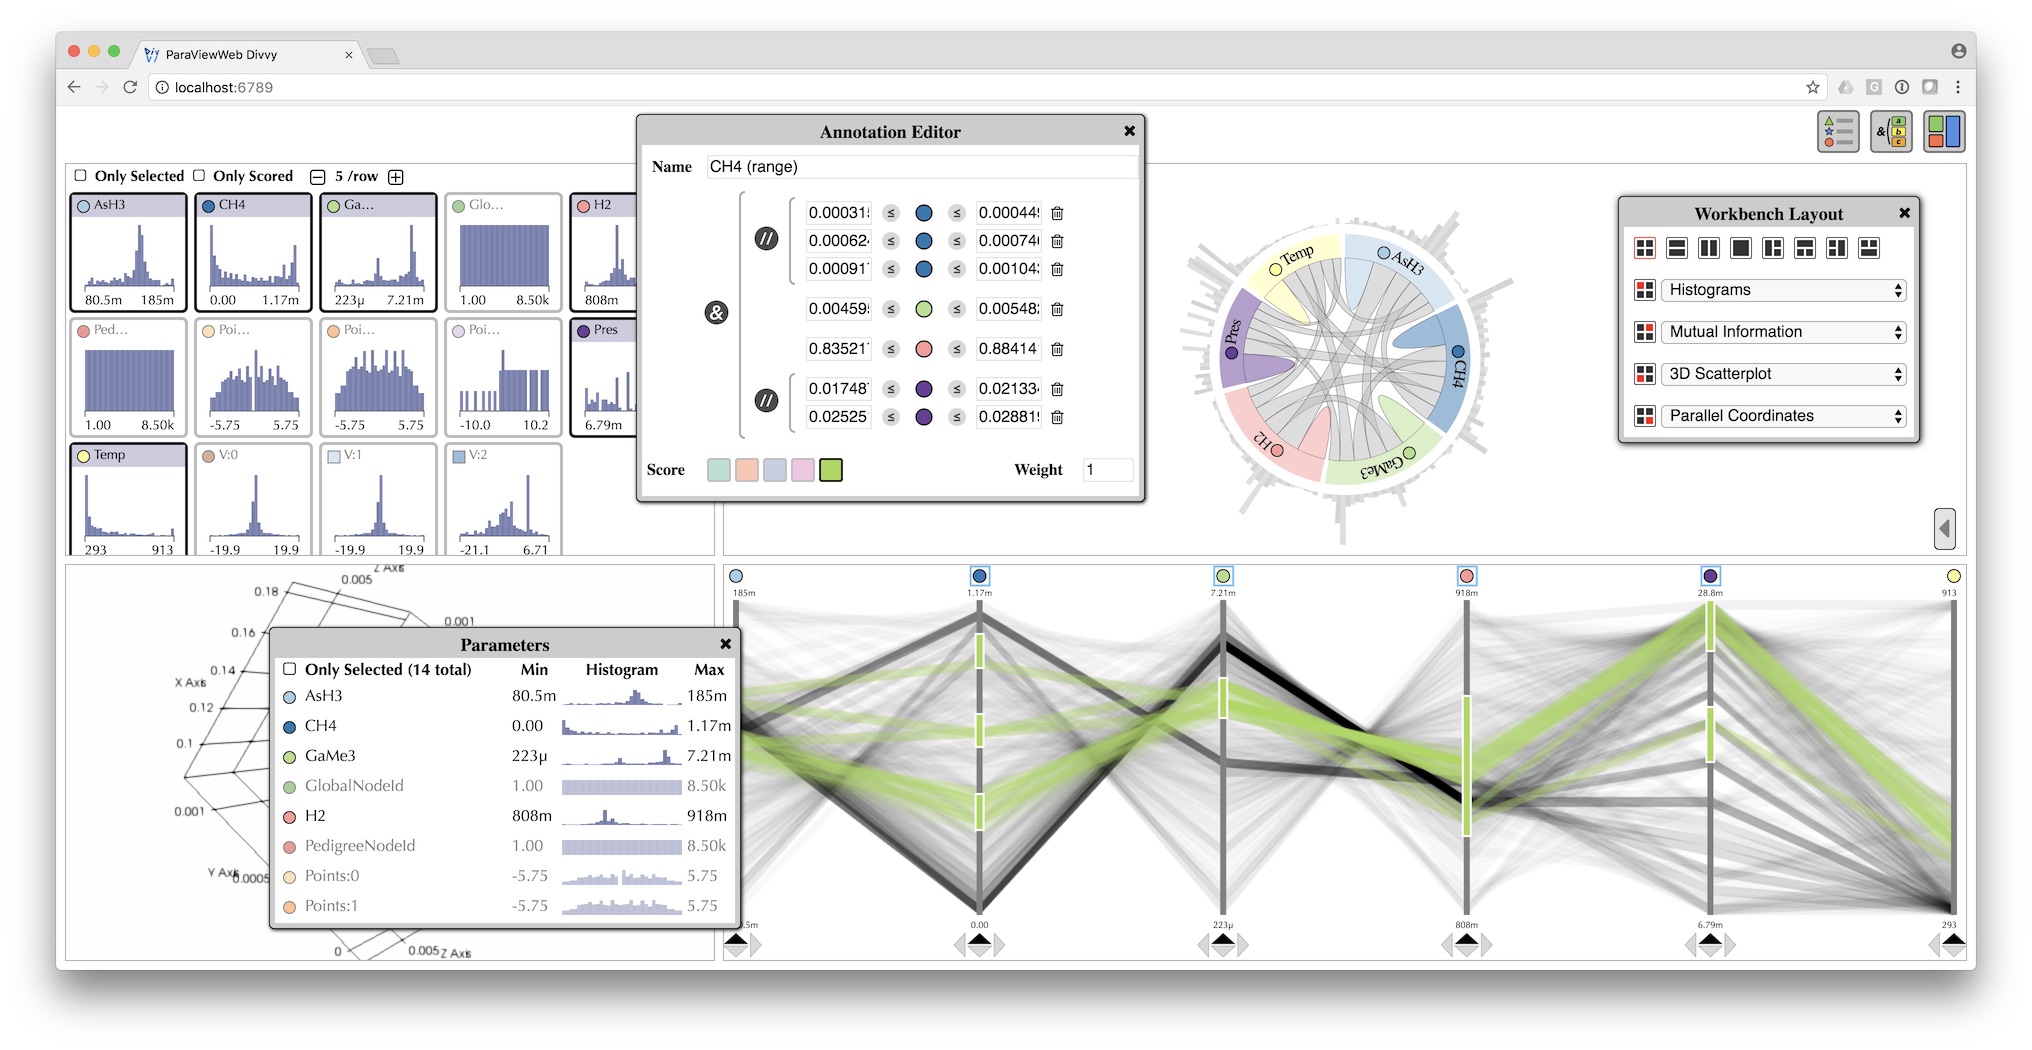
Divvy is the new kid in the ParaViewWeb family. Divvy uses ParaView as its data processing and visualization backend to provide an analytical view of data. In particular, Divvy makes use of readers and rendering capabilities in ParaView to create a 3D scatterplot or to visualize a mesh rendering along with selected points.
Welcome to the Divvy documentation. If you encounter any problems when using Divvy, have a look at the troubleshooting guide, raise an issue on GitHub.
What is Divvy?
Divvy is an application leveraging the InfoViz components of ParaViewWeb and making them available to the user in a consistent manner.
Running Divvy
To use Divvy you need to have ParaView (5.10+) which can be downloaded here. From the command line, you can start Divvy by running the following command line and pointing to the file you want to load.
./paraview/bin/pvpython -m paraview.apps.divvy --data /path/to/data/disk_out_ref.ex2 --port 1234 |
Then open your browser at http://localhost:1234/