Appearance
Digital Twin Visualization
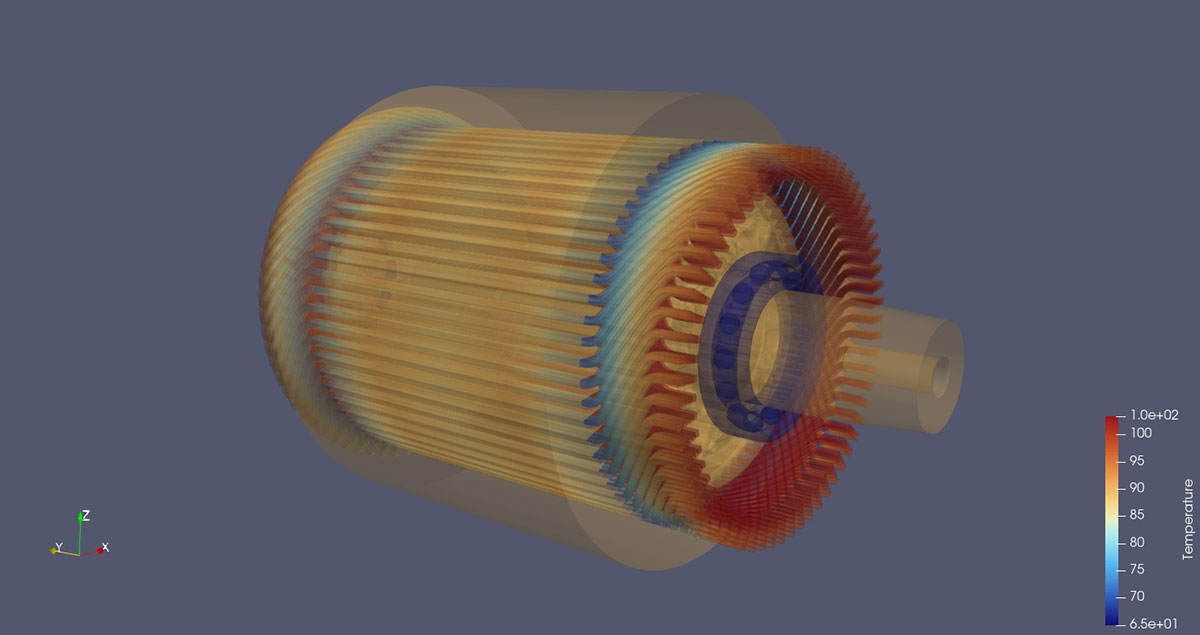
Live visualization of a drive train digital twin. Data from 30 temperature sensors on an electric motor are interpolated onto a digital twin model for live display in ParaView. This allows engineers from TotalEnergies to have direct access to a visualization showcasing the measured elements as it is running, and perform analysis and visualization within ParaView, either using the whole set of existing filters or even implementing their own.
More information at Build, Control and Run Digital Twins with ParaView.
Frameworks used: ParaView