Using ParaView Catalyst in Weather Research and Forecasting Workflows
Cyclone Chapala, one of the most powerful tropical cyclones ever recorded in the Arabian Sea, struck in 2015 with sustained wind speeds reaching 240 km/h (150 mph), causing over $100 million in damage across Yemen, Oman, and Somalia. In an effort to better understand such extreme weather events and improve future forecasting, researchers at King Abdullah University of Science and Technology (KAUST) developed a high-resolution Weather Research and Forecasting (WRF) model to simulate the cyclone’s behavior in detail.
 |
|---|
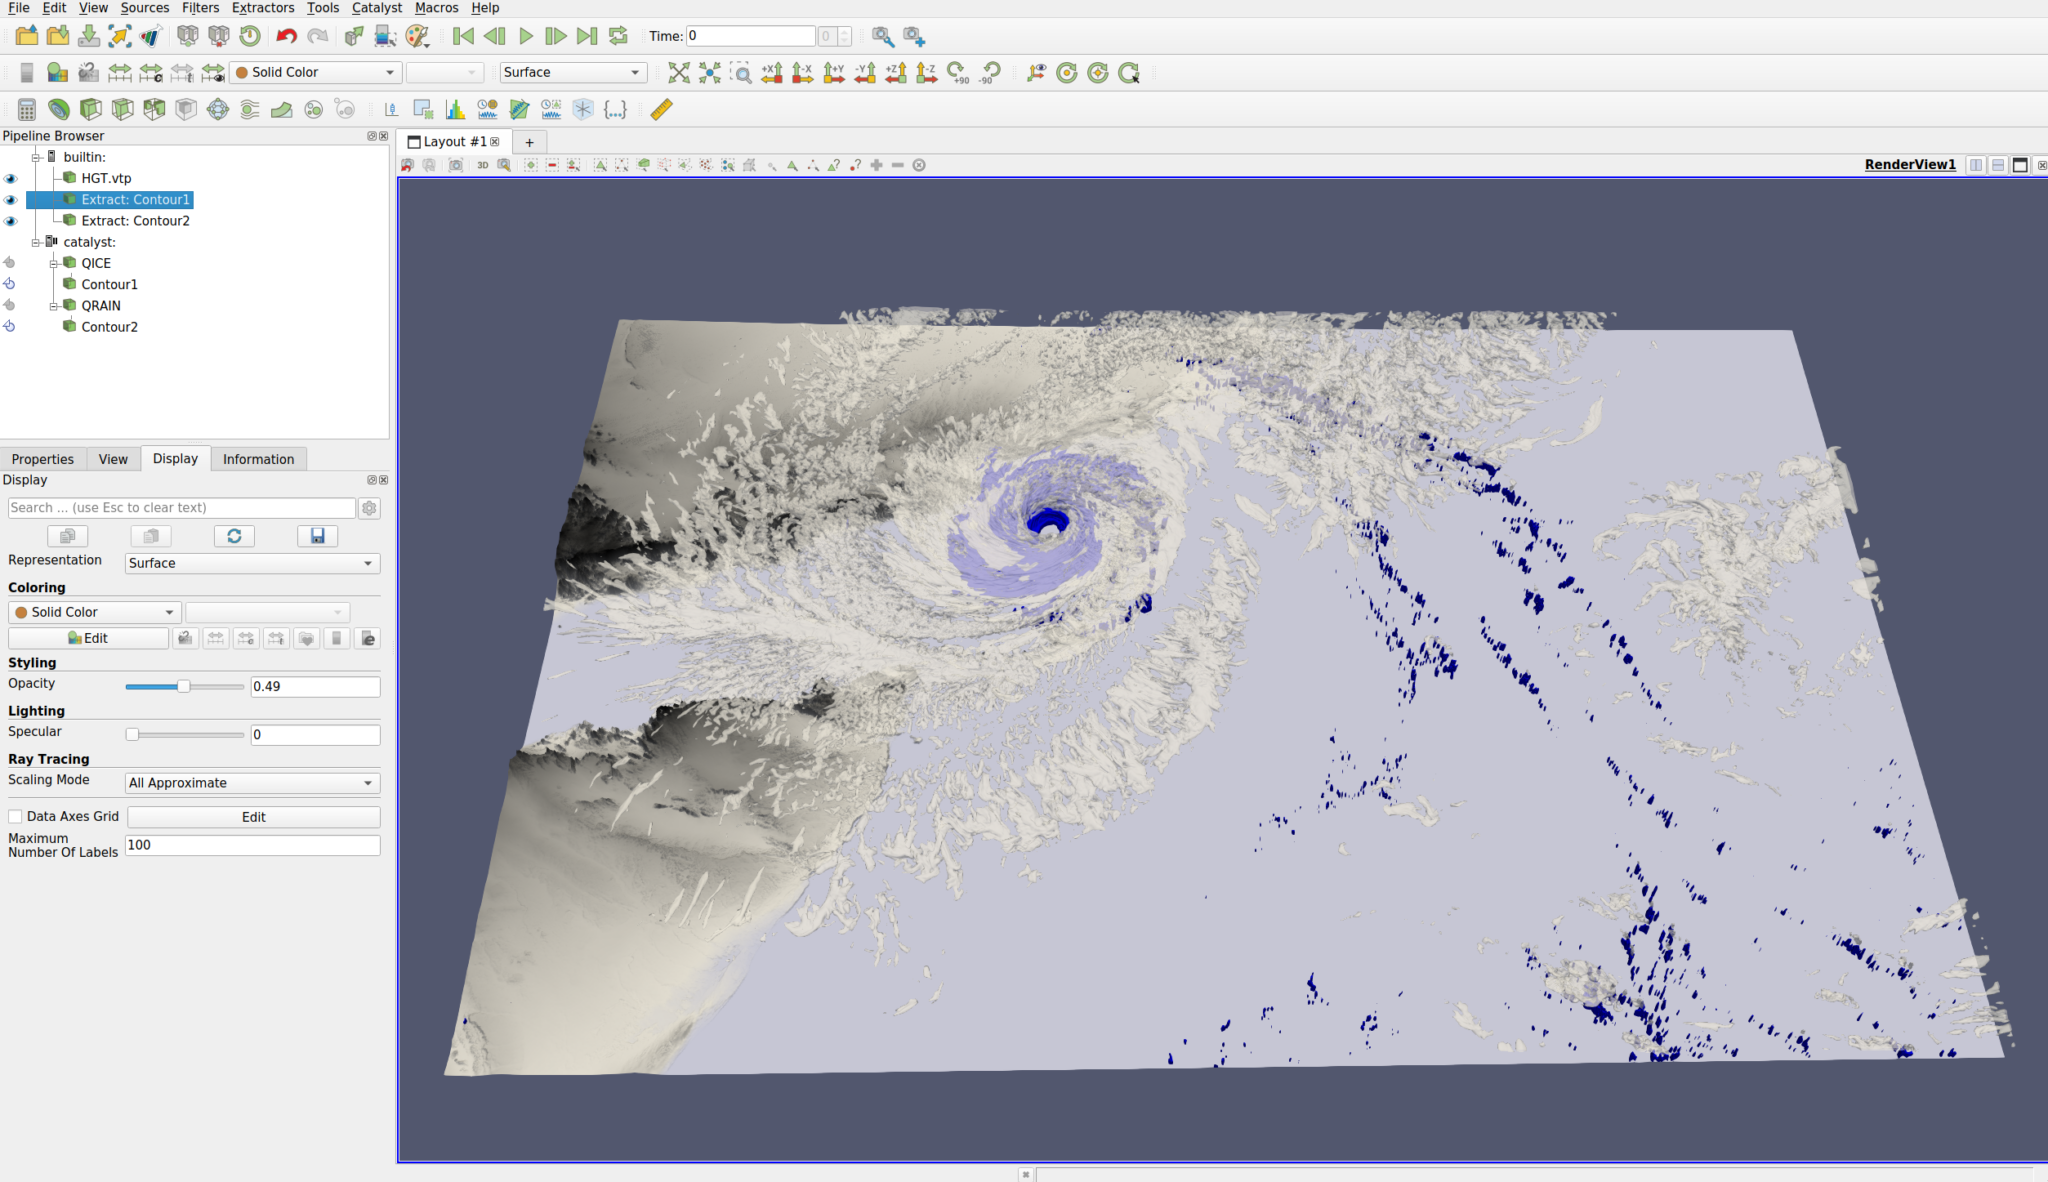
| In situ live visualization of Chapala using Inshimtu and ParaView Catalyst |
The simulation itself was a technical feat: a 1100×1000×34 structured grid across 138 time steps, tracking complex dynamics including velocity fields and scalar quantities for cloud, graupel, ice, rain, snow, and vapor—resulting in over 300 GB of data. For simulation developers, this scale of output introduces a critical challenge: I/O becomes the primary bottleneck, severely impacting overall performance and limiting the feasibility of traditional post-processing workflows.
To address this, the team used ParaView Catalyst for in situ visualization and analysis. By embedding Catalyst directly into the WRF simulation, they eliminated the need for costly intermediate storage, enabling real-time inspection of key variables and fluid dynamics. This approach not only improved performance but also empowered researchers to iteratively refine their model and extract insights on the fly—an increasingly essential capability for next-generation geophysical simulations.
You can find more information about this effort here.