Appearance
Using Vuetify playground
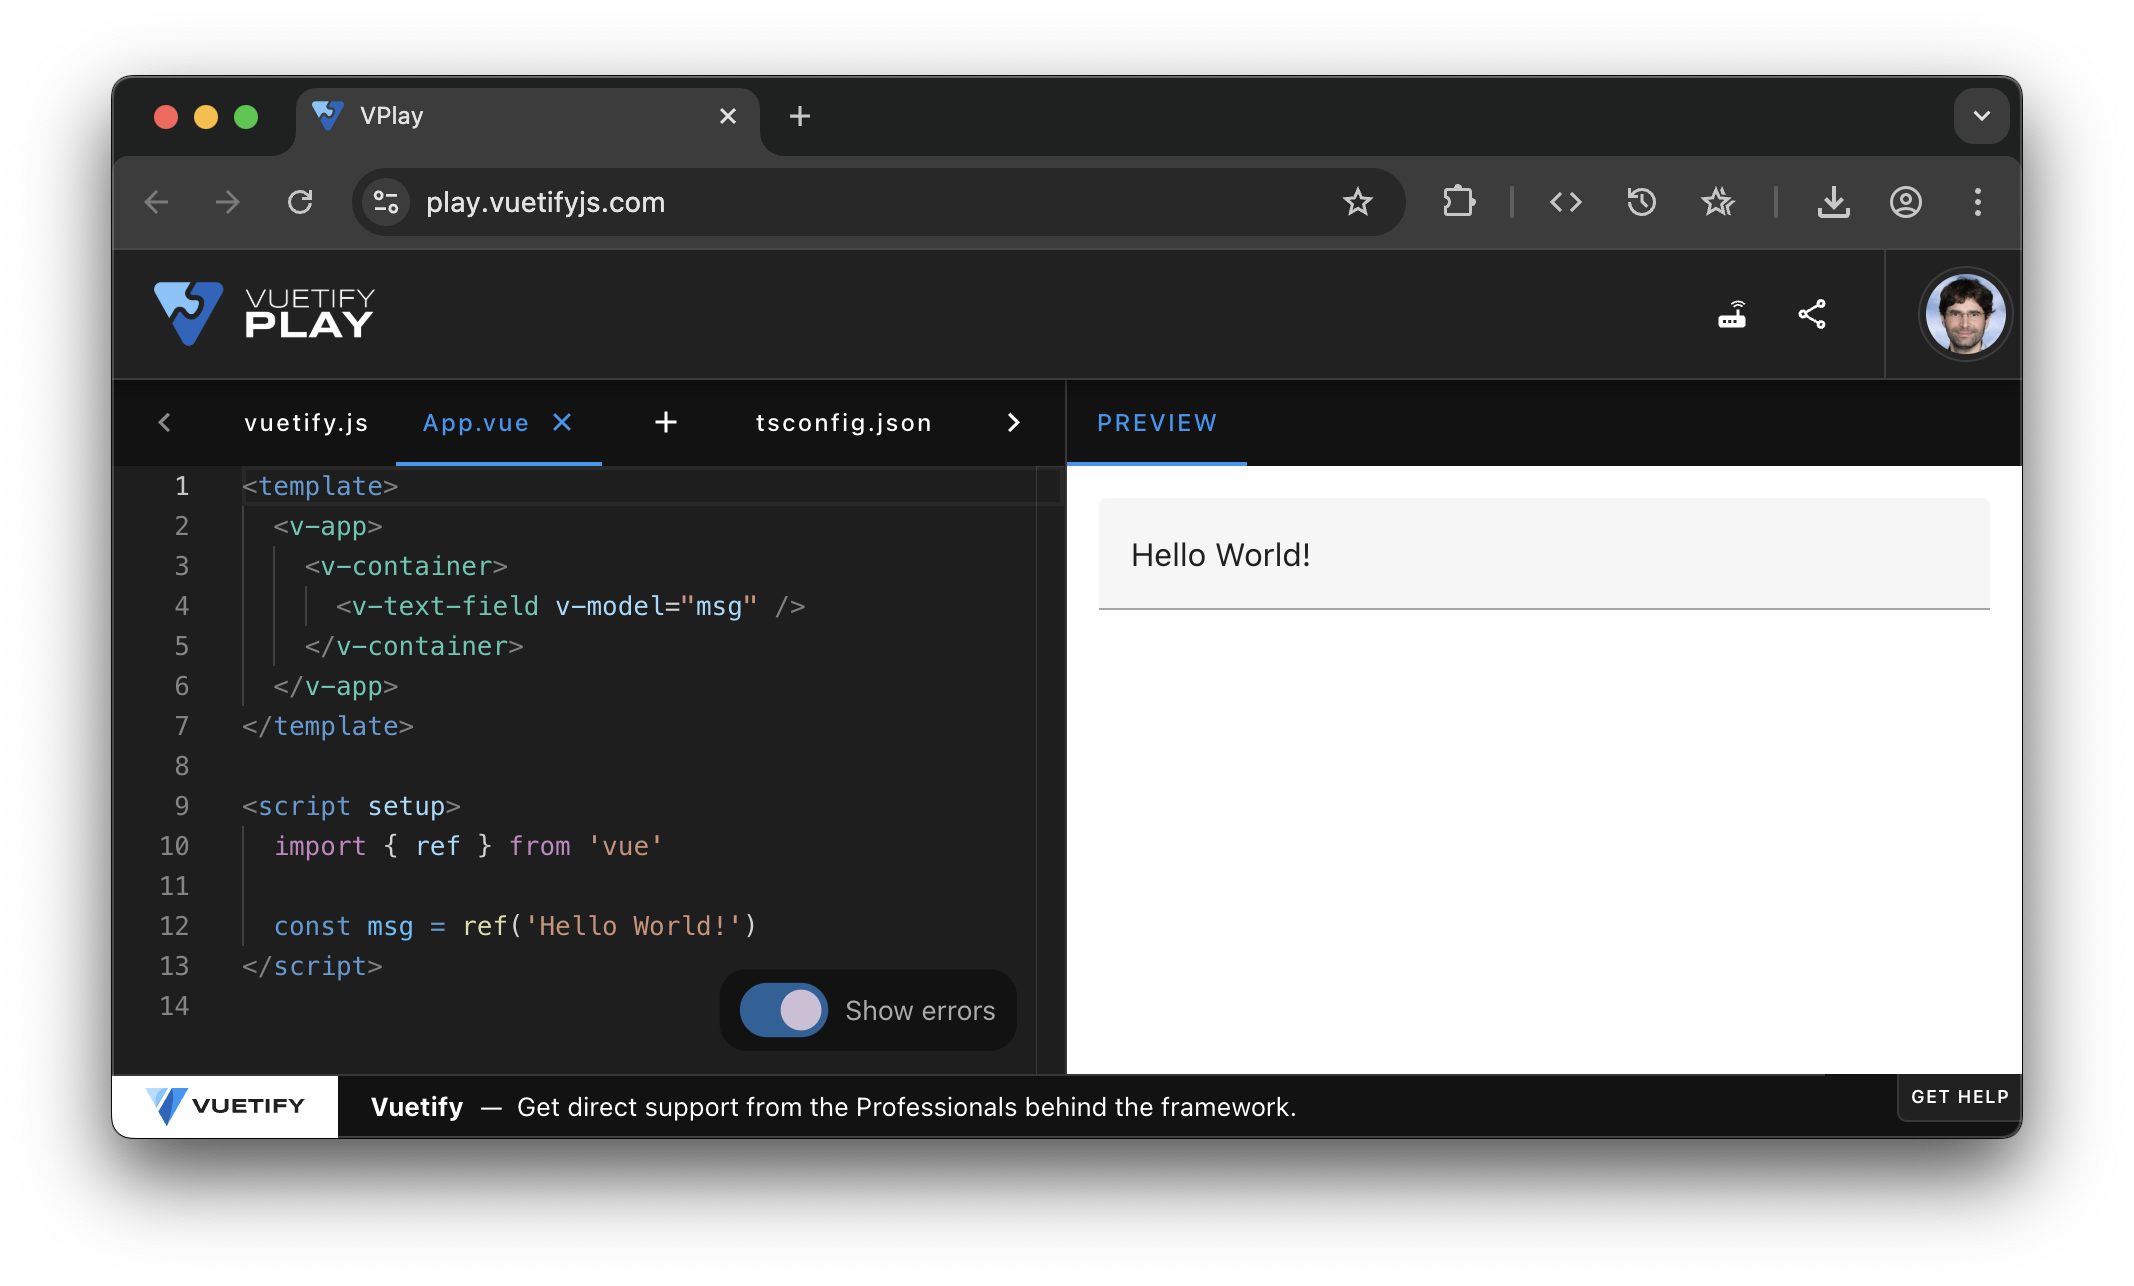
The vuetify playground let you write your user interface using the vue template syntax and directly see the results.
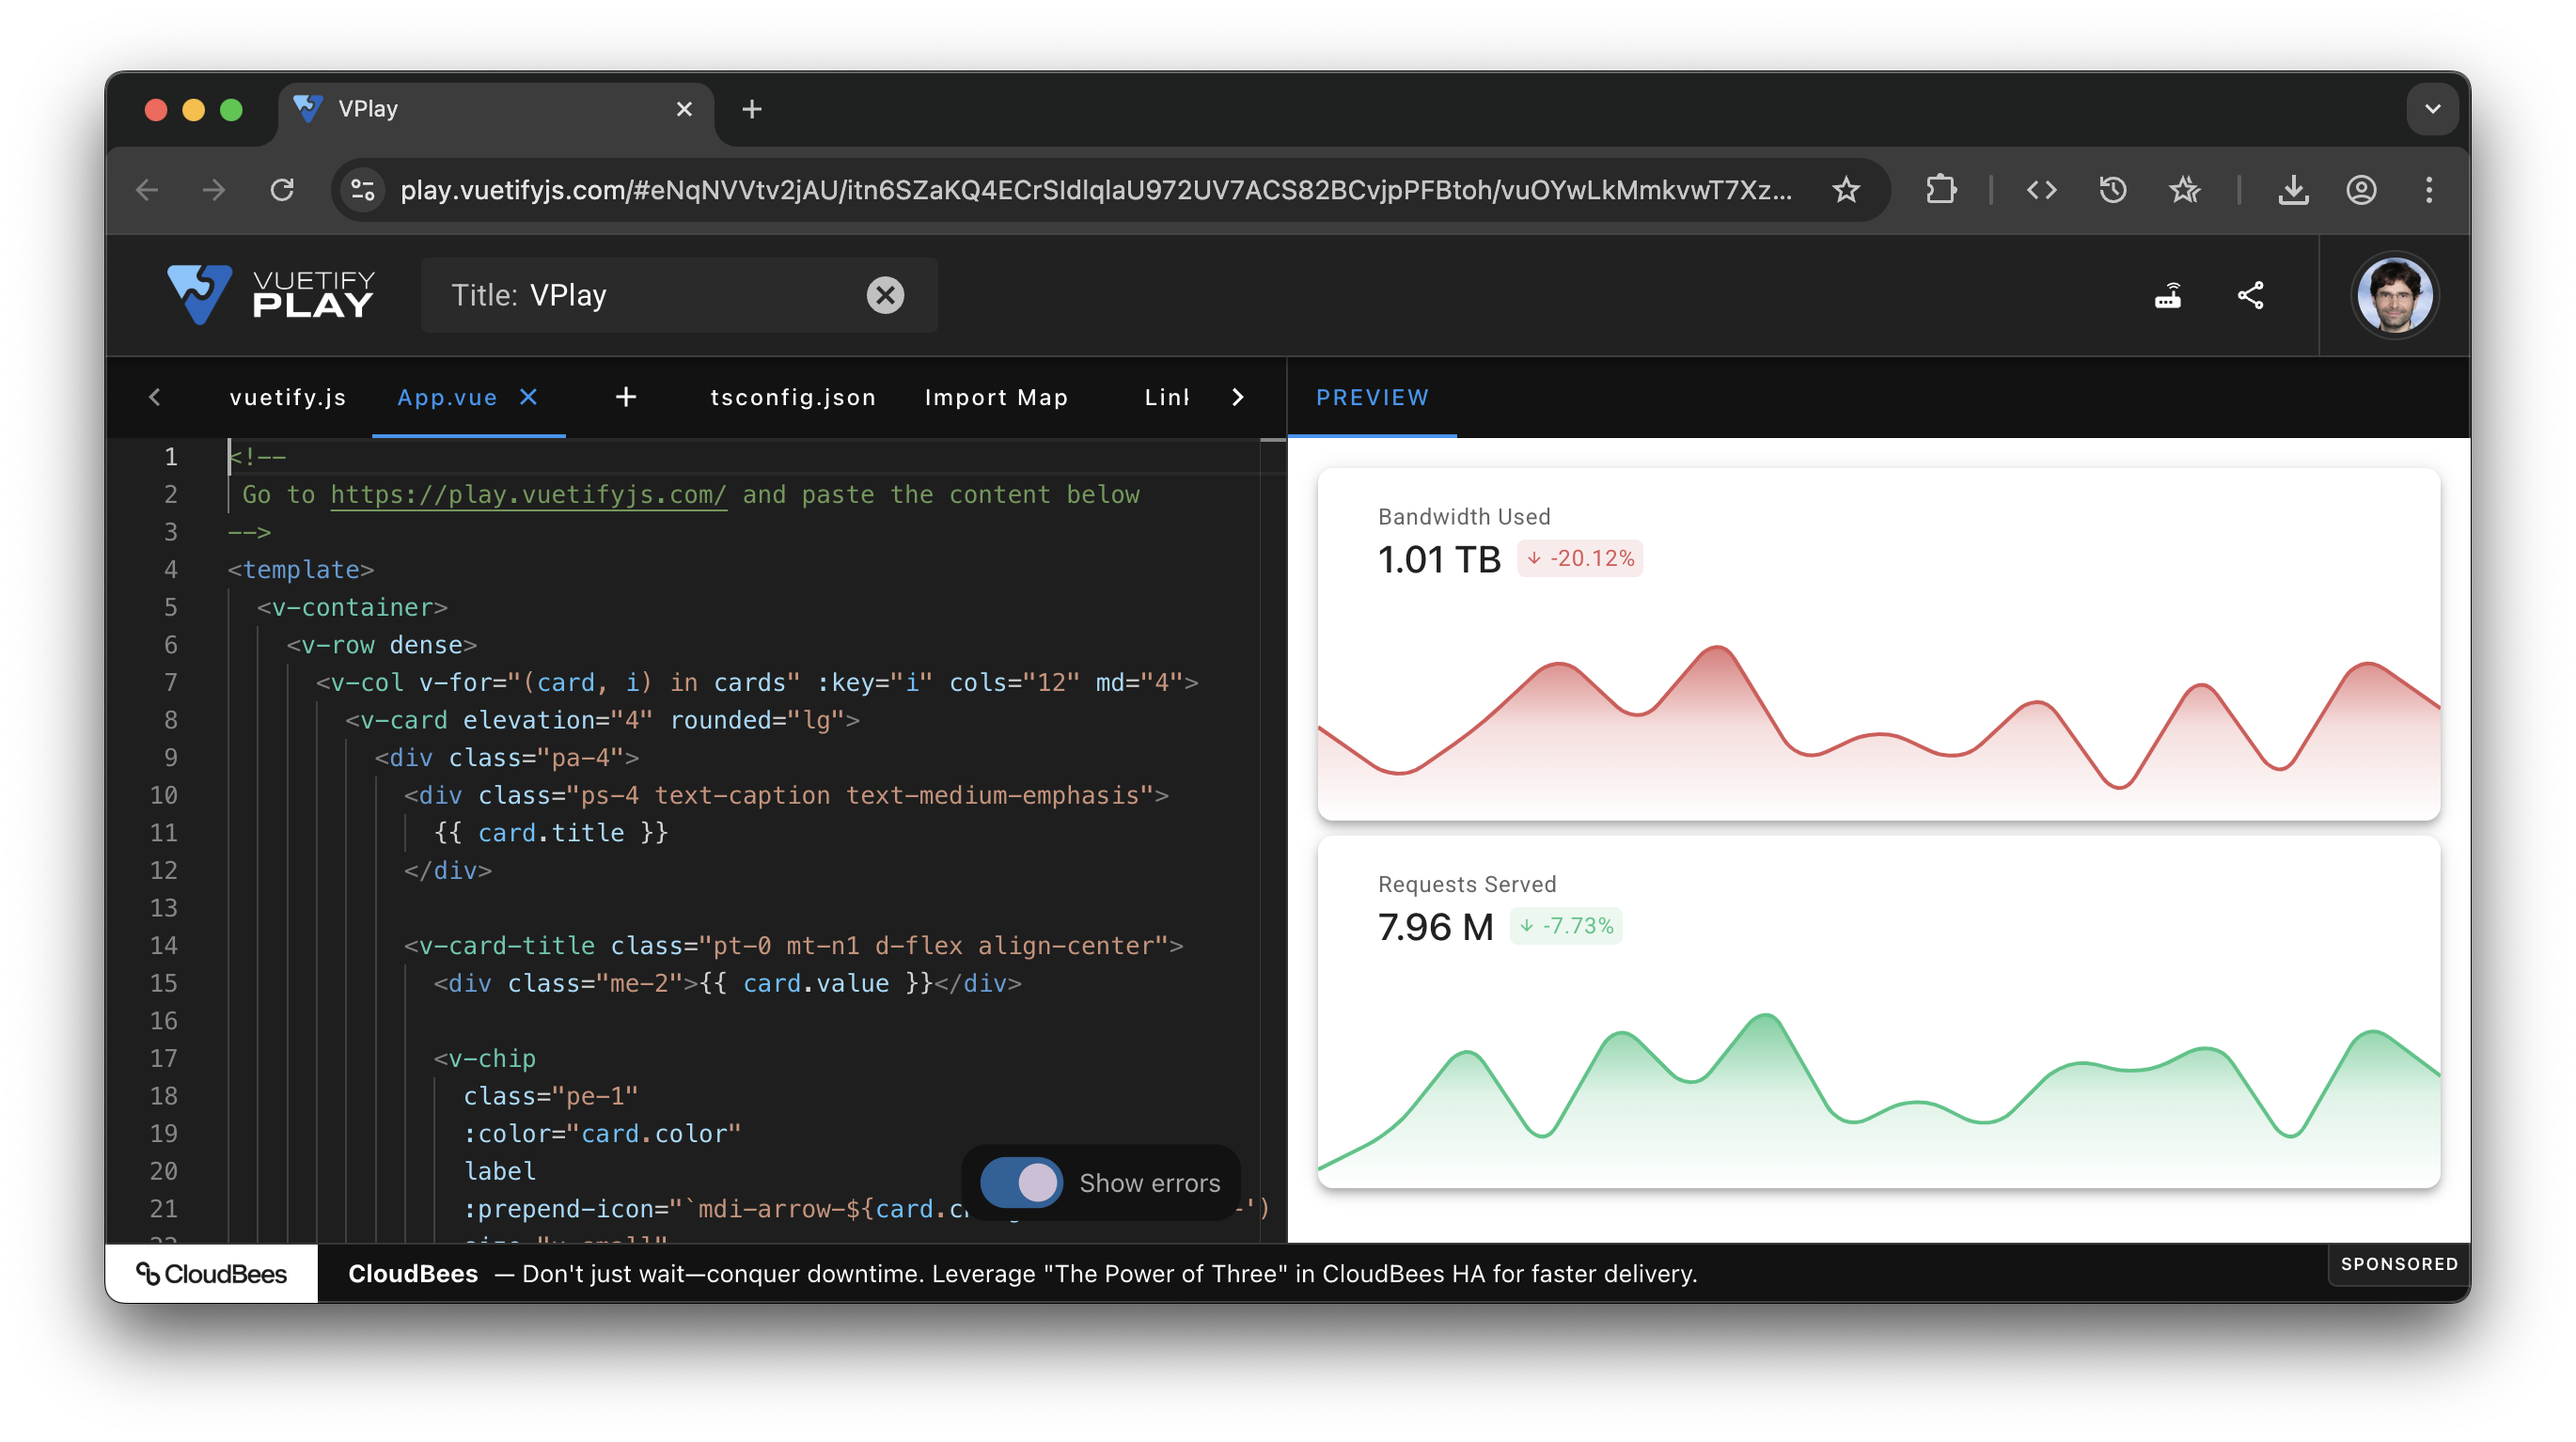
Make some pretty statistic cards
vue
<!--
 Go to https://play.vuetifyjs.com/ and paste the content below
-->
<template>
    <v-container>
      <v-row dense>
        <v-col v-for="(card, i) in cards" :key="i" cols="12" md="4">
          <v-card elevation="4" rounded="lg">
            <div class="pa-4">
              <div class="ps-4 text-caption text-medium-emphasis">
                {{ card.title }}
              </div>

              <v-card-title class="pt-0 mt-n1 d-flex align-center">
                <div class="me-2">{{ card.value }}</div>

                <v-chip
                  class="pe-1"
                  :color="card.color"
                  label
                  :prepend-icon="`mdi-arrow-${card.change.startsWith('-') ? 'down' : 'up'}`"
                  size="x-small"
                >
                  <template #prepend>
                    <v-icon size="10" />
                  </template>

                  <span class="text-caption">{{ card.change }}</span>
                </v-chip>
              </v-card-title>
            </div>

            <v-sparkline
              :color="card.color"
              fill
              :gradient="[`${card.color}E6`, `${card.color}33`, `${card.color}00`]"
              height="50"
              line-width="1"
              min="0"
              :model-value="card.data"
              padding="0"
              smooth
            />
          </v-card>
        </v-col>
      </v-row>
    </v-container>
</template>

<script setup>
    const cards = [
      {
        title: 'Bandwidth Used',
        value: '1.01 TB',
        change: '-20.12%',
        color: '#da5656',
        data: [5, 2, 5, 9, 5, 10, 3, 5, 3, 7, 1, 8, 2, 9, 6],
      },
      {
        title: 'Requests Served',
        value: '7.96 M',
        change: '-7.73%',
        color: '#2fc584',
        data: [1, 3, 8, 2, 9, 5, 10, 3, 5, 3, 7, 6, 8, 2, 9, 6],
      },
    ]
</script>