

June 11, 2026
trame-radial-menu is a new trame widget that can spawn at mouse click with slots for side menus and buttons around. 
Mai 27, 2026
Trame client 3.12 features a Handler widget to easily register and run JavaScript modules files on the client side with minimal boilerplate. See the examples here
February 10, 2026
Trame GWC now supports vue3 client following the migration of the Girder Web Components to Vue3.
Mai 28, 2025
Version 3.10 of trame has been released. This version add a new tool for providing information on the rendering backend used by VTK. The tool documentation is available here, but in a nutshell, this is going to be very useful when debugging cloud deployment for remote rendering setup for either VTK or ParaView.
Mai 9, 2025
Trame client is now 3.9 and brings all the built-in components of vue.js.
April 25, 2025
Version 3.9 of trame has been released. This version brings a new core module named trame-common into the mix. That module aims to provide generic classes that can be relevant across trame packages. This includes assets handling, execution helper (throttle, async task), decorators and abstract classes for building components or apps.
April 24, 2025
Trame client is now 3.8 and brings support for event modifier from vue.js when using the v_on_xxx_yyy notation.
April 14, 2025
Trame vuetify has been updated to include Andromeda 3.8.
February 4, 2025
Version 3.8 of trame has been released. This mainly fixes the @TrameApp() decorator so it can be used throw inheritance.
January 23, 2025
Trame GWC has been released, extending trame widgets with Girder Web Components to simplify connecting to and interacting with Girder databases. These widgets are only available with the vue2 client.
October 29, 2024
With the release of vtk 9.4, we have some really cool news for the python community.
Want to learn more on how to best leverage vtk with Python? Read our blog on the new property and pipeline syntax.
As always, kitware can help
October 20, 2024
We have a new widget that enable deep reactiveness on a state variable. This feature is only available with the vue3 client. An example of such usage is available here.
October 16, 2024
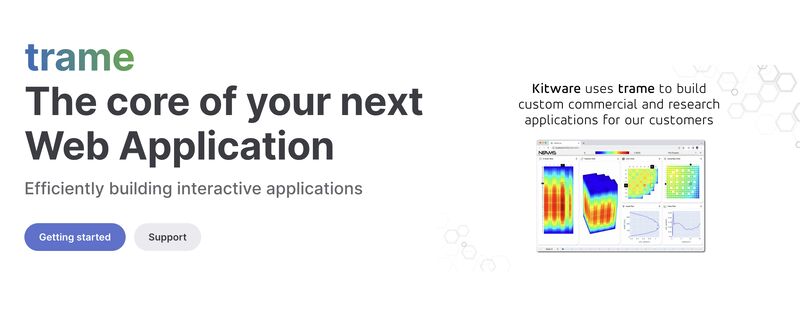
Building Interactive Web Applications with trame A simple paradigm for modern application development
Creating highly interactive or data intensive applications can be challenging in itself but if you want to venture to the web, things can become even more complicated. What if that was not true and you could leverage your existing team to create such applications? With trame, a single application can be deployed in the cloud, on HPC, run within Jupyter or bundled locally like any desktop application.
Trame webinar with video recording available
October 1, 2024
Modeling and simulation tools typically offer a comprehensive set of features to meet the needs of all potential users in a variety of domains. These tools are powerful, but come with a steep learning curve. Micro-workflows can be used to simplify the complex - creating a custom workflow packaged as a web application targeted at a specific need that is easy to learn, easy to use, and runs anywhere. Kitware Inc. can help you create micro-workflows that enable your domain experts to harness the power of your modeling and simulation tools without having to face a daunting learning curve. Find out more in our latest blog post on trame, then contact us to set up a meeting to talk about micro-workflows for your environment based on our open source platforms.
September 28, 2024
September 26, 2024
Want to learn how to create Web apps with VTK and ParaView in plain Python? I'll be teaching a course on September 26th.
Come and join me to learn more about trame.
September 21, 2024
September 20, 2024
September 18, 2024
September 5, 2024
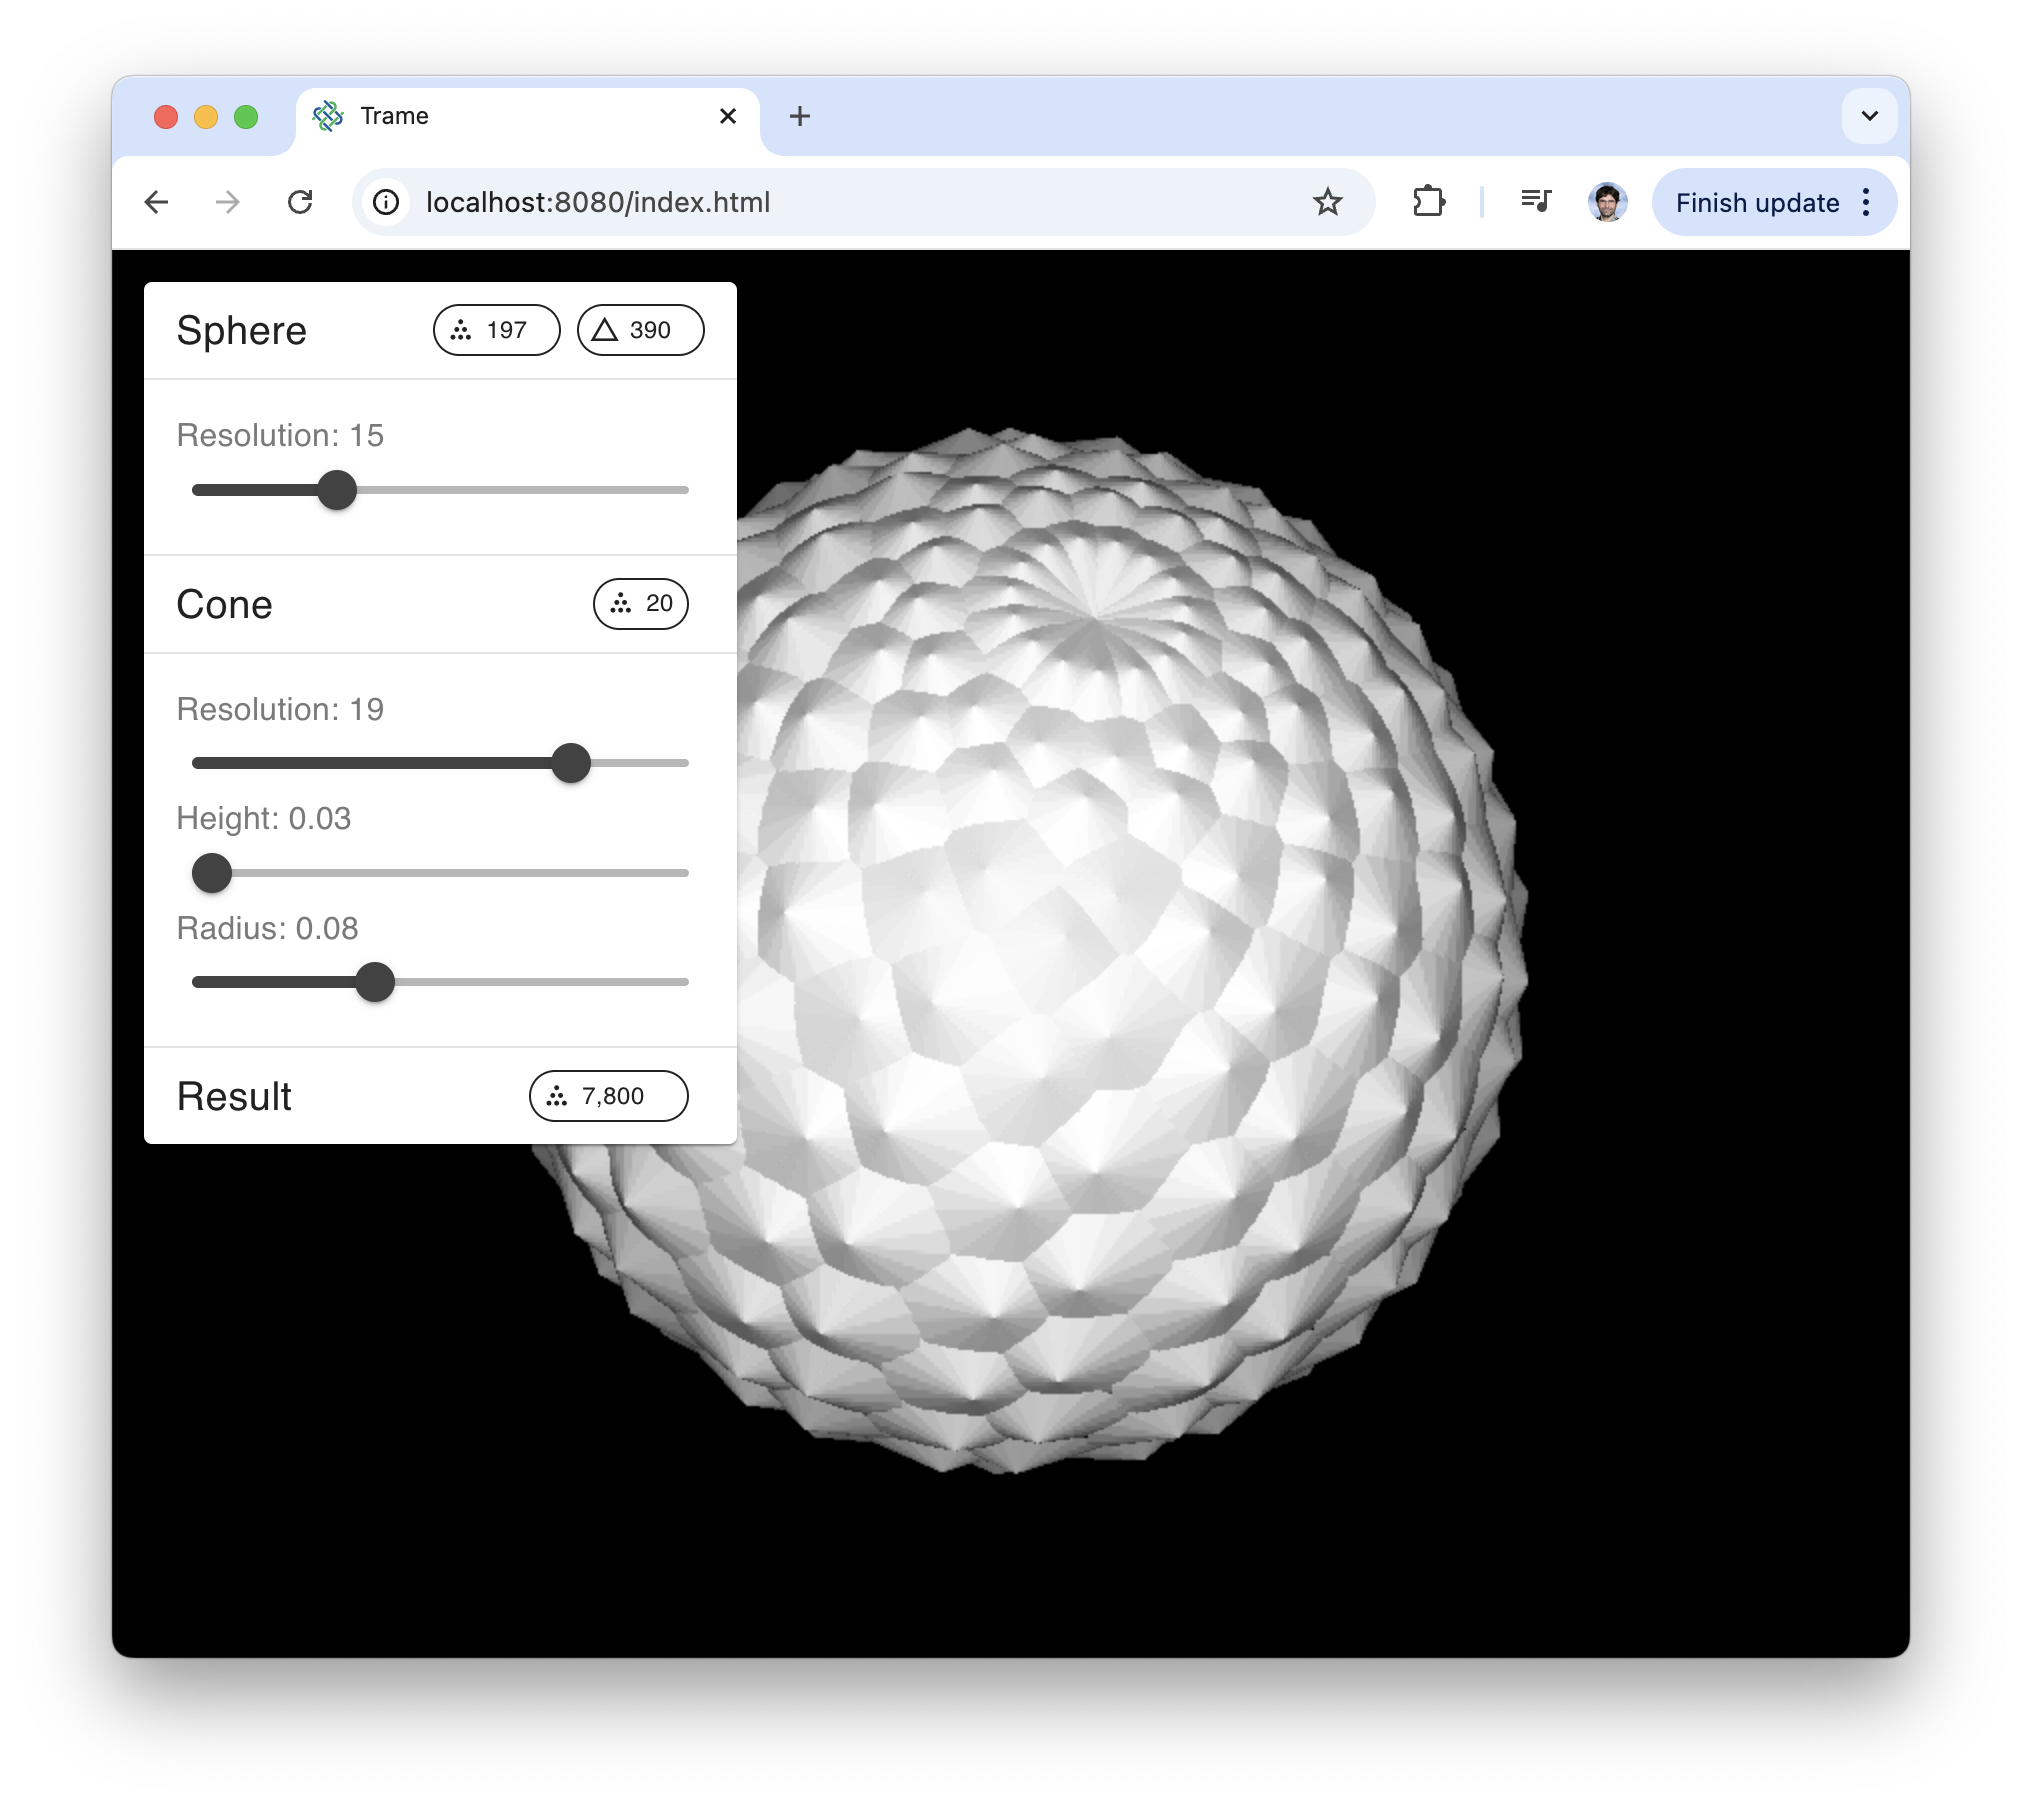
trame can do more than just interactive 3D visualization on the Web with vtk and paraview. In fact it can also be used to create dashboards like dash and streamlit but with more capabilities.
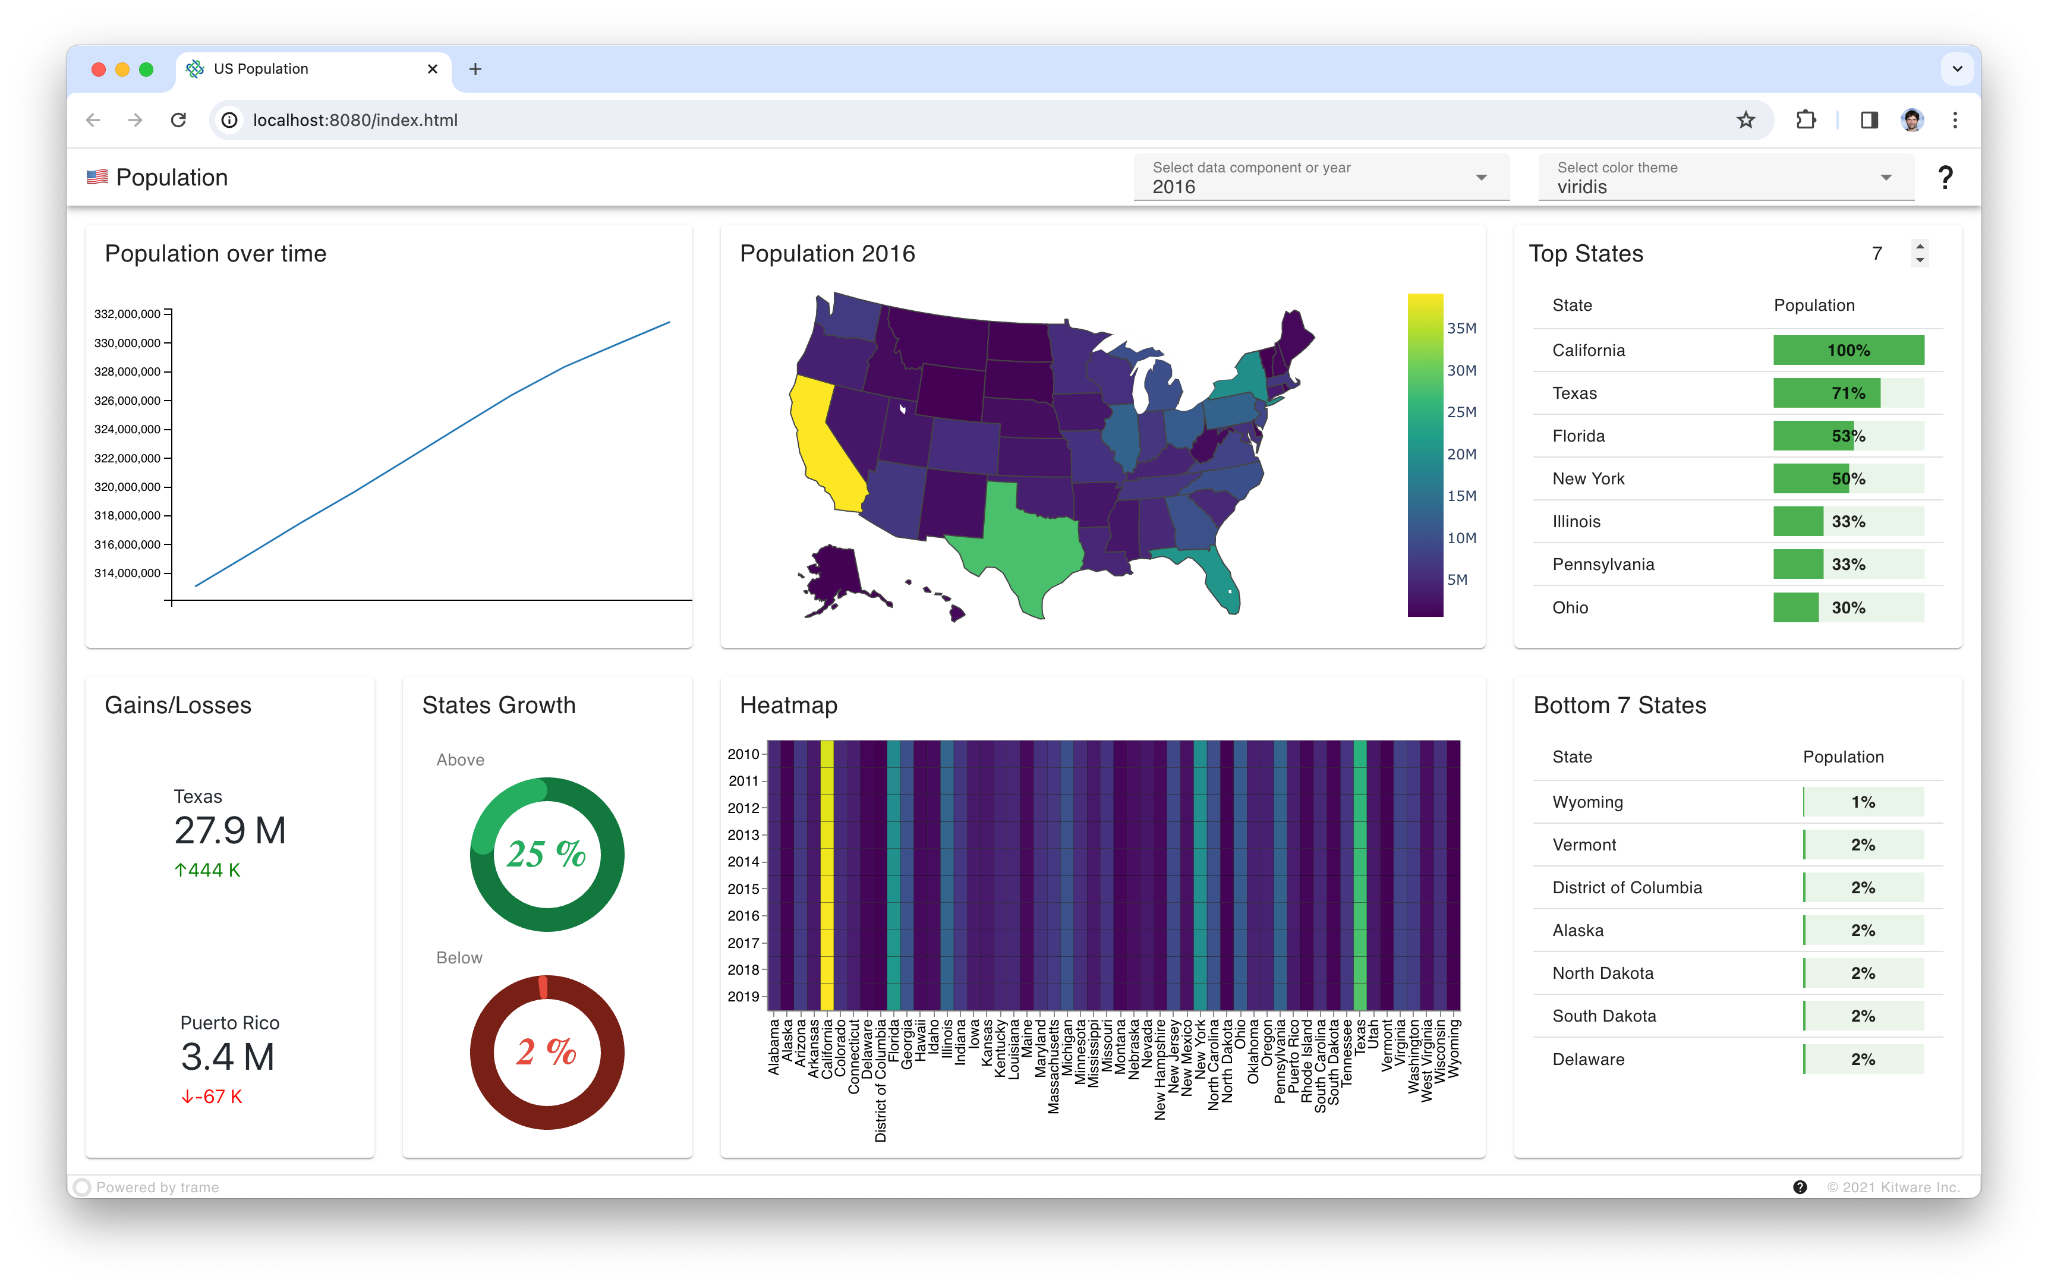
Want to learn more? Checkout our blog on dashboards with trame.
September 3, 2024
Wondering how to leverage trame with paraview? The 5.13 release make it strait forward. This blog provides a quick introduction on how to get going.
August 29, 2024
We have our first blog out about paraview and its new --venv option to extend the python packages available.
Using Python Virtual environments in ParaView 5.13.0
August 21, 2024
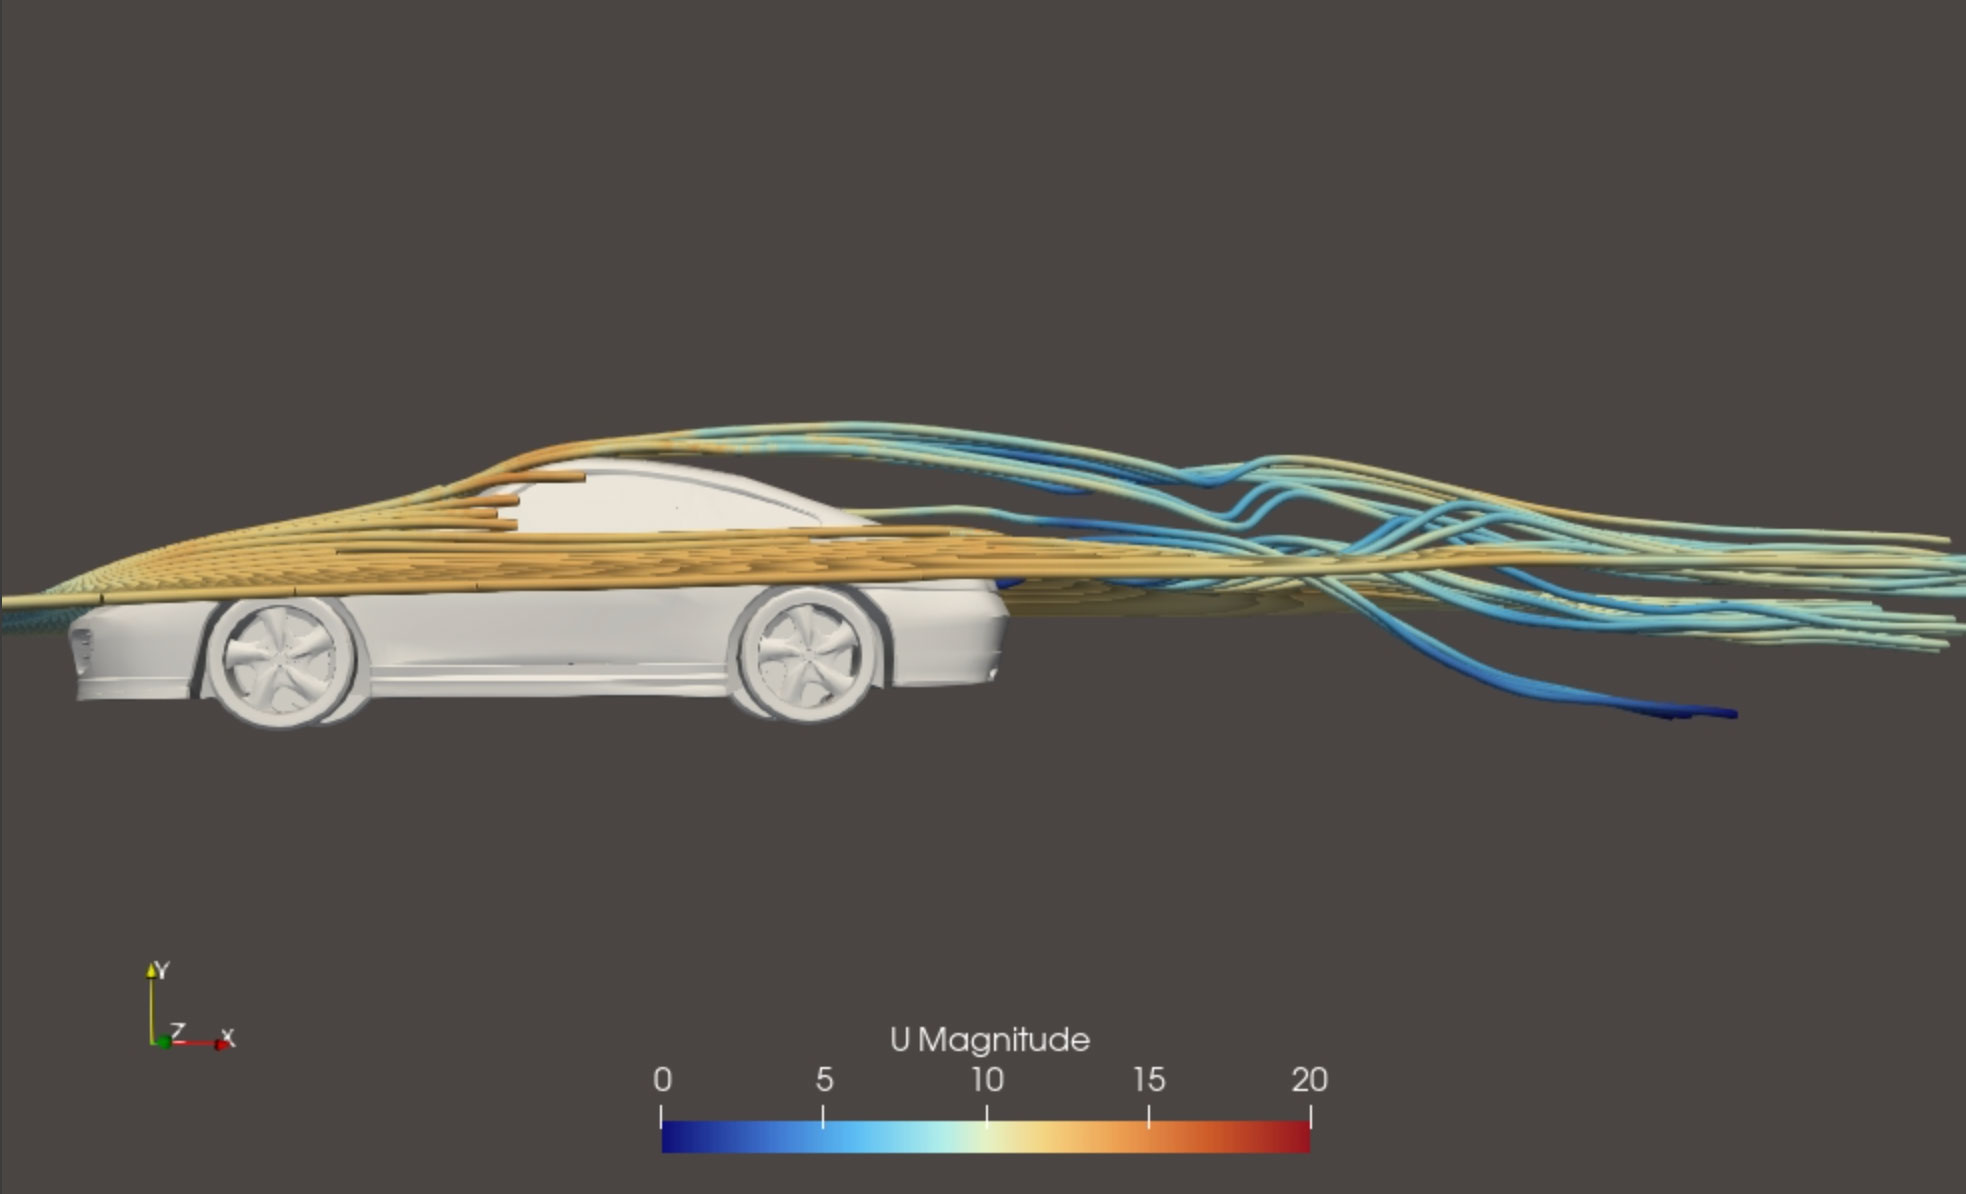
Make Your Automotive Simulation Tools Available on the Web
We use websites to do everything, from communicating with friends and family and paying bills, to shopping for cars, and visiting the doctor. Even at work we rely heavily on the web because it provides a platform for wide-spread and easy access to applications. Web browsers are highly effective at delivering applications with excellent user experiences.
August 9, 2024
New blog on trame available covering its Architecture and Capabilities
August 5, 2024
Trame usage keeps growing
July, 2024
Enterprise deployment of CFD models with M-STAR
July 8-14, 2024
Trame was present at SciPy
Jaswant presented the new VTK/Python advancement (wrapping and WASM) and participated at the PyVista tutorial by teaching more usage of trame with VTK and PyVista.
June, 2025
Nice to see trame being used by the community within jupyter context to create 3D interactive solutions.
May, 2024
April 10, 2024
Version 3.6 of trame has been released. This version brings some big internal refactoring that replace the network layer to support message chunking via msgpack. This is key for enabling better support for trame within Jupyter thanks to the trame-jupyter-extension.
April, 2024
March, 2024
February, 2024
February, 2024
Top Python Frontend Libraries for Data Science - HiRETOP
In the ever-evolving world of data science and machine learning, Python remains a dominant language, thanks in large part to its vast ecosystem of libraries. Among these, frontend libraries have become essential for professionals looking to translate complex data into accessible and interactive web applications. Here's an insightful exploration of the top Python frontend libraries, each offering unique capabilities to enhance your data science projects.
Trame: Interactive and Visual Richness
Trame is another notable mention for data scientists and engineers looking to build interactive web applications with rich visualizations, including 3D models and sophisticated simulations. Leveraging libraries like VTK and ParaView, Trame excels in scientific and engineering applications. Its approach to creating reactive, stateful applications is promising, although the relatively new framework means a smaller community and potential growing pains as it continues to develop.
January 15th, 2024
The Best Python Frontend Libraries For Data Science - Alessandro Fiori
Developing web and desktop applications requires knowledge of several programming languages. Defining user interfaces is a fundamental aspect of providing a good user experience (UX) and viewing information in an effective and appealing manner. For those involved in analysing data or collecting it, however, this aspect is critical. In fact, many developers specialise in one language and are reluctant to expand their knowledge to other languages or tasks that are not their core business. For this reason, in this article we present five libraries in python that can facilitate and speed up the development of user interfaces.
January 15th, 2024
5 Exceptional Python Frameworks for Frontend Development - Ishaan Gupta
#4 Trame
If you find yourself tasked with creating a data-centric dashboard, Trame emerges as an excellent choice. This versatile tool empowers you to concentrate on your data analysis, effortlessly streamlining the intricacies of web development. Trame is ingeniously constructed upon Vuetify, a dynamic UI component framework rooted in Vue, ensuring a seamless and efficient dashboard creation experience.
January 5th, 2024
2023 summary in kind words from the community:
- I came across trame and is simply MIND BLOWING. What a fantastic job you did. Link
- I'm quite new on Trame but I have been using Dash for a while to build some web applications. I really like how easy you can create interactive 3D visualization with Trame and I wondered whether I should start using it, instead of Dash. Link
- I recently came across Trame and the capabilities are really astounding. It is a very nicely done framework for creating rich applications for 3D visualization, analysis, and interaction. Link
- Hi! First of all, thanks for this amazing library, been having lots of fun rebuilding some old streamlit apps with it! Link
January 4th, 2024
Trame course on February 12th for trame
Links to Trame course | Kitware trainings | LinkedIn
December 24th, 2023
Top-5 Python Frontend Libraries for Data Science - Artem Shelamanov
#3 Trame
So, Trame is a go-to if you want to create some science-focused apps with interactive, complex visualizations and simulations (Even in 3D!). It’s multi-platform, it provides many useful features, and overall it looks aesthetically pleasing.
November 1st, 2023
Trame: Frontend With Vue.js, but in Python
You may have heard about Vue.js — a javascript library for quick one-page websites and UIs, a performant library with easy development. But what you may not have heard of is Trame — a library for Vue.js, but in Python!
October 10, 2023
This is what happens when you let an engineer play for the first time with VTK and trame.
October 4, 2023
Wow, I'm so impressed by trame's impact.
We are at 30K downloads a month... If you are enjoying it, don't forget to add a star.
October 2, 2023
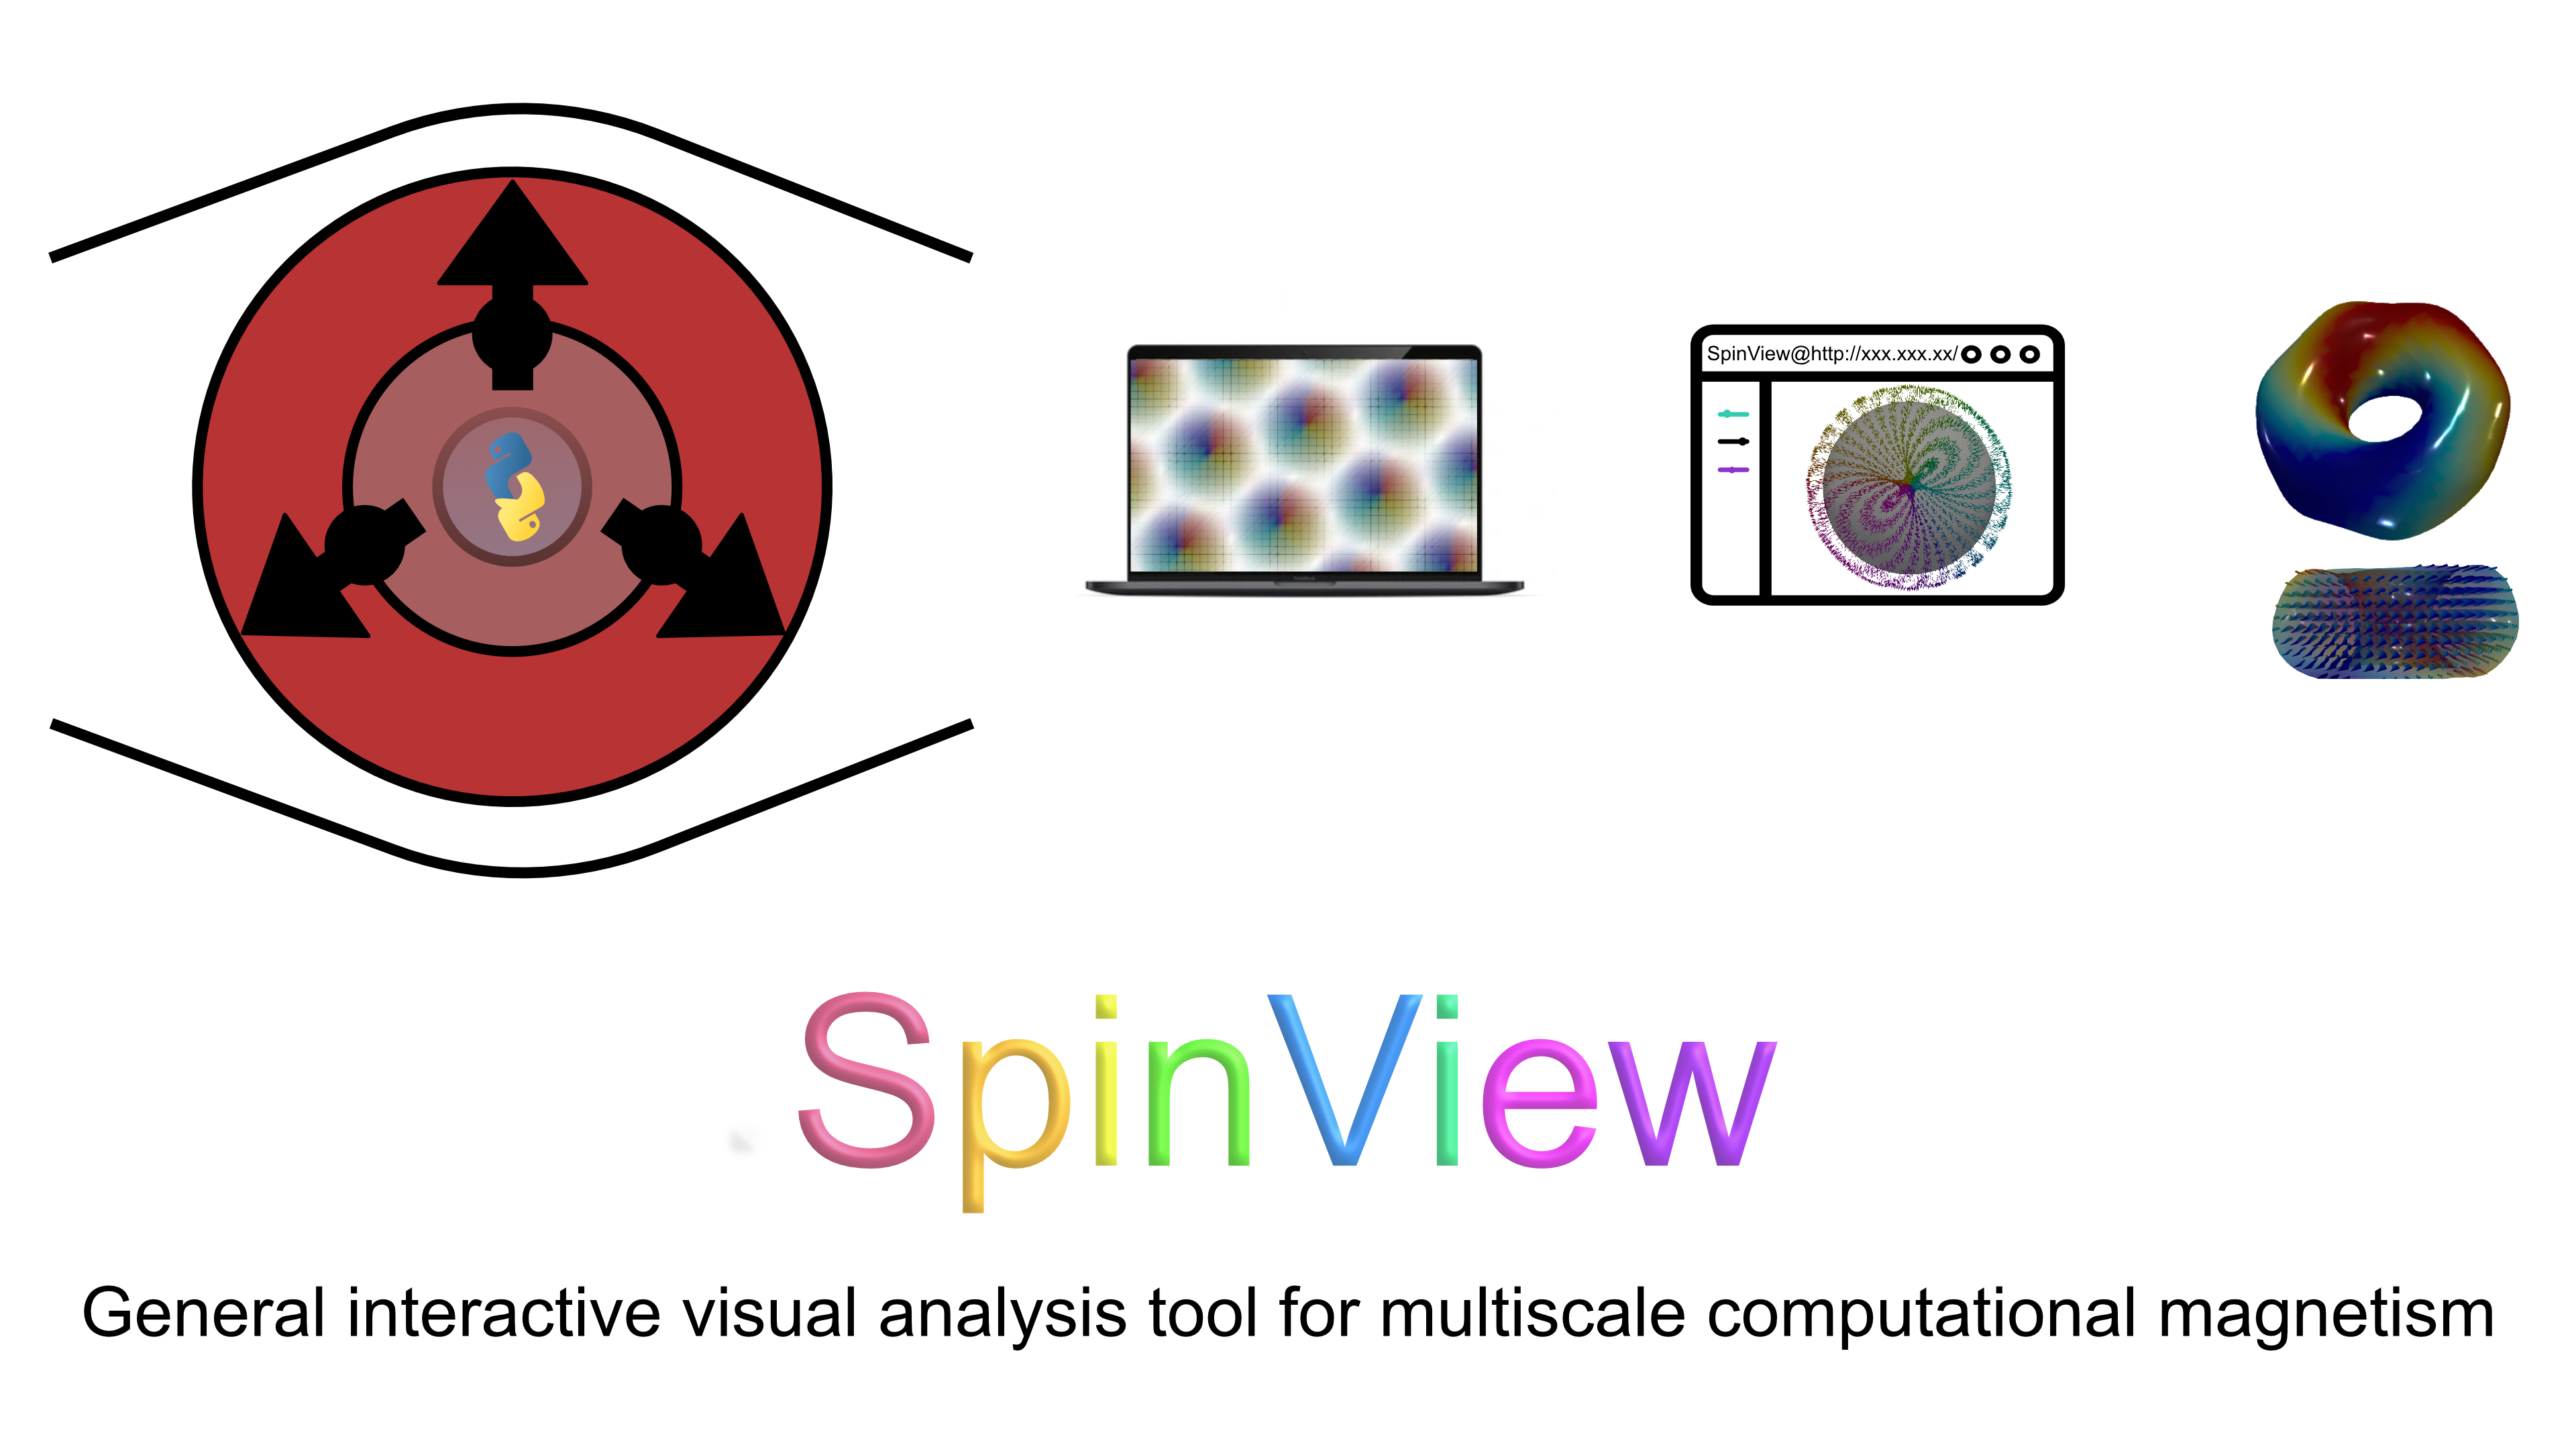
I always love seeing how trame gets used in the wild. This led me to add a community page to showcase your application. https://kitware.github.io/trame/examples/apps/community.html
So far, we have SpinView, a general interactive visual analysis tool developed for multiscale computational magnetism, which Qichen Xu developed at the KTH Royal Institute of Technology in Sweden.
September 22, 2023
13 Python Frameworks for Frontend Development: JavaScript Alternatives - Adejumo Ridwan Suleiman
If you are in a situation to create a dashboard, heavily based on data. I will suggest Trame as a goto option, it allows you to focus on your analysis while abstracting the complications of web development. Trame is built on Vuetify, which is a UI component framework built on Vue.
September 4, 2023
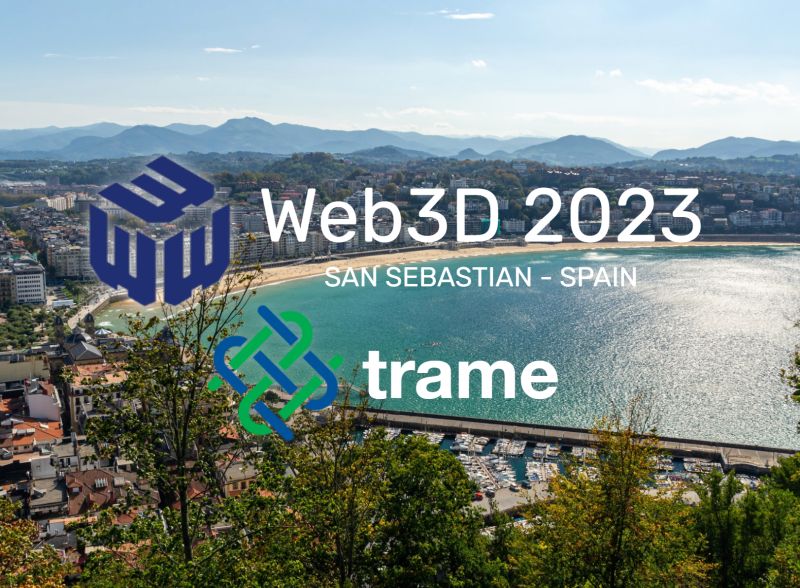
Kitware is delighted to announce that a trame tutorial will be given during the Siggraph Web3d conference in October of this year in San Sebastian, Spain.
We will present all our solutions for web scientific visualization and give a full hands-on tutorial about trame, i.e. how to bring your scientific data visualization onto the web, all through Python (no Javascript).
More about the Web3D conference that will happen in October 9-11 2023. (https://web3d.siggraph.org/)
September 2, 2023
While documentation is an ongoing process. I'm excited of the new trame website which includes a lot of examples and references to get started with trame.
August 2023
April 2023
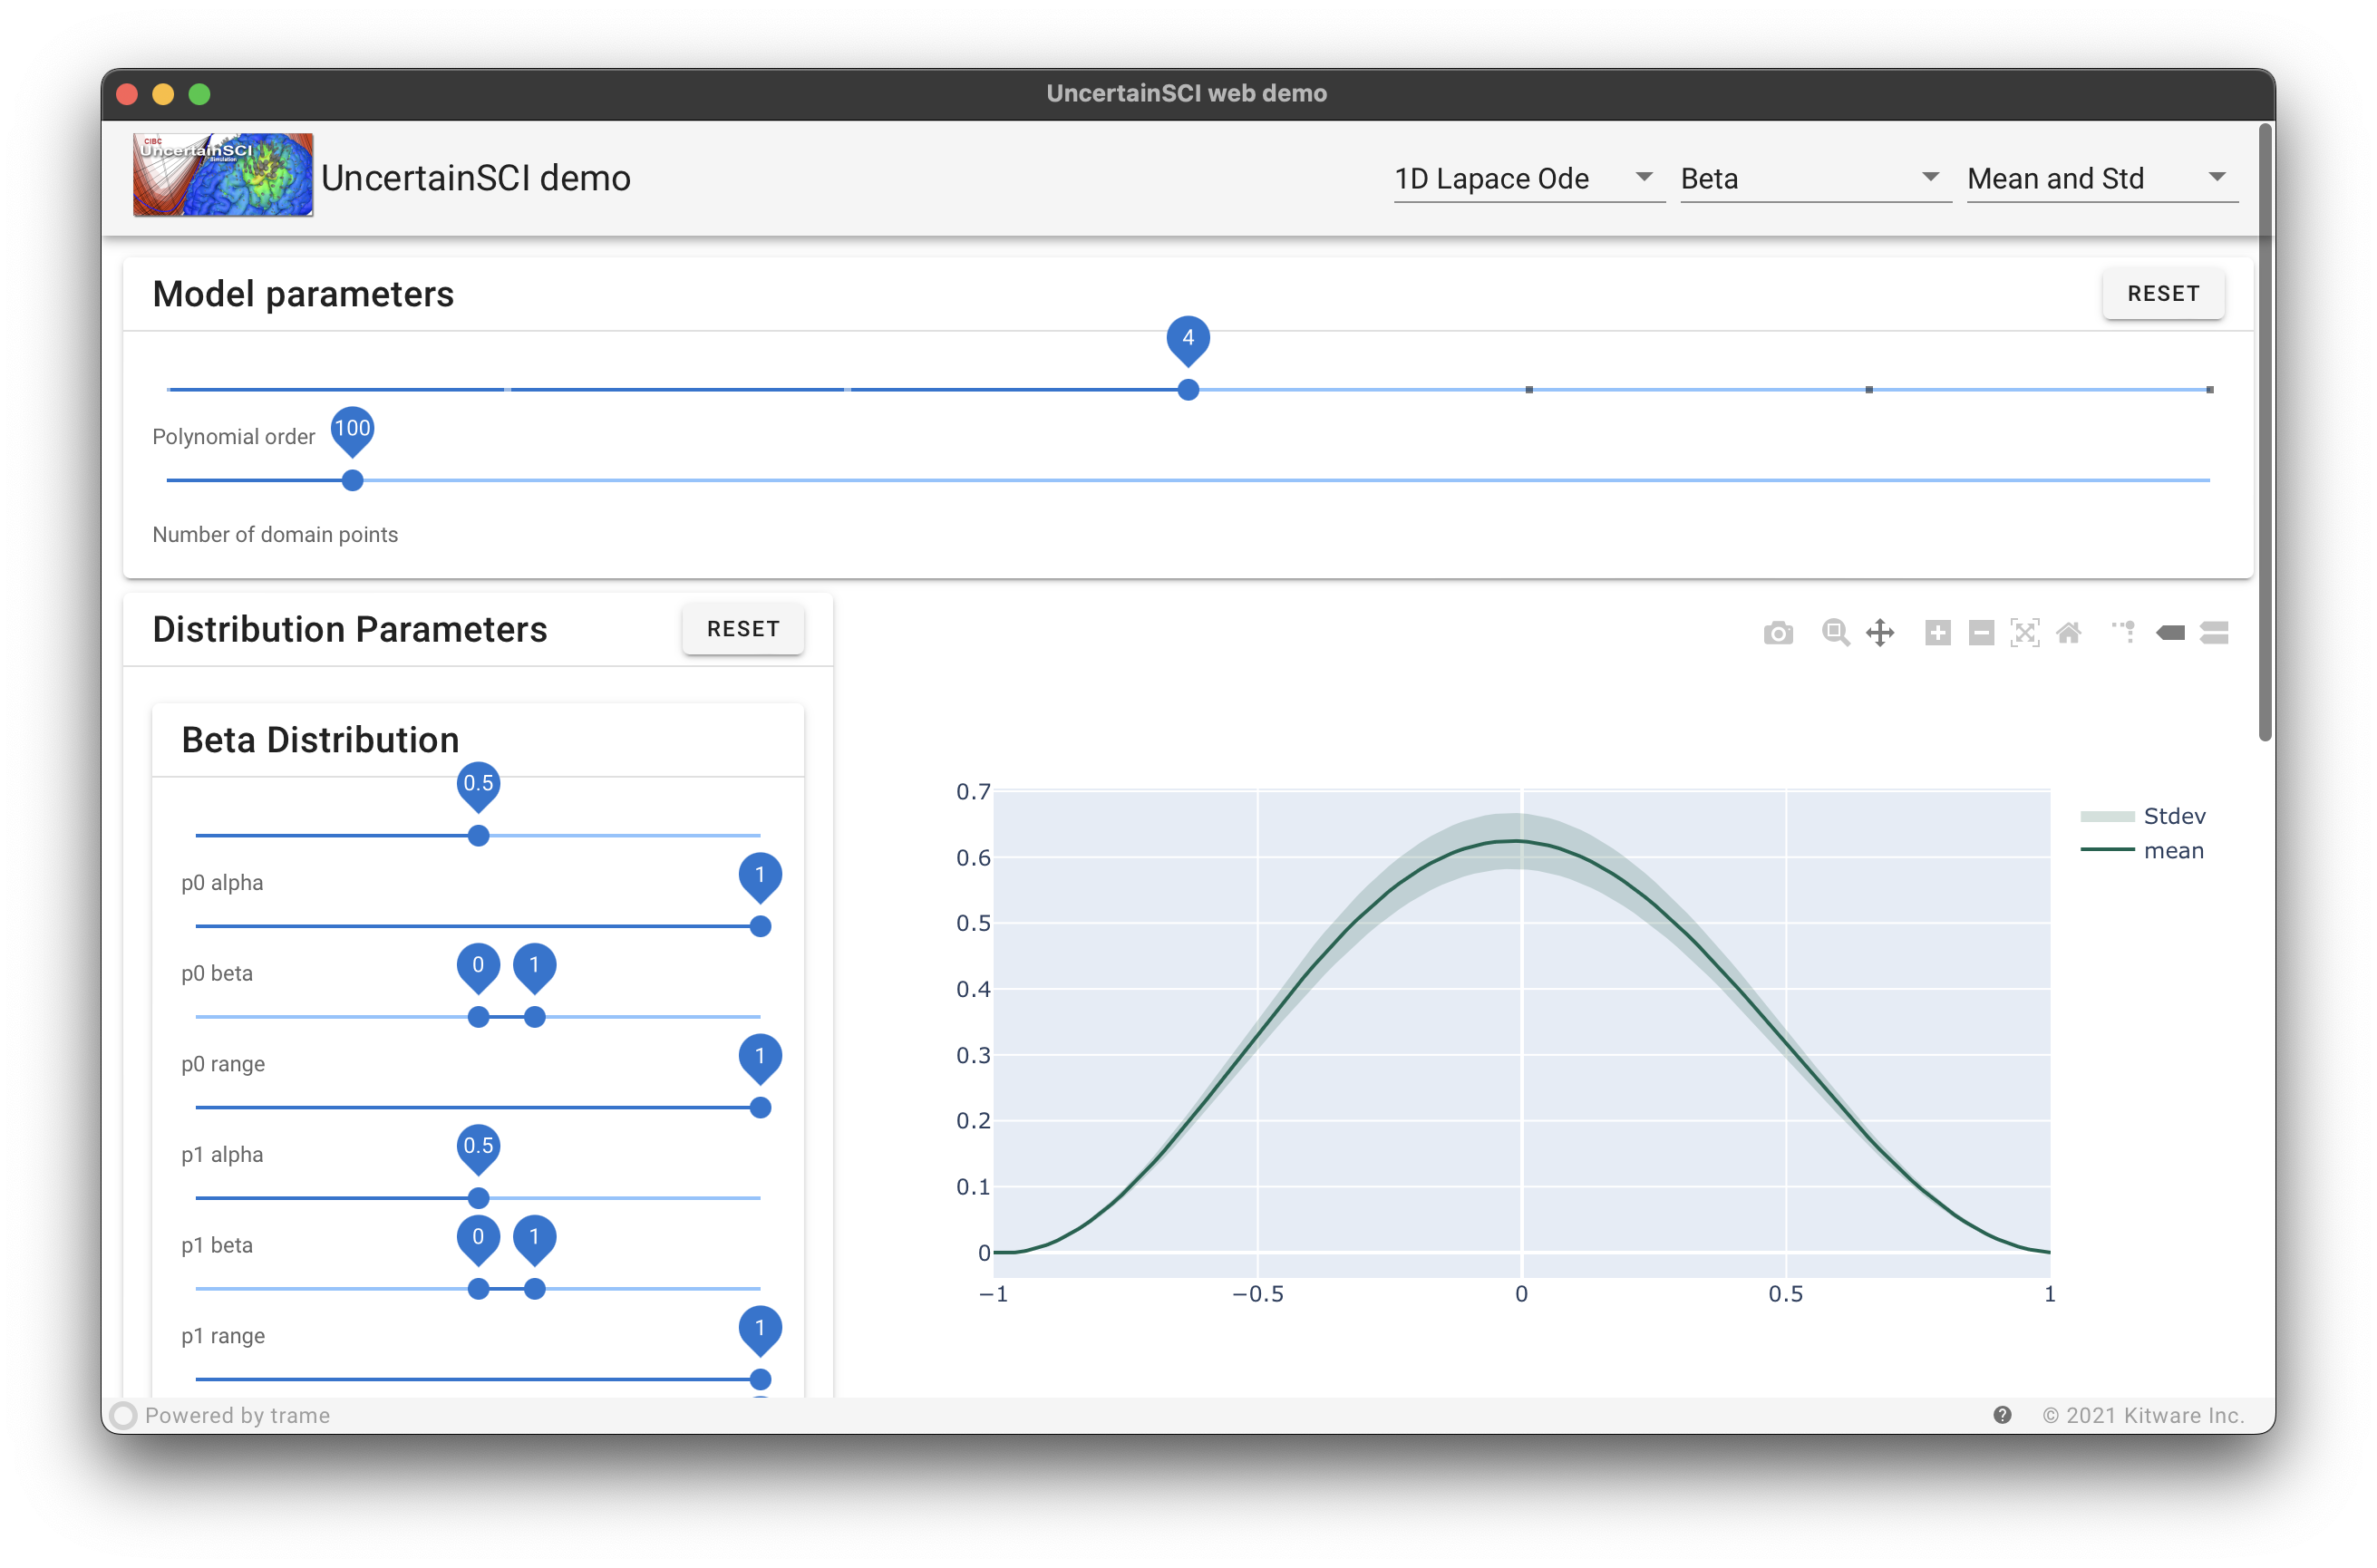
Webifying UncertainSCI Using Trame - Jess Tate
Web deployment of research tools has become increasingly important as the commercially available computing platforms become more diverse. However, the web deployment of Python packages and applications, especially with a GUI, has traditionally required significant training in javascript or a similar web language. Trame is a Python JavaScript integration framework that simplifies the GUI development and web deployment for Python apps. We used trame to deploy UncertainSCI, our Python package for uncertainty quantification (UQ), on web browser and cloud services.
UncertainSCI non-invasively computes forward model uncertainty propagated from input variability. It uses weighted approximate Fekete points (WAFP) to parsimoniously sample input parameter space, and polynomial chaos emulators (PCE) to accurately estimate model variation of complex computer simulations. UncertainSCI has been developed for use in 3D bioelectric field simulation to work with 3D biophysical models, balancing accurate multivariate analysis with computation cost.
The process of deploying UncertainSCI on the web was greatly facilitated by trame. Because trame interfaces with JavaScript packages such as vue.js, and vtk.js, we were able to implement a tailored interactive web-based GUI with Python code. Building and running a web app has been made simple through trame’s docker support, making deploying on webservice providers like AWS steamlined for low traffic use cases.
In this presentation, we will describe UncertainSCI, how we used trame to build web apps and web services, and how users can use UncertainSCI to perform UQ on their modeling pipelines.
December 5, 2022
Interactive Web-based 3D Visualization of large scientific datasets using Azure Batch
'/%3e%3cpath%20d='M703.07%20754.59H490.52c-2.37%200-4.74-.22-7.08-.67-2.33-.44-4.62-1.1-6.83-1.97s-4.33-1.95-6.34-3.21a38.188%2038.188%200%200%201-5.63-4.34l-241.2-225.26a17.423%2017.423%200%200%201-5.1-8.88%2017.383%2017.383%200%200%201%207.17-18.21c2.89-1.96%206.3-3.01%209.79-3.01h375.36l92.39%20265.56z'%20fill='%230078d4'/%3e%3cpath%20d='M504.27.4l-165.7%20488.69%20270.74-.06%2092.87%20265.56H490.43c-2.19-.02-4.38-.22-6.54-.61s-4.28-.96-6.34-1.72a38.484%2038.484%200%200%201-11.36-6.51L303.37%20593.79l-45.58%20134.42c-1.18%203.36-2.8%206.55-4.82%209.48a40.479%2040.479%200%200%201-16.05%2013.67%2040.03%2040.03%200%200%201-10.13%203.23H37.82c-6.04.02-12-1.42-17.37-4.2A37.664%2037.664%200%200%201%20.43%20722a37.77%2037.77%200%200%201%201.87-17.79L230.87%2026.58c1.19-3.79%202.98-7.36%205.3-10.58%202.31-3.22%205.13-6.06%208.33-8.4s6.76-4.16%2010.53-5.38S262.75.38%20266.72.4h237.56z'%20fill='url(%23b)'/%3e%3cpath%20d='M797.99%20704.82a37.847%2037.847%200%200%201%201.57%2017.64%2037.867%2037.867%200%200%201-6.65%2016.41%2037.691%2037.691%200%200%201-30.61%2015.72H498.48c5.98%200%2011.88-1.43%2017.21-4.16%205.32-2.73%209.92-6.7%2013.41-11.56s5.77-10.49%206.66-16.41.35-11.97-1.56-17.64L305.25%2026.05a37.713%2037.713%200%200%200-13.73-18.58c-3.18-2.29-6.7-4.06-10.43-5.26S273.46.4%20269.55.4h263.81c3.92%200%207.81.61%2011.55%201.81%203.73%201.2%207.25%202.98%2010.44%205.26%203.18%202.29%205.99%205.06%208.32%208.21s4.15%206.65%205.41%2010.37l228.95%20678.77z'%20fill='url(%23c)'/%3e%3c/svg%3e)
Scientific computing has long relied on high-performance computing (HPC) systems to accelerate scientific discovery. What constitutes an HPC system has continued to evolve. Access to computing keeps getting democratized and HPC is no longer limited to multi-billion dollar government laboratories and industries who can afford the infrastructure. Anyone with access to the Internet can now easily leverage the ubiquitous cloud for their computing task du jour! Azure natively supports HPC by providing hardware suitable for high performance computing needs together with software infrastructure to make it easy to harness these resources. In this post, we focus on one such Azure infrastructure component, Azure Batch, and see how it can be used to support a common use-case: data browser with interactive 3D visualization support.