

Plotly Charts
py
#!/usr/bin/env -S uv run --script
# -----------------------------------------------------------------------------
# /// script
# requires-python = ">=3.10"
# dependencies = [
#     "pandas",
#     "plotly",
#     "trame-plotly",
#     "trame-vuetify",
#     "trame[app]",
# ]
# ///
# -----------------------------------------------------------------------------
"""
Trame Plotly Chart Selector

Running with uv
   uv run ./00_plotly_charts_selector.py
   or ./00_plotly_charts_selector.py

Required Packages:
   pip install "trame[app]" trame-vuetify trame-plotly plotly pandas jupyterlab

Run as a Desktop Application:
   python 00_plotly_charts_selector.py --app

Run in Jupyter Lab / Notebook:
   Make sure this script ('00_plotly_charts_selector.py') is in the same directory as your notebook,
   or in a directory included in Python's path.
   Then, in a cell, execute:

   from 00_plotly_charts_selector import PlotlyViewer
   PlotlyViewer()

Run as a Web Application (default):
   python 00_plotly_charts_selector.py --server
   # Access via the URLs provided in the console (e.g., http://localhost:8080)
"""

from trame.app import TrameApp
from trame.decorators import change
from trame.ui.vuetify3 import SinglePageLayout
from trame.widgets import vuetify3, plotly

import plotly.express as px
import plotly.graph_objects as go

# -----------------------------------------------------------------------------
# Sample Plotly figures
# -----------------------------------------------------------------------------
SCATTER_MATRIX = px.scatter_matrix(
    px.data.iris(),
    dimensions=["sepal_width", "sepal_length", "petal_width", "petal_length"],
    color="species",
)
SCATTER_3D = px.scatter_3d(
    px.data.iris(),
    x="sepal_length",
    y="sepal_width",
    z="petal_width",
    color="petal_length",
    symbol="species",
)
BAR_CHART = go.Figure(
    data=[go.Bar(x=[1, 2, 3], y=[1, 3, 2])], layout_title_text="A Bar Chart"
)
CONTOUR_PLOT = go.Figure(
    data=[
        go.Contour(
            z=[
                [10, 10.625, 12.5, 15.625, 20],
                [5.625, 6.25, 8.125, 11.25, 15.625],
                [2.5, 3.125, 5.0, 8.125, 12.5],
                [0.625, 1.25, 3.125, 6.25, 10.625],
                [0, 0.625, 2.5, 5.625, 10],
            ]
        )
    ]
)
CONTOUR_PLOT.update_layout(title_text="Contour Plot")

PLOTS = {
    "Contour": CONTOUR_PLOT,
    "Scatter3D": SCATTER_3D,
    "ScatterMatrix": SCATTER_MATRIX,
    "BarChart": BAR_CHART,
}

# -----------------------------------------------------------------------------
# Trame Application
# -----------------------------------------------------------------------------


class PlotlyViewer(TrameApp):
    def __init__(self, server=None):
        super().__init__(server, client_type="vue3")
        self._build_ui()

    @change("active_plot_name")
    def update_plot_figure(self, active_plot_name, **_):
        figure_data = PLOTS.get(active_plot_name)
        if figure_data:
            self.ctx.plotly_display.update(figure_data)

    def _build_ui(self):
        with SinglePageLayout(self.server, full_height=True) as self.ui:
            self.ui.title.set_text("Trame ❤️ Plotly")
            self.ui.icon.hide()

            with self.ui.toolbar:
                vuetify3.VSpacer()
                vuetify3.VSelect(
                    v_model=("active_plot_name", "Contour"),
                    items=("plots", list(PLOTS.keys())),
                    hide_details=True,
                    density="compact",
                    style="max-width: 200px;",
                    variant="outlined",
                    classes="mr-4",
                )

            with self.ui.content:
                plotly.Figure(
                    ctx_name="plotly_display",
                    display_logo=False,
                    display_mode_bar=True,
                )


# -----------------------------------------------------------------------------
# Main
# -----------------------------------------------------------------------------


def main(**kwargs):
    app = PlotlyViewer()  # Instantiate the class, passing the server
    app.server.start(**kwargs)  # Start the specific server instance


if __name__ == "__main__":
    main()
py
r"""
Installation requirements:
pip install trame trame-vuetify trame-components trame-plotly
"""
import numpy as np
import pandas as pd
import plotly.figure_factory as ff
import plotly.graph_objects as go
from trame.app import get_server
from trame.ui.vuetify import SinglePageLayout
from trame.widgets import plotly, trame, vuetify
# -----------------------------------------------------------------------------
# Trame setup
# -----------------------------------------------------------------------------
server = get_server(client_type="vue2")
state, ctrl = server.state, server.controller
# -----------------------------------------------------------------------------
# Charts handling
# -----------------------------------------------------------------------------
contour_raw_data = pd.read_json(
"https://raw.githubusercontent.com/plotly/datasets/master/contour_data.json"
)
scatter_raw_data = pd.read_json(
"https://raw.githubusercontent.com/plotly/datasets/master/scatter_data.json"
)
polar_data = pd.read_csv(
"https://raw.githubusercontent.com/plotly/datasets/master/polar_dataset.csv"
)
scatter_data = scatter_raw_data["Data"]
def clean_data(data_in):
"""
Cleans data in a format which can be conveniently
used for drawing traces. Takes a dictionary as the
input, and returns a list in the following format:
input = {'key': ['a b c']}
output = [key, [a, b, c]]
"""
key = list(data_in.keys())[0]
data_out = [key]
for i in data_in[key]:
data_out.append(list(map(float, i.split(" "))))
return data_out
def create_ternary_fig(width=300, height=300, **kwargs):
contour_dict = contour_raw_data["Data"]
# Defining a colormap:
colors = [
"#8dd3c7",
"#ffffb3",
"#bebada",
"#fb8072",
"#80b1d3",
"#fdb462",
"#b3de69",
"#fccde5",
"#d9d9d9",
"#bc80bd",
]
colors_iterator = iter(colors)
fig = go.Figure()
for raw_data in contour_dict:
data = clean_data(raw_data)
a = [inner_data[0] for inner_data in data[1:]]
a.append(data[1][0]) # Closing the loop
b = [inner_data[1] for inner_data in data[1:]]
b.append(data[1][1]) # Closing the loop
c = [inner_data[2] for inner_data in data[1:]]
c.append(data[1][2]) # Closing the loop
fig.add_trace(
go.Scatterternary(
text=data[0],
a=a,
b=b,
c=c,
mode="lines",
line=dict(color="#444", shape="spline"),
fill="toself",
fillcolor=colors_iterator.__next__(),
)
)
fig.update_layout(
margin=dict(l=50, r=50, t=50, b=50),
width=width,
height=height,
)
return fig
def create_polar_fig(width=300, height=300, **kwargs):
fig = go.Figure()
fig.add_trace(
go.Scatterpolar(
r=polar_data["x1"].tolist(),
theta=polar_data["y"].tolist(),
mode="lines",
name="Figure 8",
line_color="peru",
)
)
fig.add_trace(
go.Scatterpolar(
r=polar_data["x2"].tolist(),
theta=polar_data["y"].tolist(),
mode="lines",
name="Cardioid",
line_color="darkviolet",
)
)
fig.add_trace(
go.Scatterpolar(
r=polar_data["x3"].tolist(),
theta=polar_data["y"].tolist(),
mode="lines",
name="Hypercardioid",
line_color="deepskyblue",
)
)
fig.update_layout(
# title = 'Mic Patterns',
margin=dict(l=20, r=20, t=20, b=20),
showlegend=False,
width=width,
height=height,
)
return fig
def create_streamline_fig(width=100, height=100, **kwargs):
x = np.linspace(-3, 3, 100)
y = np.linspace(-3, 3, 100)
Y, X = np.meshgrid(x, y)
u = -1 - X**2 + Y
v = 1 + X - Y**2
# Create streamline figure
fig = ff.create_streamline(
x.tolist(),
y.tolist(),
u.tolist(),
v.tolist(),
arrow_scale=0.1,
)
fig.update_layout(
# title = 'Mic Patterns',
margin=dict(l=20, r=20, t=10, b=10),
showlegend=False,
width=width,
height=height,
)
return fig
def create_contour_fig(width=100, height=100, **kwargs):
fig = go.Figure(
data=go.Contour(
z=[
[2, 4, 7, 12, 13, 14, 15, 16],
[3, 1, 6, 11, 12, 13, 16, 17],
[4, 2, 7, 7, 11, 14, 17, 18],
[5, 3, 8, 8, 13, 15, 18, 19],
[7, 4, 10, 9, 16, 18, 20, 19],
[9, 10, 5, 27, 23, 21, 21, 21],
[11, 14, 17, 26, 25, 24, 23, 22],
],
contours={
"coloring": "heatmap",
"showlabels": True,
"labelfont": {
"size": 12,
"color": "black",
},
},
line_smoothing=1,
)
)
fig.update_layout(
# title = 'Mic Patterns',
margin=dict(l=20, r=20, t=10, b=10),
showlegend=False,
width=width,
height=height,
)
return fig
# -----------------------------------------------------------------------------
# Callbacks
# -----------------------------------------------------------------------------
@state.change("contour_size")
def update_contour_size(contour_size, **kwargs):
if contour_size is None:
return
ctrl.update_contour(create_contour_fig(**contour_size.get("size")))
@state.change("stream_size")
def update_stream_size(stream_size, **kwargs):
if stream_size is None:
return
ctrl.update_stream(create_streamline_fig(**stream_size.get("size")))
@state.change("polar_size")
def update_polar_size(polar_size, **kwargs):
if polar_size is None:
return
ctrl.update_polar(create_polar_fig(**polar_size.get("size")))
@state.change("ternary_size")
def update_ternary_size(ternary_size, **kwargs):
if ternary_size is None:
return
ctrl.update_ternary(create_ternary_fig(**ternary_size.get("size")))
# -----------------------------------------------------------------------------
# GUI
# -----------------------------------------------------------------------------
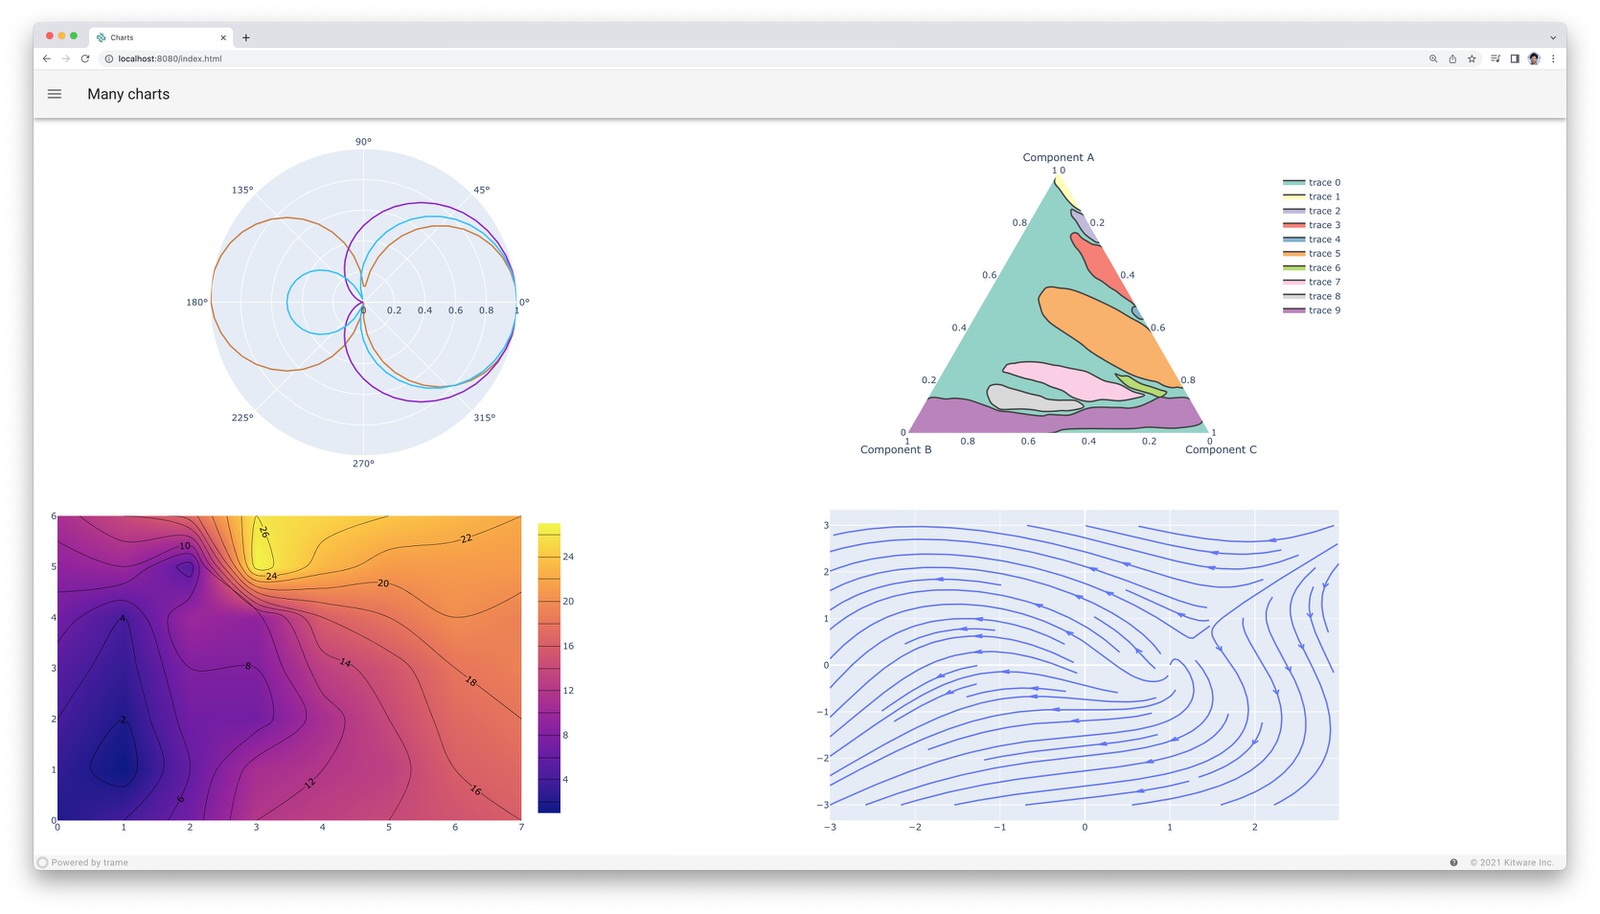
state.trame__title = "Charts"
with SinglePageLayout(server) as layout:
layout.title.set_text("Many charts")
with layout.content:
with vuetify.VContainer(fluid=True, classes="fill-height"):
with vuetify.VRow(style="height: 50%;"):
with vuetify.VCol():
with trame.SizeObserver("polar_size"):
ctrl.update_polar = plotly.Figure(
display_mode_bar=("false",),
).update
with vuetify.VCol():
with trame.SizeObserver("ternary_size"):
ctrl.update_ternary = plotly.Figure(
display_mode_bar=("false",),
).update
with vuetify.VRow(style="height: 50%;"):
with vuetify.VCol():
with trame.SizeObserver("contour_size"):
ctrl.update_contour = plotly.Figure(
display_mode_bar=("false",),
).update
with vuetify.VCol():
with trame.SizeObserver("stream_size"):
ctrl.update_stream = plotly.Figure(
display_mode_bar=("false",),
).update
# -----------------------------------------------------------------------------
# Main
# -----------------------------------------------------------------------------
if __name__ == "__main__":
server.start()