Customizing Individual Views 
Each viewport panel (i.e., each contour plot displayed on a global or regional map) can be customized independently by clicking its colorbar. This opens a pop-up panel, as illustrated in the screenshot below, with the selected plot shown on the right and a control panel on the left. The control panel provides options for modifying how variable values are mapped to colors. The cross (✕) icon in the upper-right corner closes the pop-up panel.
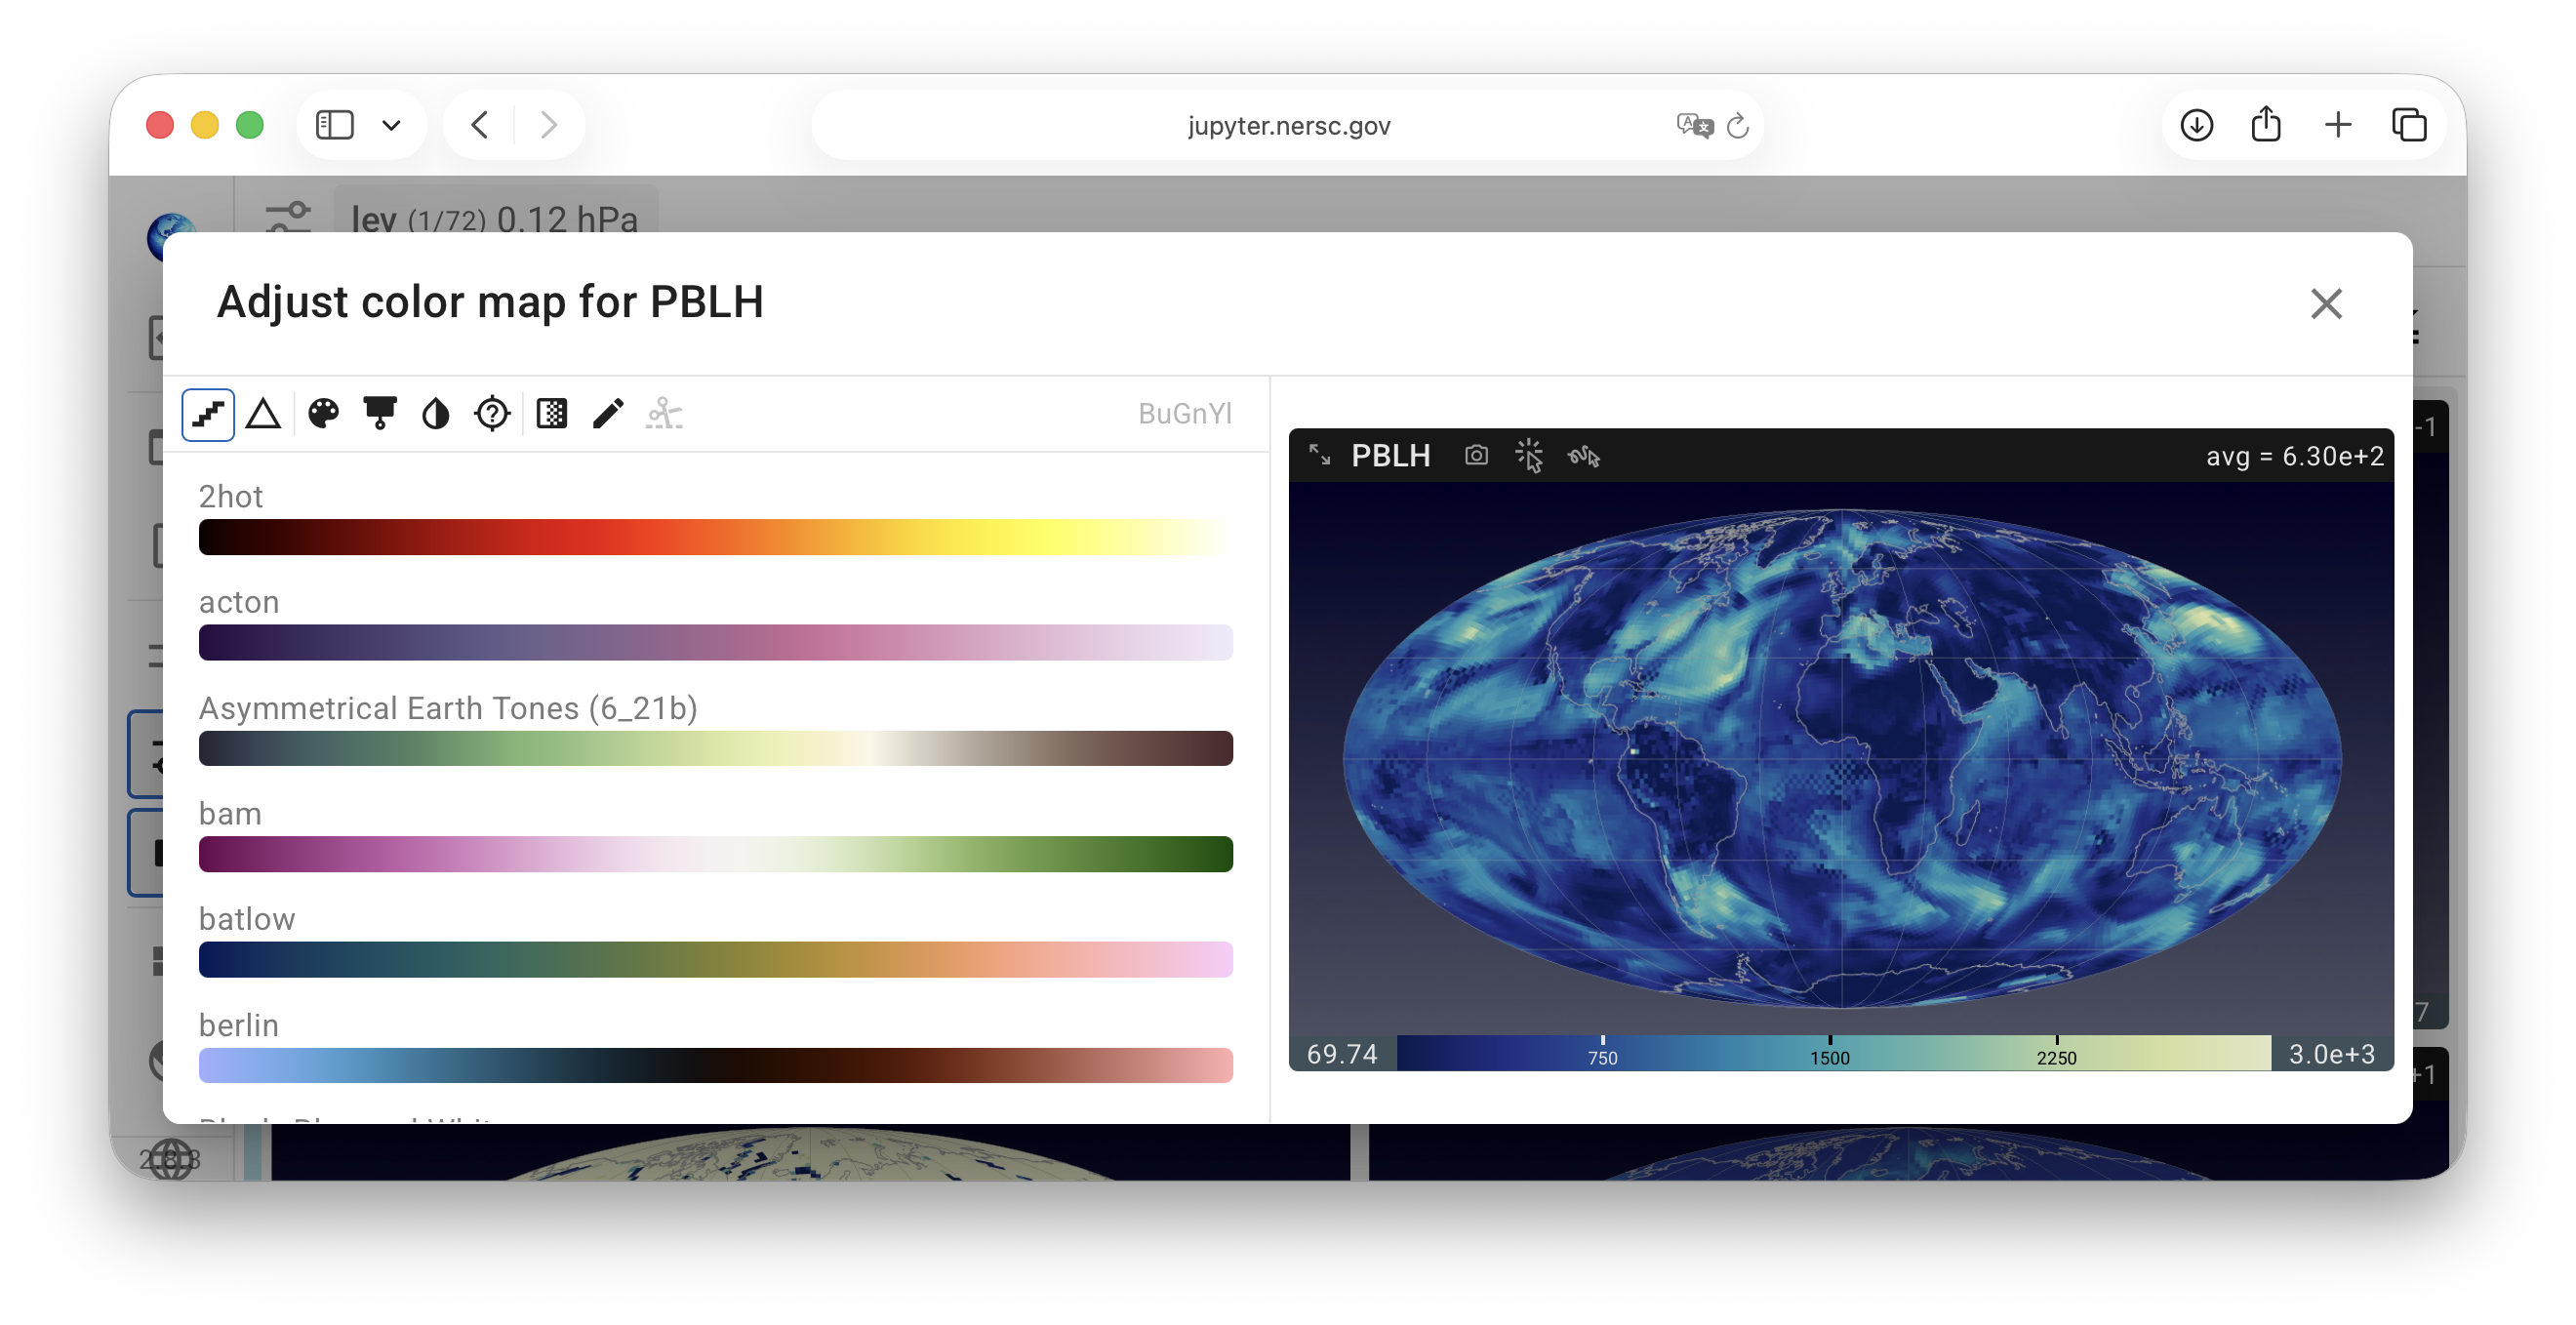
The color map control panel contains up to three sections arranged from top to bottom:
Toolbar — This includes a row of icon buttons across the top (explained in more detail below), a colormap search field showing the name of the colormap currently in use, and a cross icon (✕) for dismissing the control panel.
Settings panels — Context-sensitive input boxes that appear below the toolbar depending on which icon buttons in the toolbar have been activated.
Colormap list — A scrollable list of colormap swatches, potentially filtered, for the user to choose from. A click on a swatch applies the colormap immediately.
Tips:
- Most of the icon buttons are toggles, i.e., switches between two options. When the activated mode matches the meaning depicted by the icon, the icon is highlighted with a blue frame.
- A few of the icon buttons open dropdown menus upon click. Once the user makes a selection, the dropdown closes automatically.
- Some of the buttons correspond to incompatible functionalities, hence activating one button might result in another button to be disabled and shown in gray.
More details are provided below.
Linear vs. logarithmic scales 
![]()
QuickView supports linear, logarithmic, and symmetric logarithmic color scaling.
By default, a linear scale is used, indicated by a staircase-style icon in the pop-up panel.
A click on the staircase icon changes the scaling to logarithmic to enhance the visibility of variations across multiple orders of magnitude. In this mode, zeros and negative values are displayed in the NaN color explained below.
Because standard logarithmic scaling is only defined for positive values, QuickView also provides a symmetric logarithmic (“symlog”) scale, which accommodates negative values and zero. The symlog scale behaves linearly in a small region around zero and logarithmically away from zero, enabling consistent visualization of fields that include both positive and negative values. More details can be found in the info box below.
linthresh in symmetric log scale
In the symmetric log scale, the parameter linthresh defines the boundary between the linear and logarithmic regions of the transformation used for color mapping. Values with absolute values smaller than linthresh are treated quasi-linearly, while values with absolute values equal to or greater than linthresh are spaced logarithmically in the colormap. In the trame-colormaps package used by QuickView, linthresh is set to the smallest absolute value among all nonzero elements of an array, with "nonzero" defined as having a magnitude larger than machine zero. This ensures the log region begins exactly where the data's smallest meaningful magnitude starts.
Delta difference mode 
When the Δ icon is activated, a diverging colormap is used and the colorbar is centered at zero. A settings panel is displayed, allowing the user to enter a maximum absolute value (|max|) for colormapping, as well as an ε tolerance so that values within the range of [-ε, ε] are considered effectively zero and are displayed in the color at the center of the colormap, as demonstrated in the right half of the screenshot below.
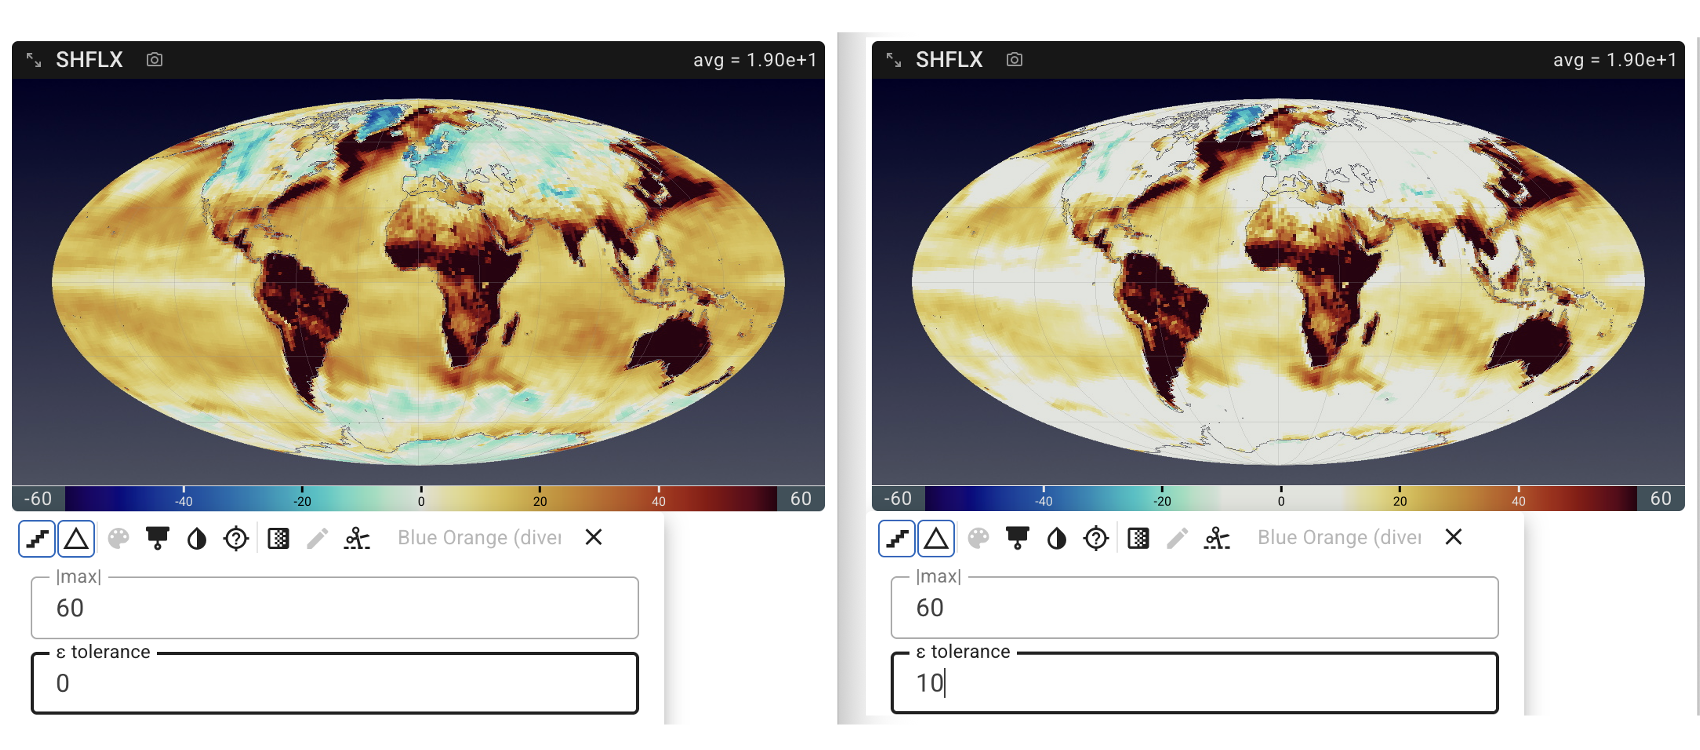
Additional notes:
- The delta difference mode is disabled (grayed out) when a log scale is selected. In reverse, after a user turns on the delta difference mode when using a linear or symlog scale, the scale button will only toggle between linear and symlog scales.
- In the delta difference mode, the colormap swatches displayed are limited to diverging-only.
Color selection 
The following icon buttons are provided for selecting and adjusting colormaps:
| Icon | Short name | Description |
|---|---|---|
| Colormap category | Opens a dropdown for user to select from one of the supported categories: Sequential, Multi-Sequential, Diverging, and Cyclic). Default is Sequential. This button is disabled in Δ difference mode, as the category is automatically set to diverging in that mode. | |
| Colorblind-safe | Limits the displayed colormap list to colorblind-safe options within the active category. | |
| Invert colormap | Reverses the colormap direction, both in the colorbar and in the displayed colormap list). | |
| NaN color | Opens a dropdown for the user to select the color for NaN/missing data. Default is transparent. Color list is pretty long and is scrollable. | |
| Discrete bands | Switches between continuous gradient and discrete color banding. When activated, the number of color bands can be adjusted in Settings panel. | |
| Custom range | Toggles between min/max bounds found in data or specified by user. Disabled in Δ mode, as a maximum absolute value value and an ε tolerance are used in that mode. | |
| Cut or clamp | Switches between clamp mode (where out-of-range values get endpoint colors) and cut mode (where out-of-range values get the NaN color). Disabled unless Custom Range or Δ difference mode is active. |
Further reading 
The functionalities described above are made available in QuickView through the trame-colormaps package. Further information about that package can be found in its separate GitHub repo.