Miscellaneous Features 
QuickView includes various convenient features tailored to Earth system modelers' analysis workflow.
Cursor probe 
Starting in version 2.8.3, QuickView provides a Cursor Probe for inspecting data values at the cursor location. Two modes are available:
| Icon | Mode | Description |
|---|---|---|
| Hover Mode | Updates continuously as the cursor moves over contour plots in the viewport. | |
| Click Mode | Updates only when the user clicks a location in a contour plot. This mode may provide better responsiveness when working with very large datasets. |
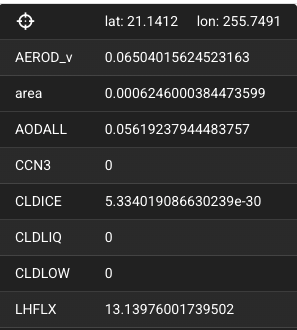
In both modes, information associated with the cursor location is displayed in an Information Panel, as shown in the screenshot here. The latitude and longitude of the cursor location are shown at the top, followed by the name and value of the variable in the current view, as well as the names and values of the other variables displayed in the viewport. If a variable has non-horizontal dimensions, the value shown in the Information Panel is the value at the cursor-selected lat-lon location in the currently data slice.
![]()
The Cursor Probe is inactive by default and can be activated by clicking either the Hover Mode or Click Mode icon in any viewport panel. These icons are available in all views for convenient access. However, the probe's activate/inactive state applies to the entire viewport and is shared across all views. As a result, the Cursor Probe cannot be enabled for some views (variables) while remaining disabled for others.
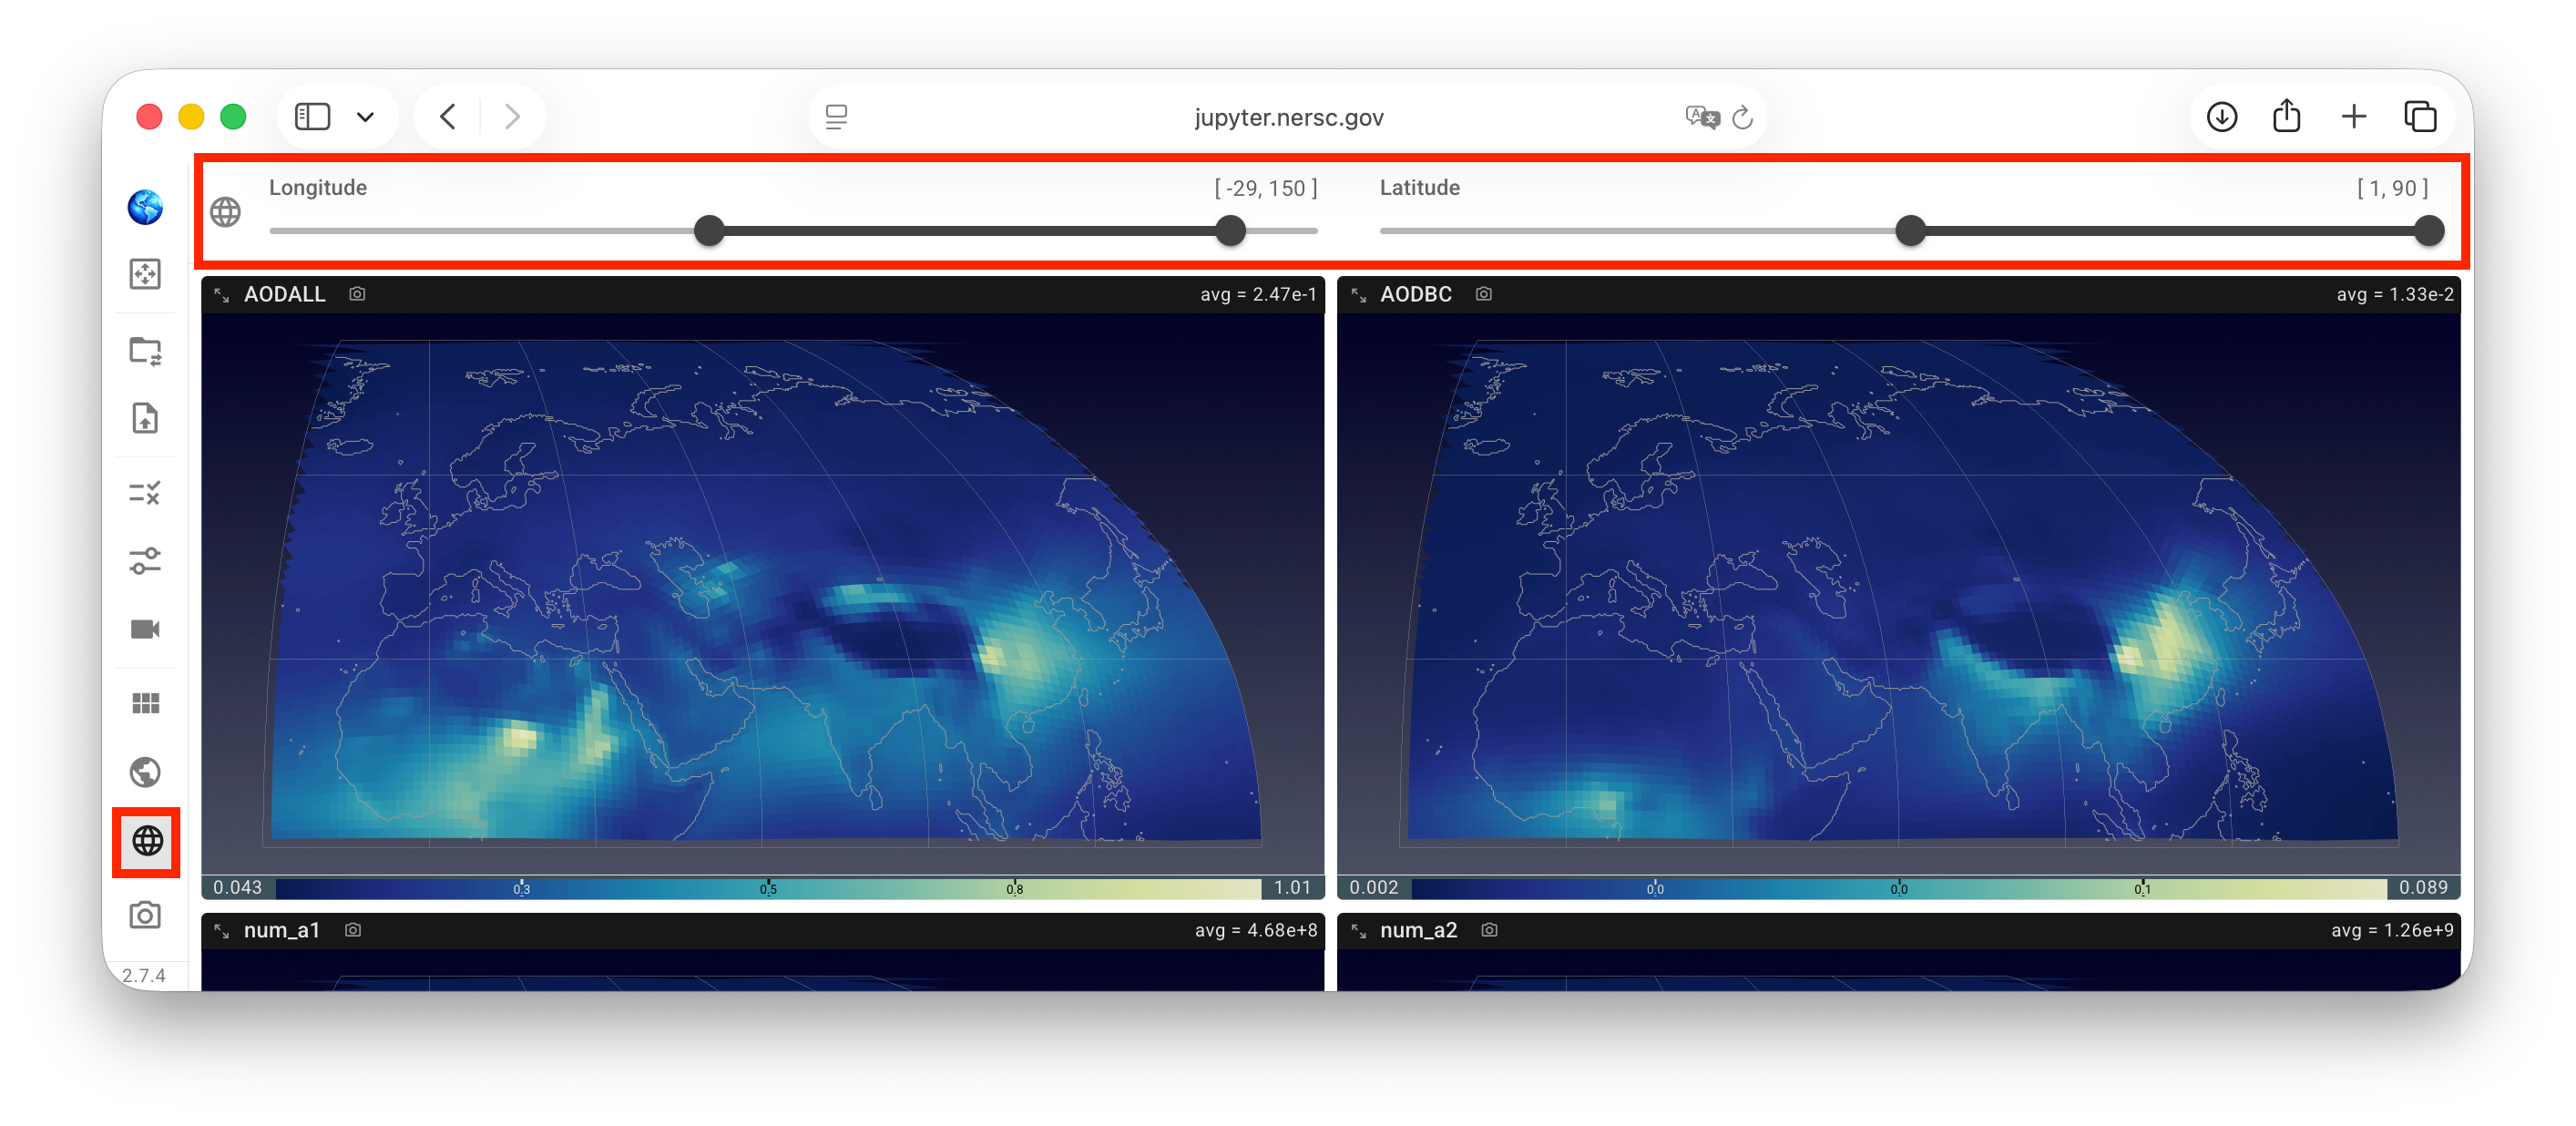
Choosing map projection and geographical region 
The map projection used for the contour plots can be changed using the mini menu activated by a click on the Earth icon in the vertical tool bar—or by keyboard shortcuts:
Cfor cylindrical equidistant,Rfor Robinson, andMfor Mollweide.
The geographical region, i.e., the latitude and longitude bounds to be displayed in the contour plots, can be adjusted using the sliders in the lat/lon cropping panel activated by a click on the Earth grid icon in the vertical toolbar.
Saving the visualization 
In addition to saving the state of the current session so that the analysis can be resumed later, QuickView provides three ways for the user to save the visualization as images or animations for presentations and manuscripts, etc.:
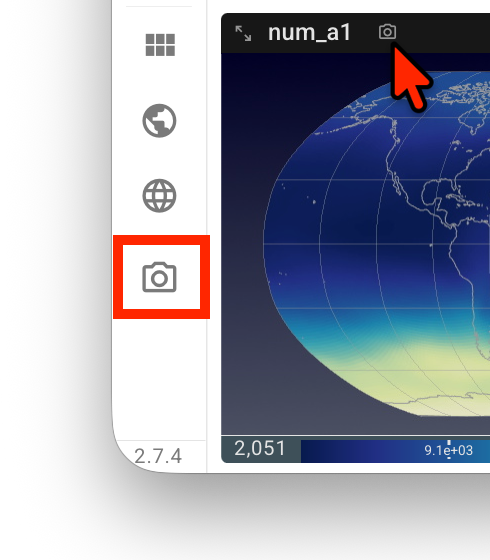
A click on the camera icon at the end of the vertical toolbar saves the entire viewport—in its current layout—to the local computer as
Viewport.png.A click on the camera icon next to the variable name inside a view panel saves that single view as a
.pngfile. The file name starts with the variable name; dimension names and indices are appended when relevant. For example,aero_tau_sw-lev-71-swband-00.pngis an image of variableaero_tau_swatlevindex 71 andswbandindex 0.Let us assume the user has been inspecting 4 variables along the
levdimension, as depicted by the screenshot here. To export animations showing how these variables change in that dimension, the user can click on the icon on the right end of the animation control panel, i.e., the downward arrow with two lines, to bring up a drop-down menu and then click to selectViewportand/or individual variables. Subsequently, a click onExport animationtriggers QuickView to scan through the indices in thelevdimension, with a dark-red circle spinning around the download button while the scan is in progress. After the scan is finished, a filequickview-animation.zipgets downloaded to the local computer. This file is a zipped folder that may contain multiple files.
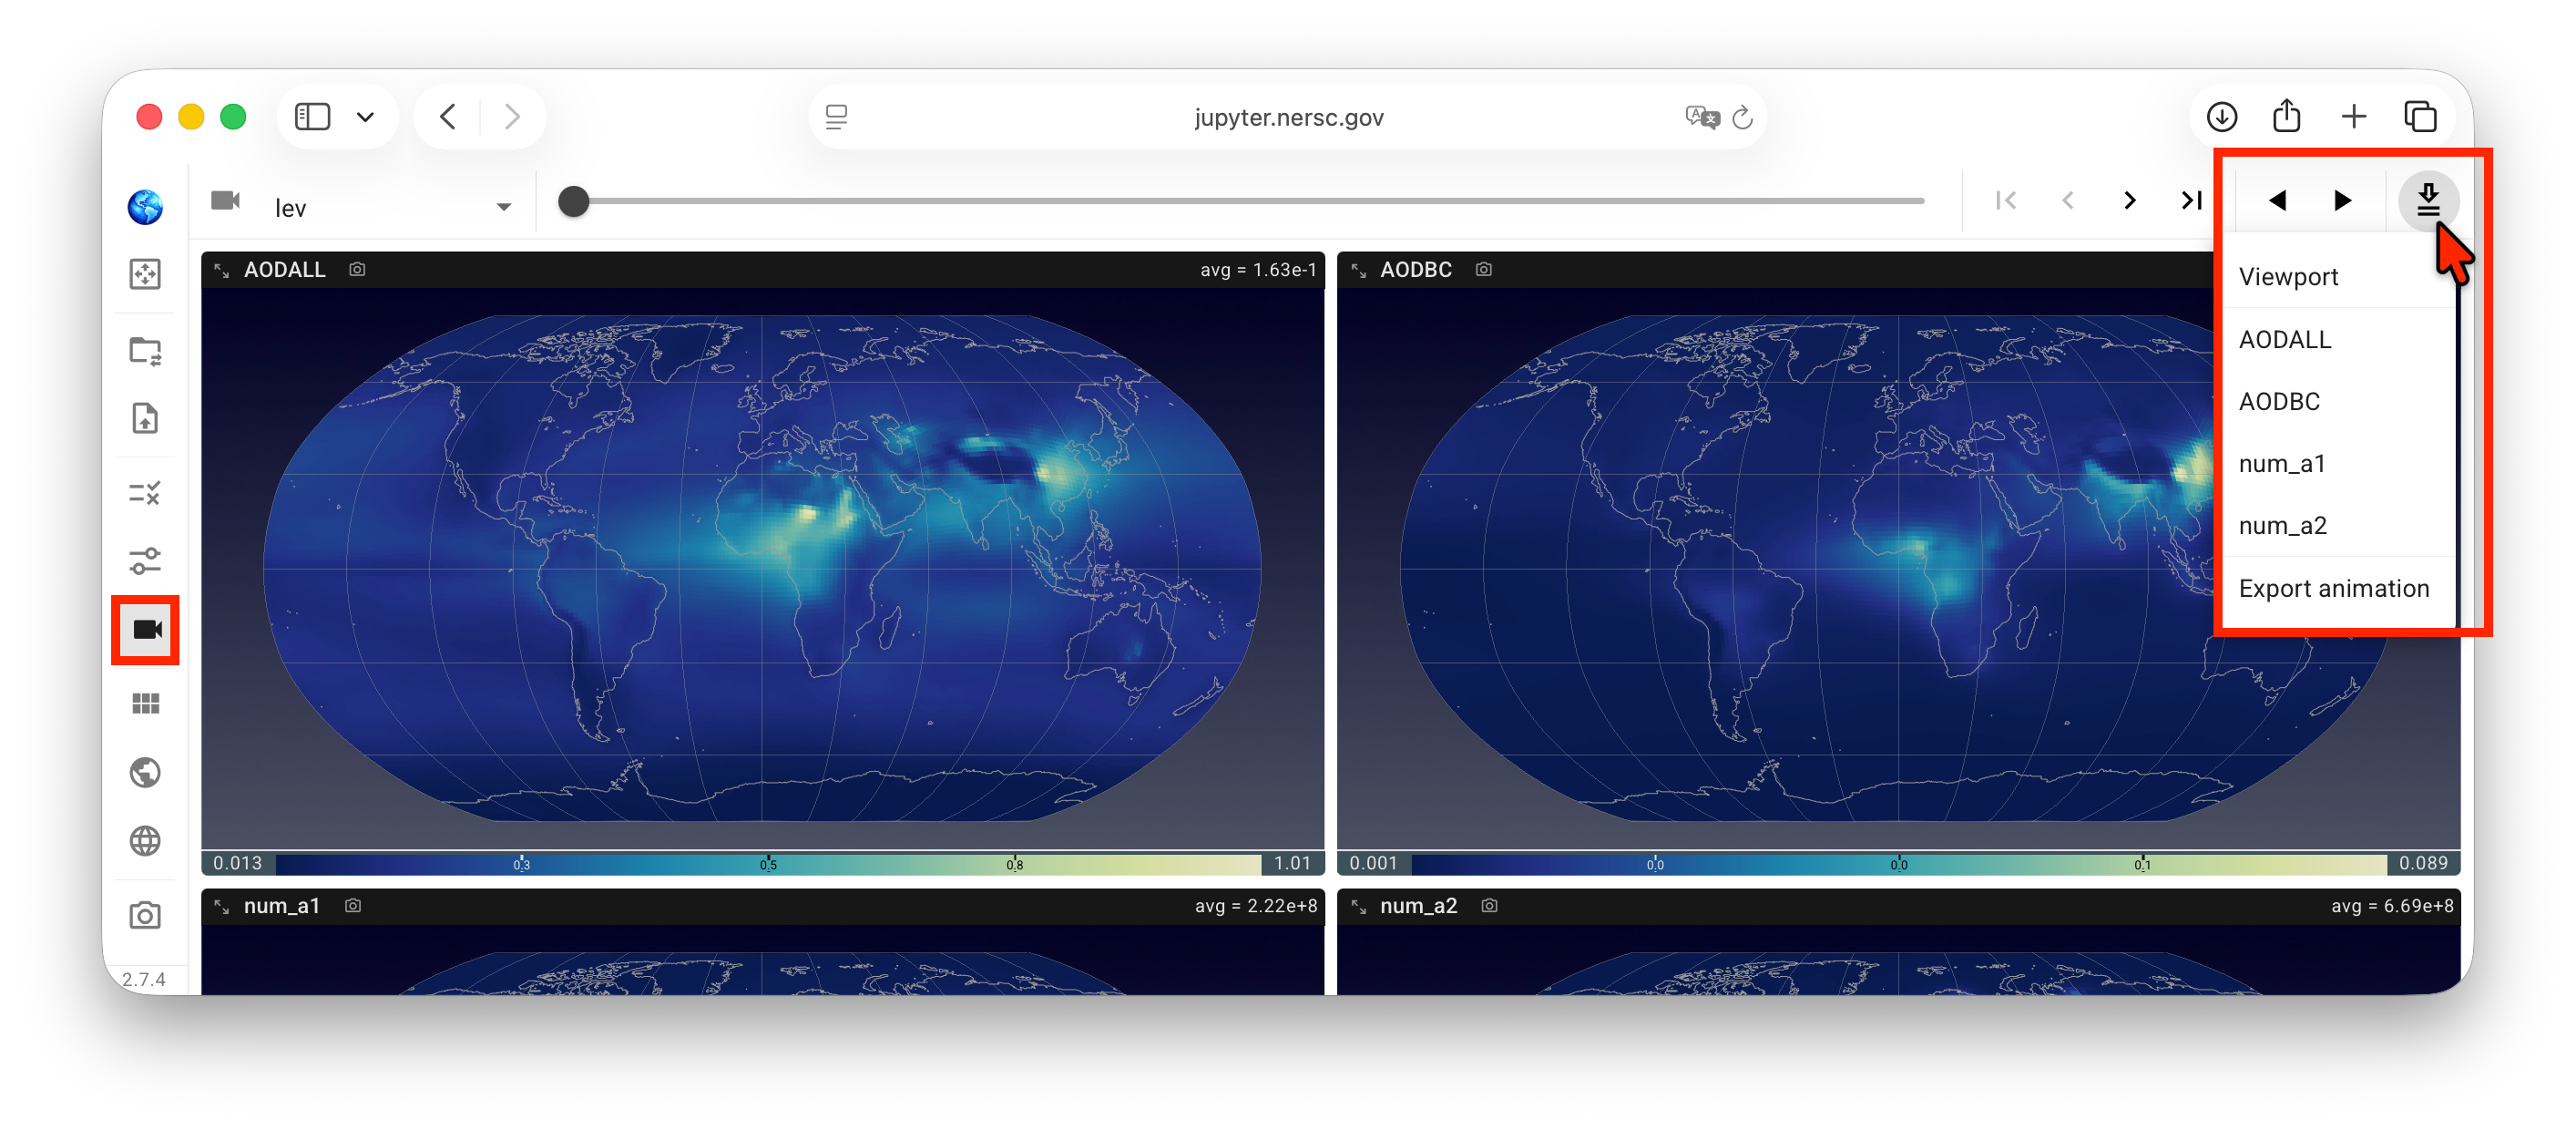
Note: as of version 2.6.1, the animation export downloads images of individual frames to the local computer, and the user needs to use a tool to combine the images into an animation (or animations). Direct download of animation files will be provided soon.

If the user clicks the animation download button again while the dark-red circle is still spinning, the click will end the scan. A .zip file will still be downloaded and will contain images from index 0 to the last index that QuickView has scanned.