QuickCompare's Graphical UI 
UI components 
QuickCompare's UI closely resembles the UI in QuickView:
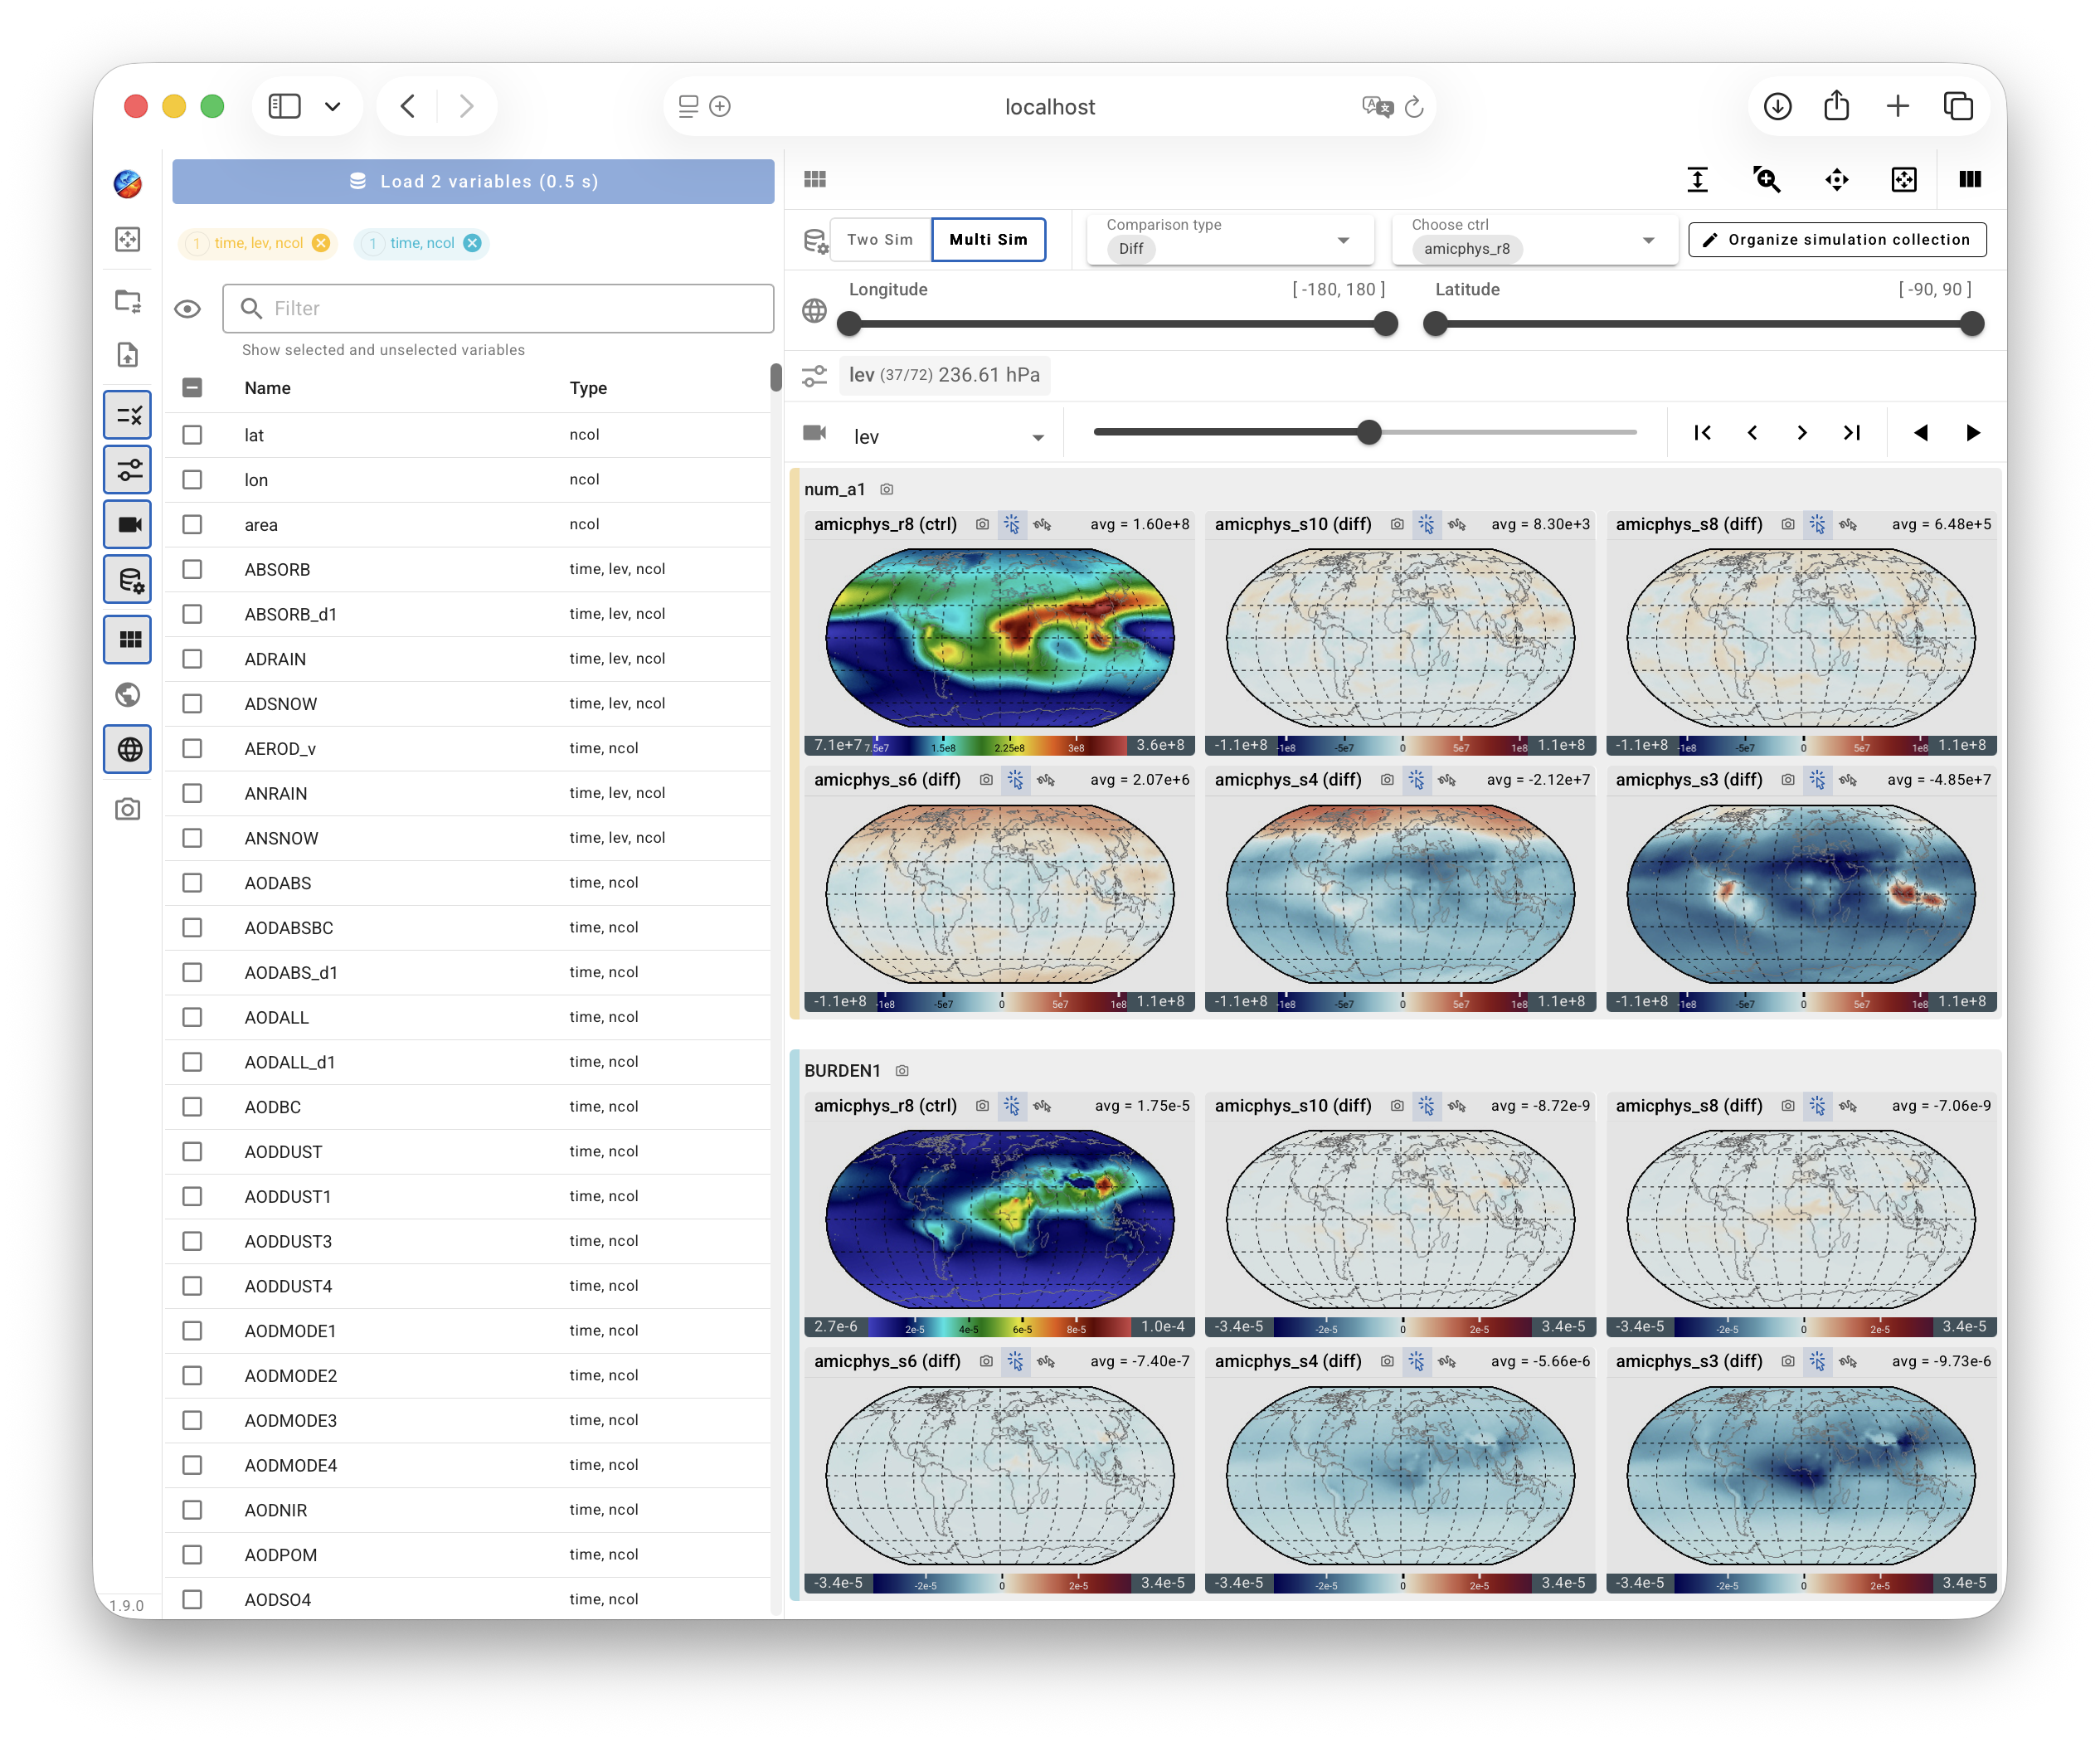
The Viewport displays contour plots on global or regional maps.
Various Control Panels are provided for choosing and arranging the contents displayed in the Viewport as well as the properties of the contour plots. The control panels can be collapsed (hidden) or expanded (shown) by clicking on their corresponding icons in the toolbar or by using keyboard shortcuts.
The Main Toolbar placed vertically on the left side of the UI contains various buttons that either activate pop-up menus on click or serve as toggles for showing or hiding Control Panels. The toolbar is shown in a collapsed mode by default, but will change into an expanded mode if the user clicks on the QuickCompare icon at the top of the toolbar or press the
Hkey on the keyboard.
The only differences between the QuickCompare UI and the QuickView UI have to do with the fact that QuickCompare displays multiple simulations and, optionally, their differences.

A Comparison button is included in the Main Toolbar, and the corresponding control panel shows different contents depending on whether the user has chosen a two-simulation comparison mode or a multi-simulation (ensemble) comparison mode, as shown by the two screenshots below.
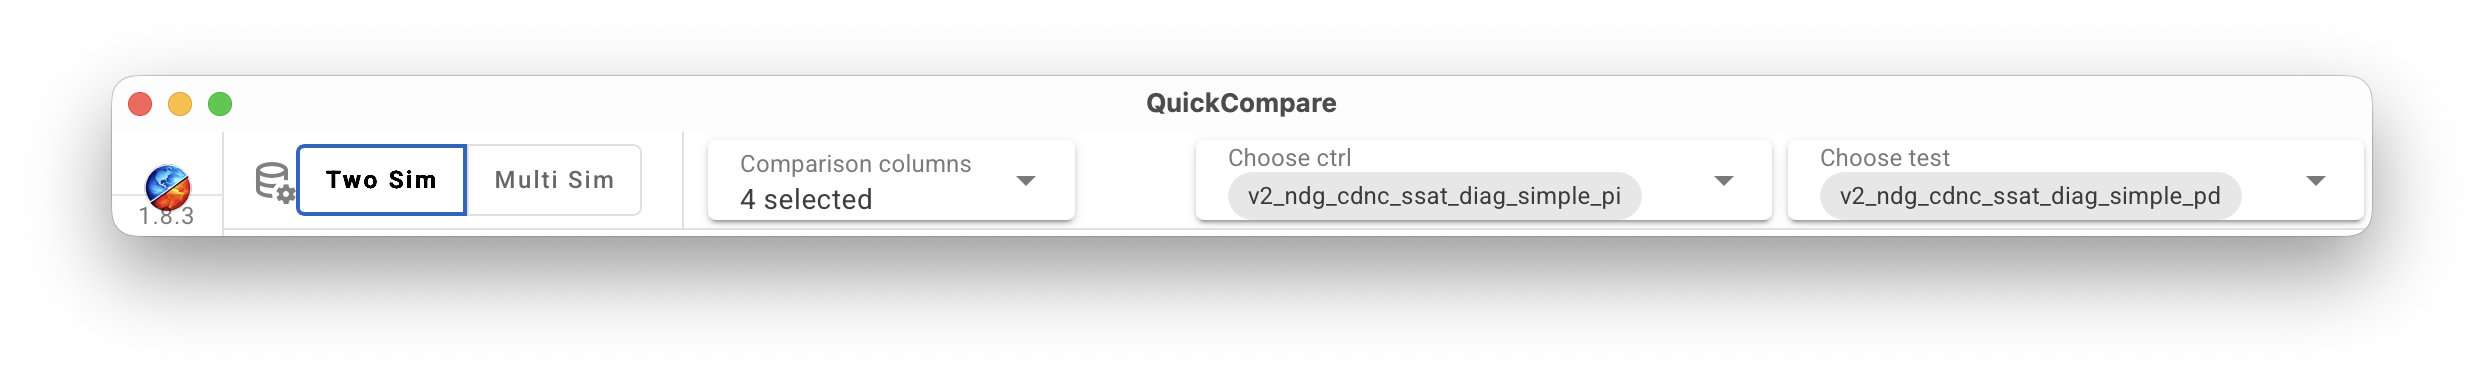
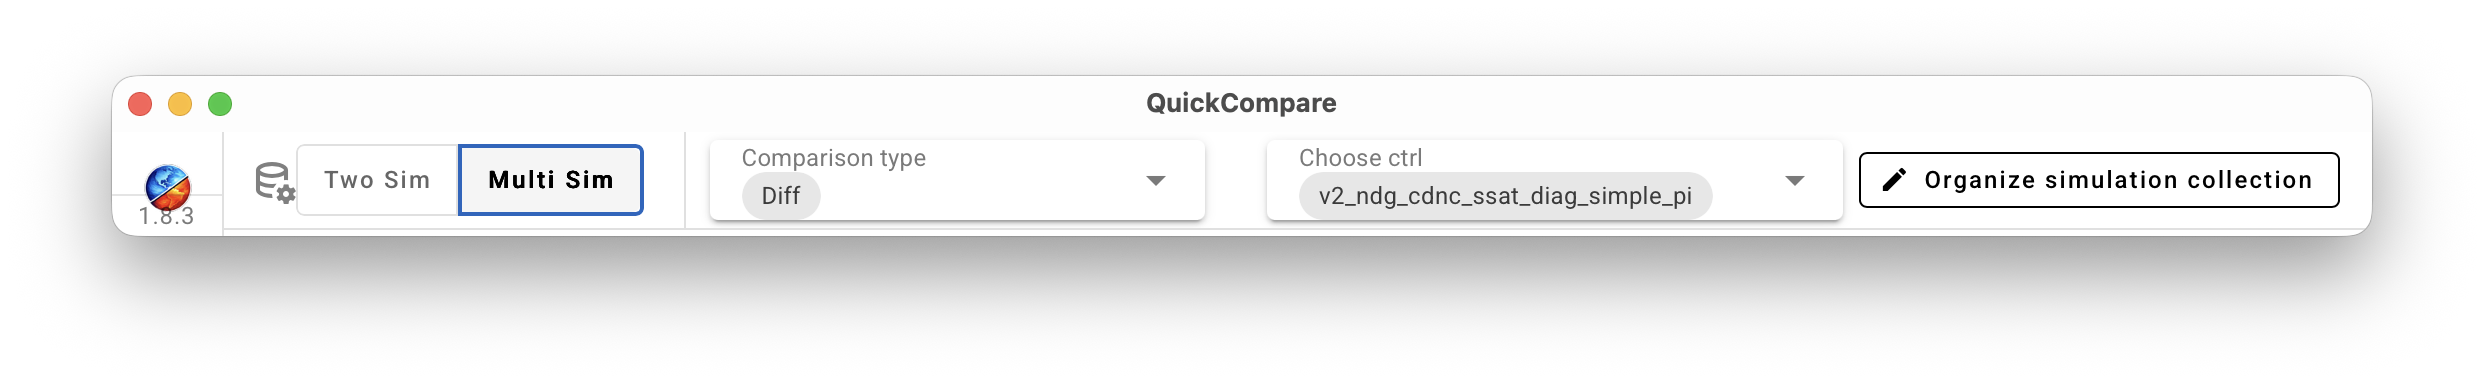
Contents in the viewport are organized differently in these two modes. More details can be found through the following links:
Keyboard shortcuts 
Keyboard shortcuts are the same as in QuickView, except that an additional shortcut, the space key, can be used for expanding or hiding the Comparison Control Panel.