QuickView's Graphical UI 
UI components 
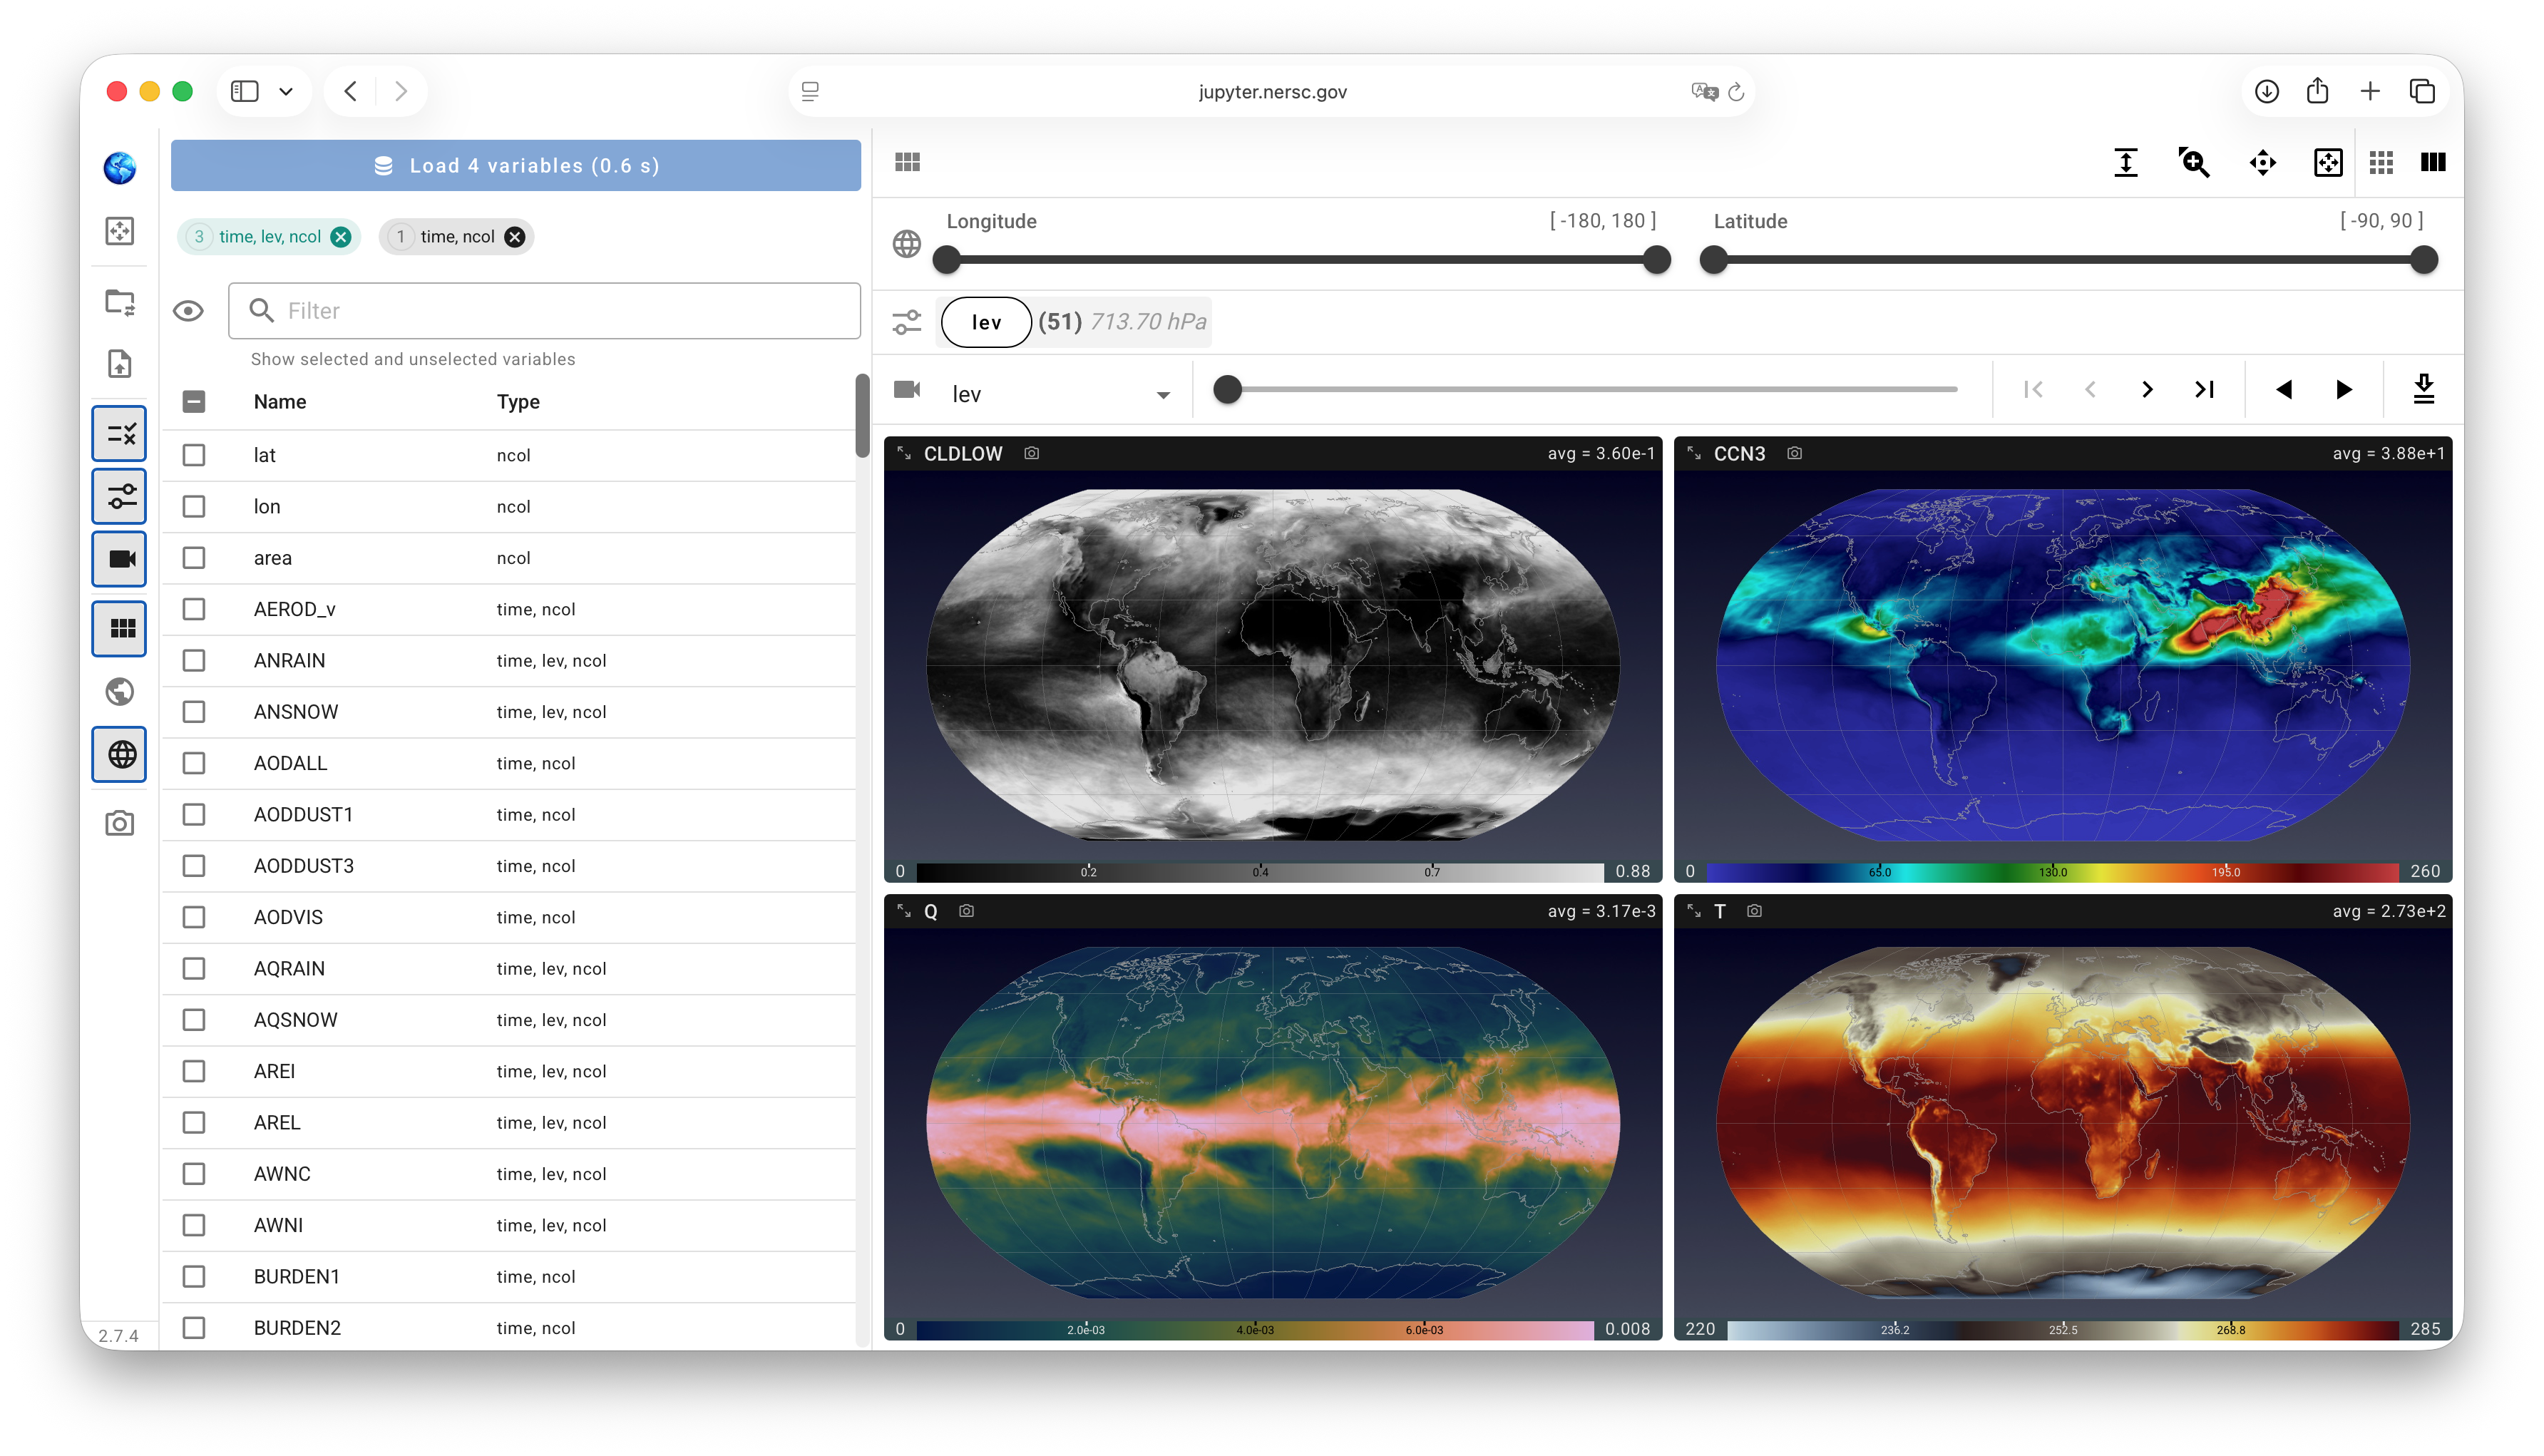
QuickView's UI contains three main components.
- Viewport: The viewport displays contour plots on global or regional maps for the user-selected physical quantities (variables in the NetCDF files). The sequence of the displayed variables and the size of the contour plots can be adjusted using the viewport layout control panel. For each variable shown on a map, the colormap, value ranges etc. can be adjusted individually using the pop-up panel activated by a click on the colorbar.
Control panels: QuickView includes various control panels for changing the properties of contour plots shown in the viewport. The control panels can be collapsed (hidden) or expanded (shown) by clicking on their corresponding icons in the toolbar or by using keyboard shortcuts.
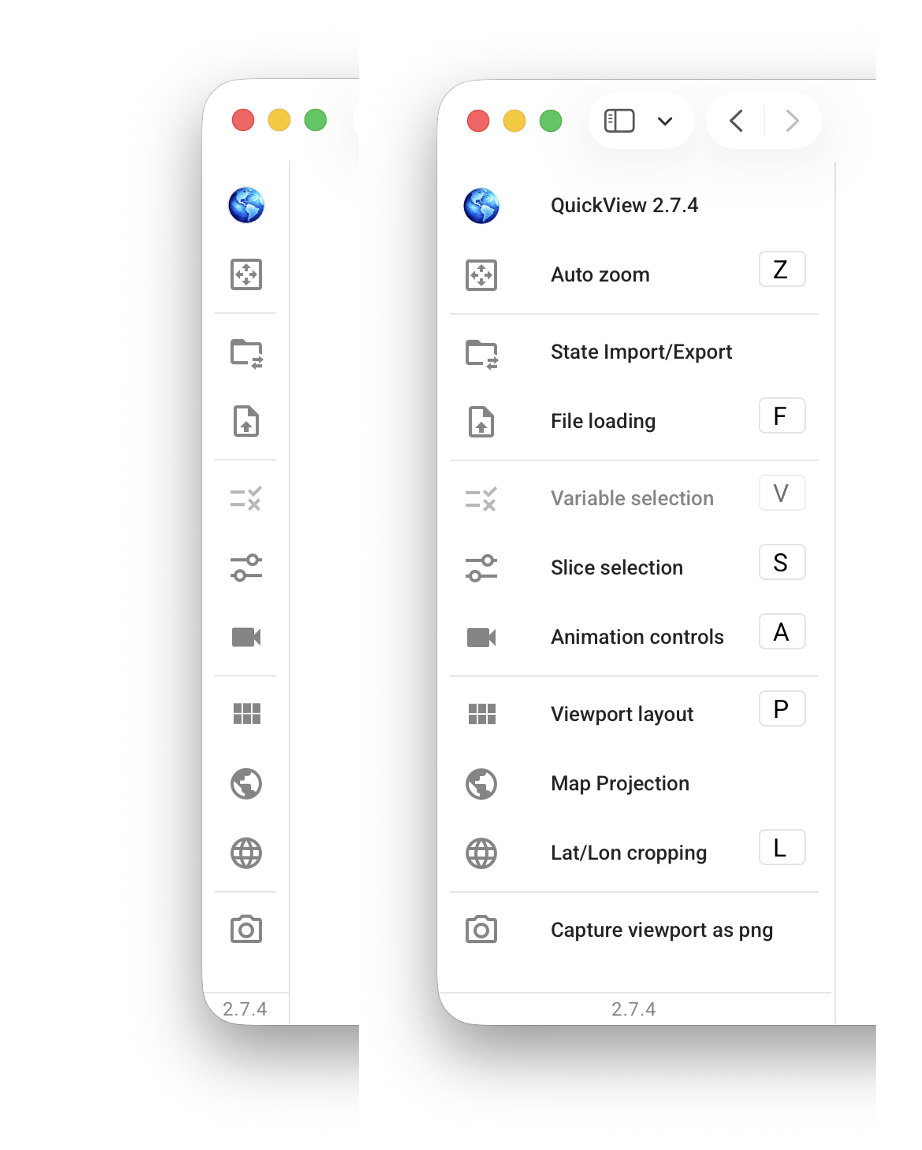
Main toolbar: The vertical toolbar located on the left of the UI contains various buttons that either activate pop-up menus on a single click or serve as toggles for showing or hiding control panels. The toolbar is shown in a collapsed mode by default, but will change into an expanded mode if the user clicks on the colorful QuickView icon at the top of the toolbar or press the
Hkey on the keyboard.