
Comparing Multiple Simulations 
For inspecting an ensemble of simulations, QuickCompare assumes that one simulation is designated as the control simulation (ctrl) and treats all remaining simulations as test simulations. The following sections on this page explain how the viewport is organized and how the user can interact with it.
Control and test simulations 
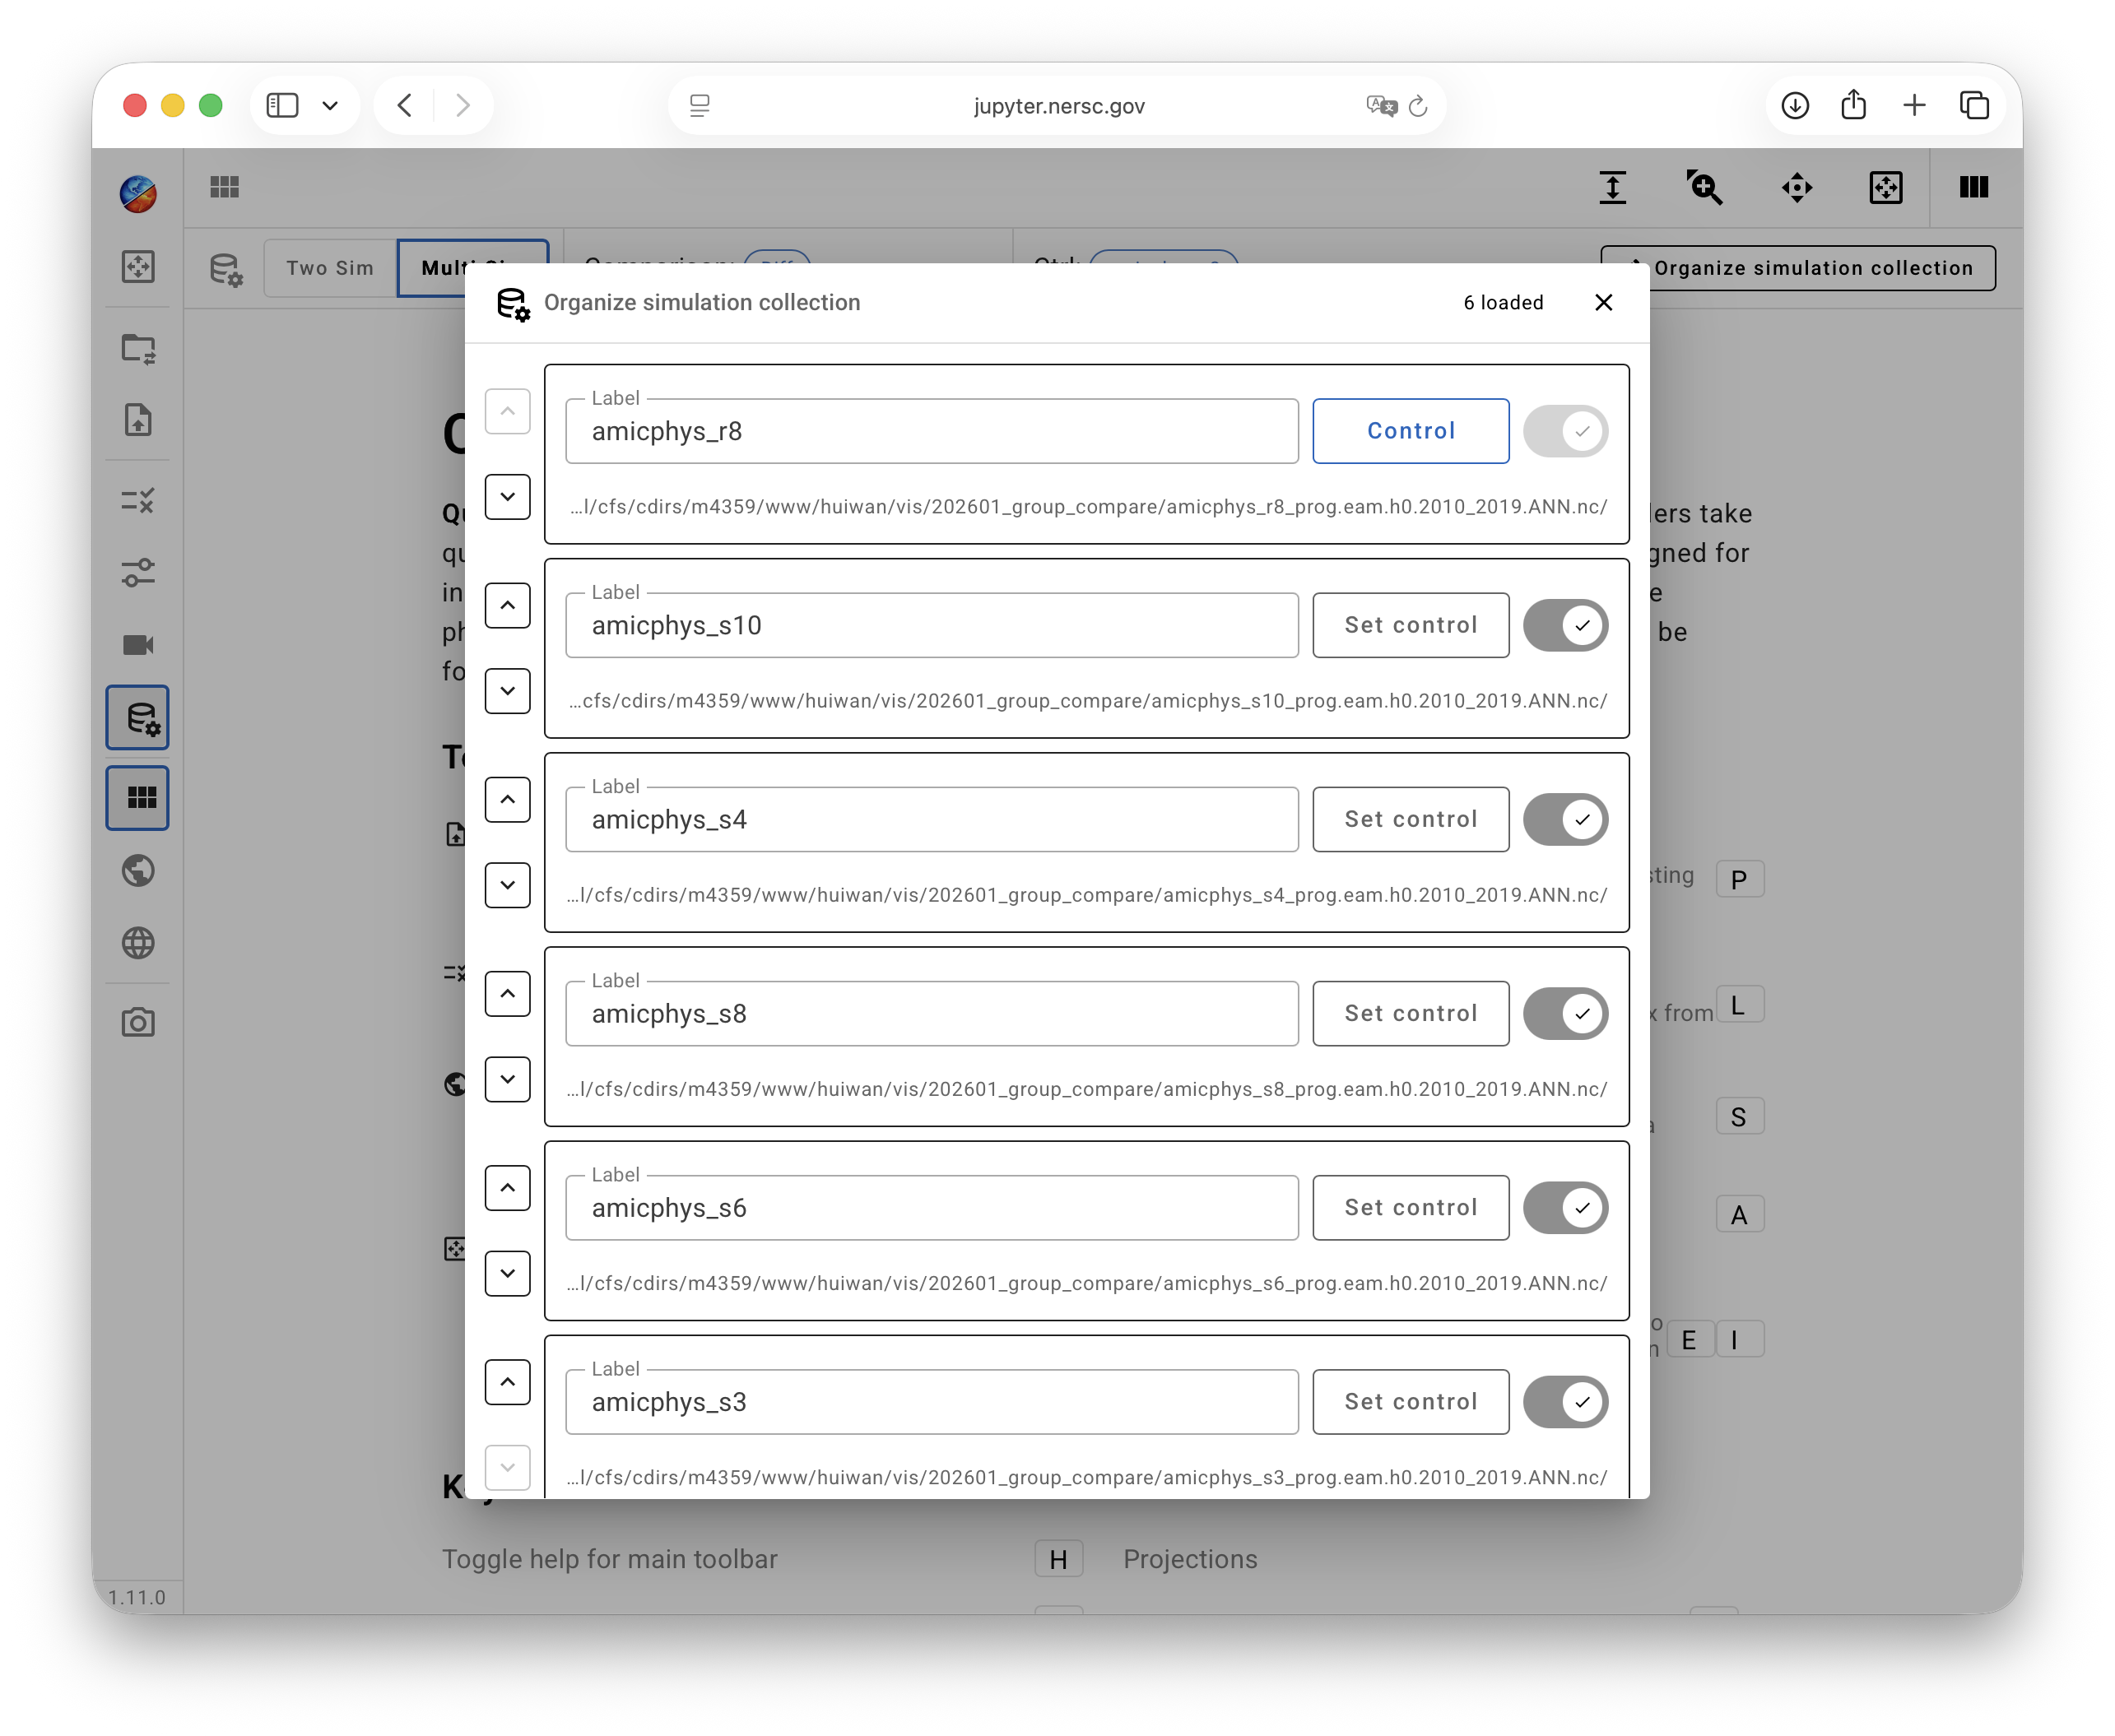
By default, QuickCompare assumes the first simulation selected by the user via the File Loading dialogue is the control (ctrl) simulation, while all other selected simulations are treated as test simulations. This designation can be changed through the Organize simulation collection dialogue, which allows the user to
- enter a custom label for each simulation, which is used in the plot titles;
- exclude a loaded simulation from the viewport while keeping it loaded so that it can be re-enabled later;
- designate a different simulation as the control simulation;
- change the display order of the simulations.
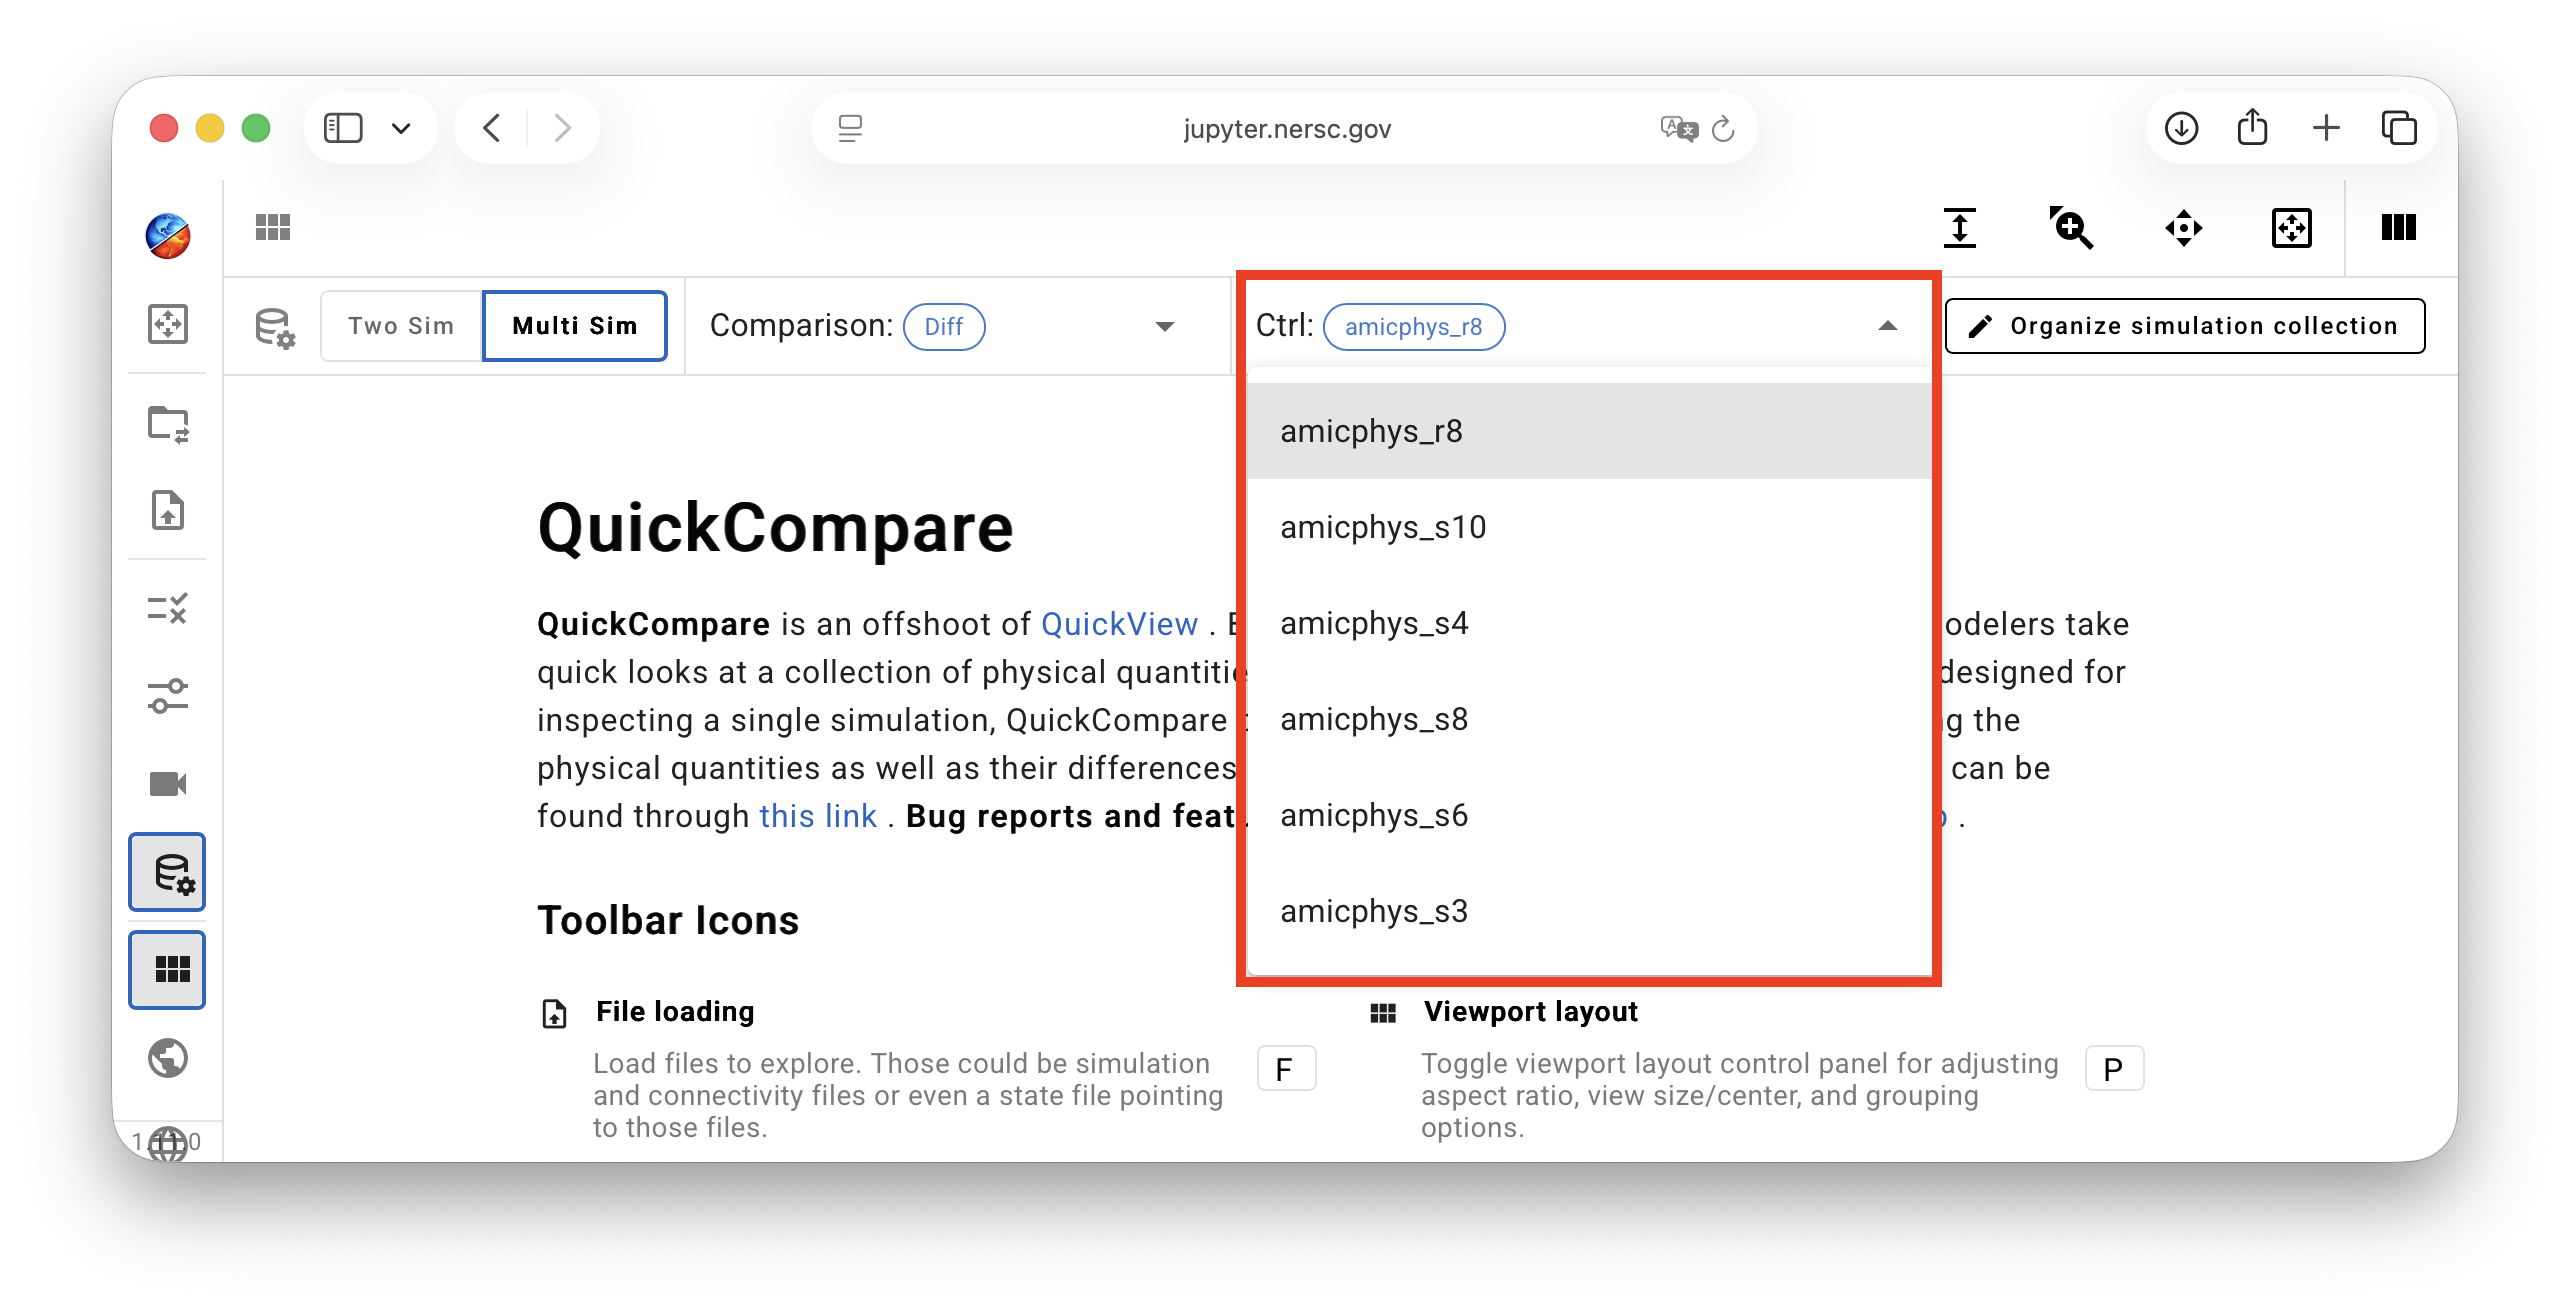
The simulation to be used as control can also be specified using the Choose Ctrl drop-down menu highlighted in the screenshot below.
Comparison types 
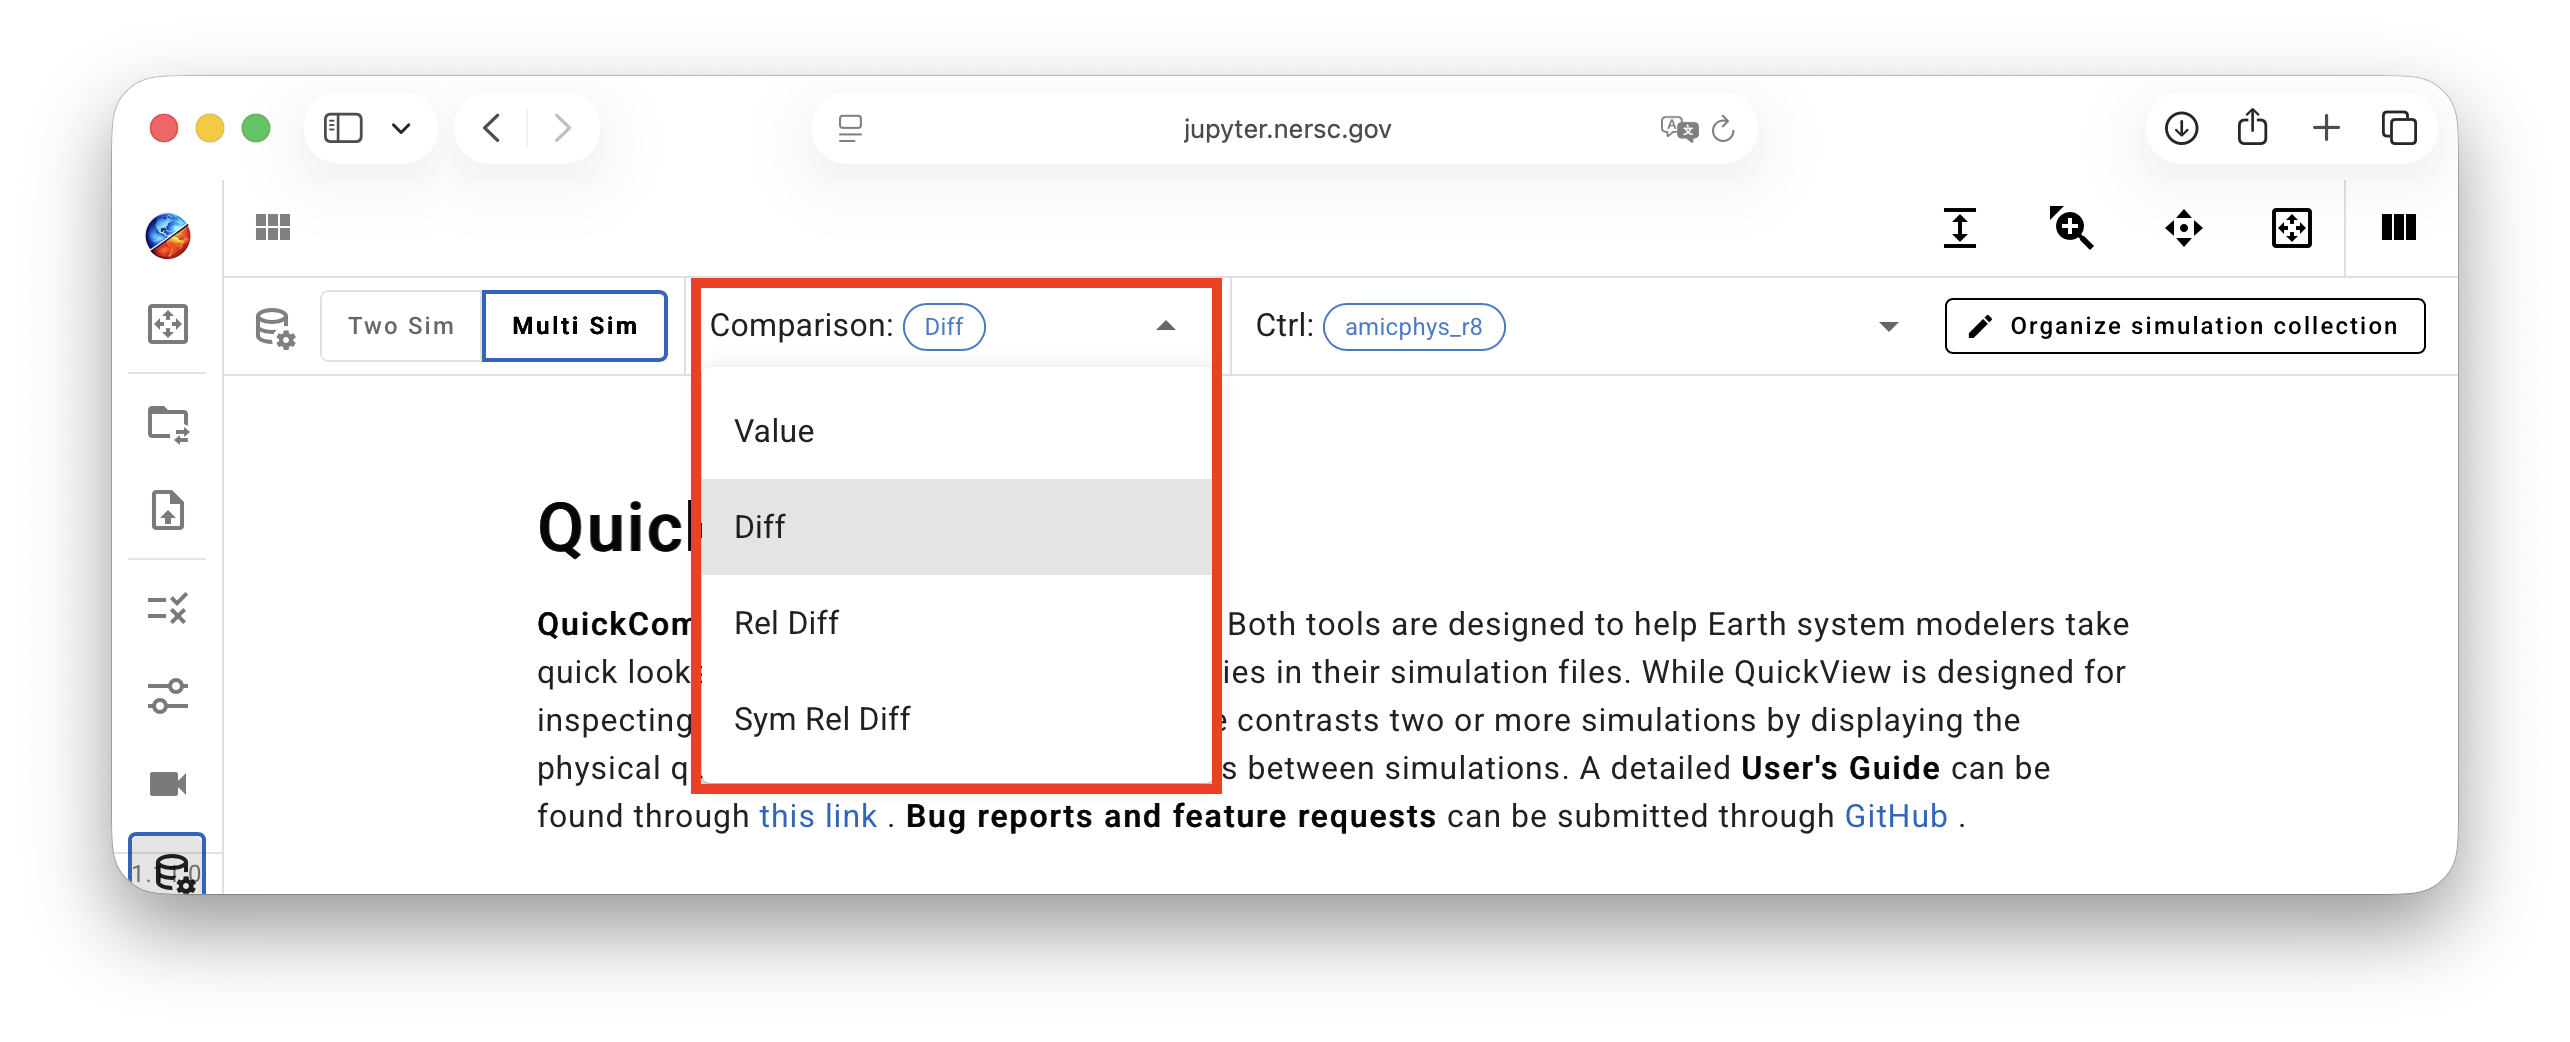
Four types of comparison are available:
- Value: the values of the physical quantities loaded from simulation files.
- Diff: the differences between the test simulations and the control simulation, i.e.,
test - ctrl. - Rel Diff: the relative differences with respect to the control simulation, i.e.,
(test - ctrl)/ctrl. - Sym Rel Diff: the symmetric counterpart of Rel Diff, defined as
2(test - ctrl)/(test+ctrl). It normalizes the difference by the average of the control and test simulations and therefore treats the two simulations symmetrically.
For comparison types 2–4, the value plot from the control simulation is also displayed for reference.
At any given time, all views in the viewport use the same comparison type. The Comparison type drop-down menu shown in the screenshot below is used to switch among types.
Viewport layout basics 
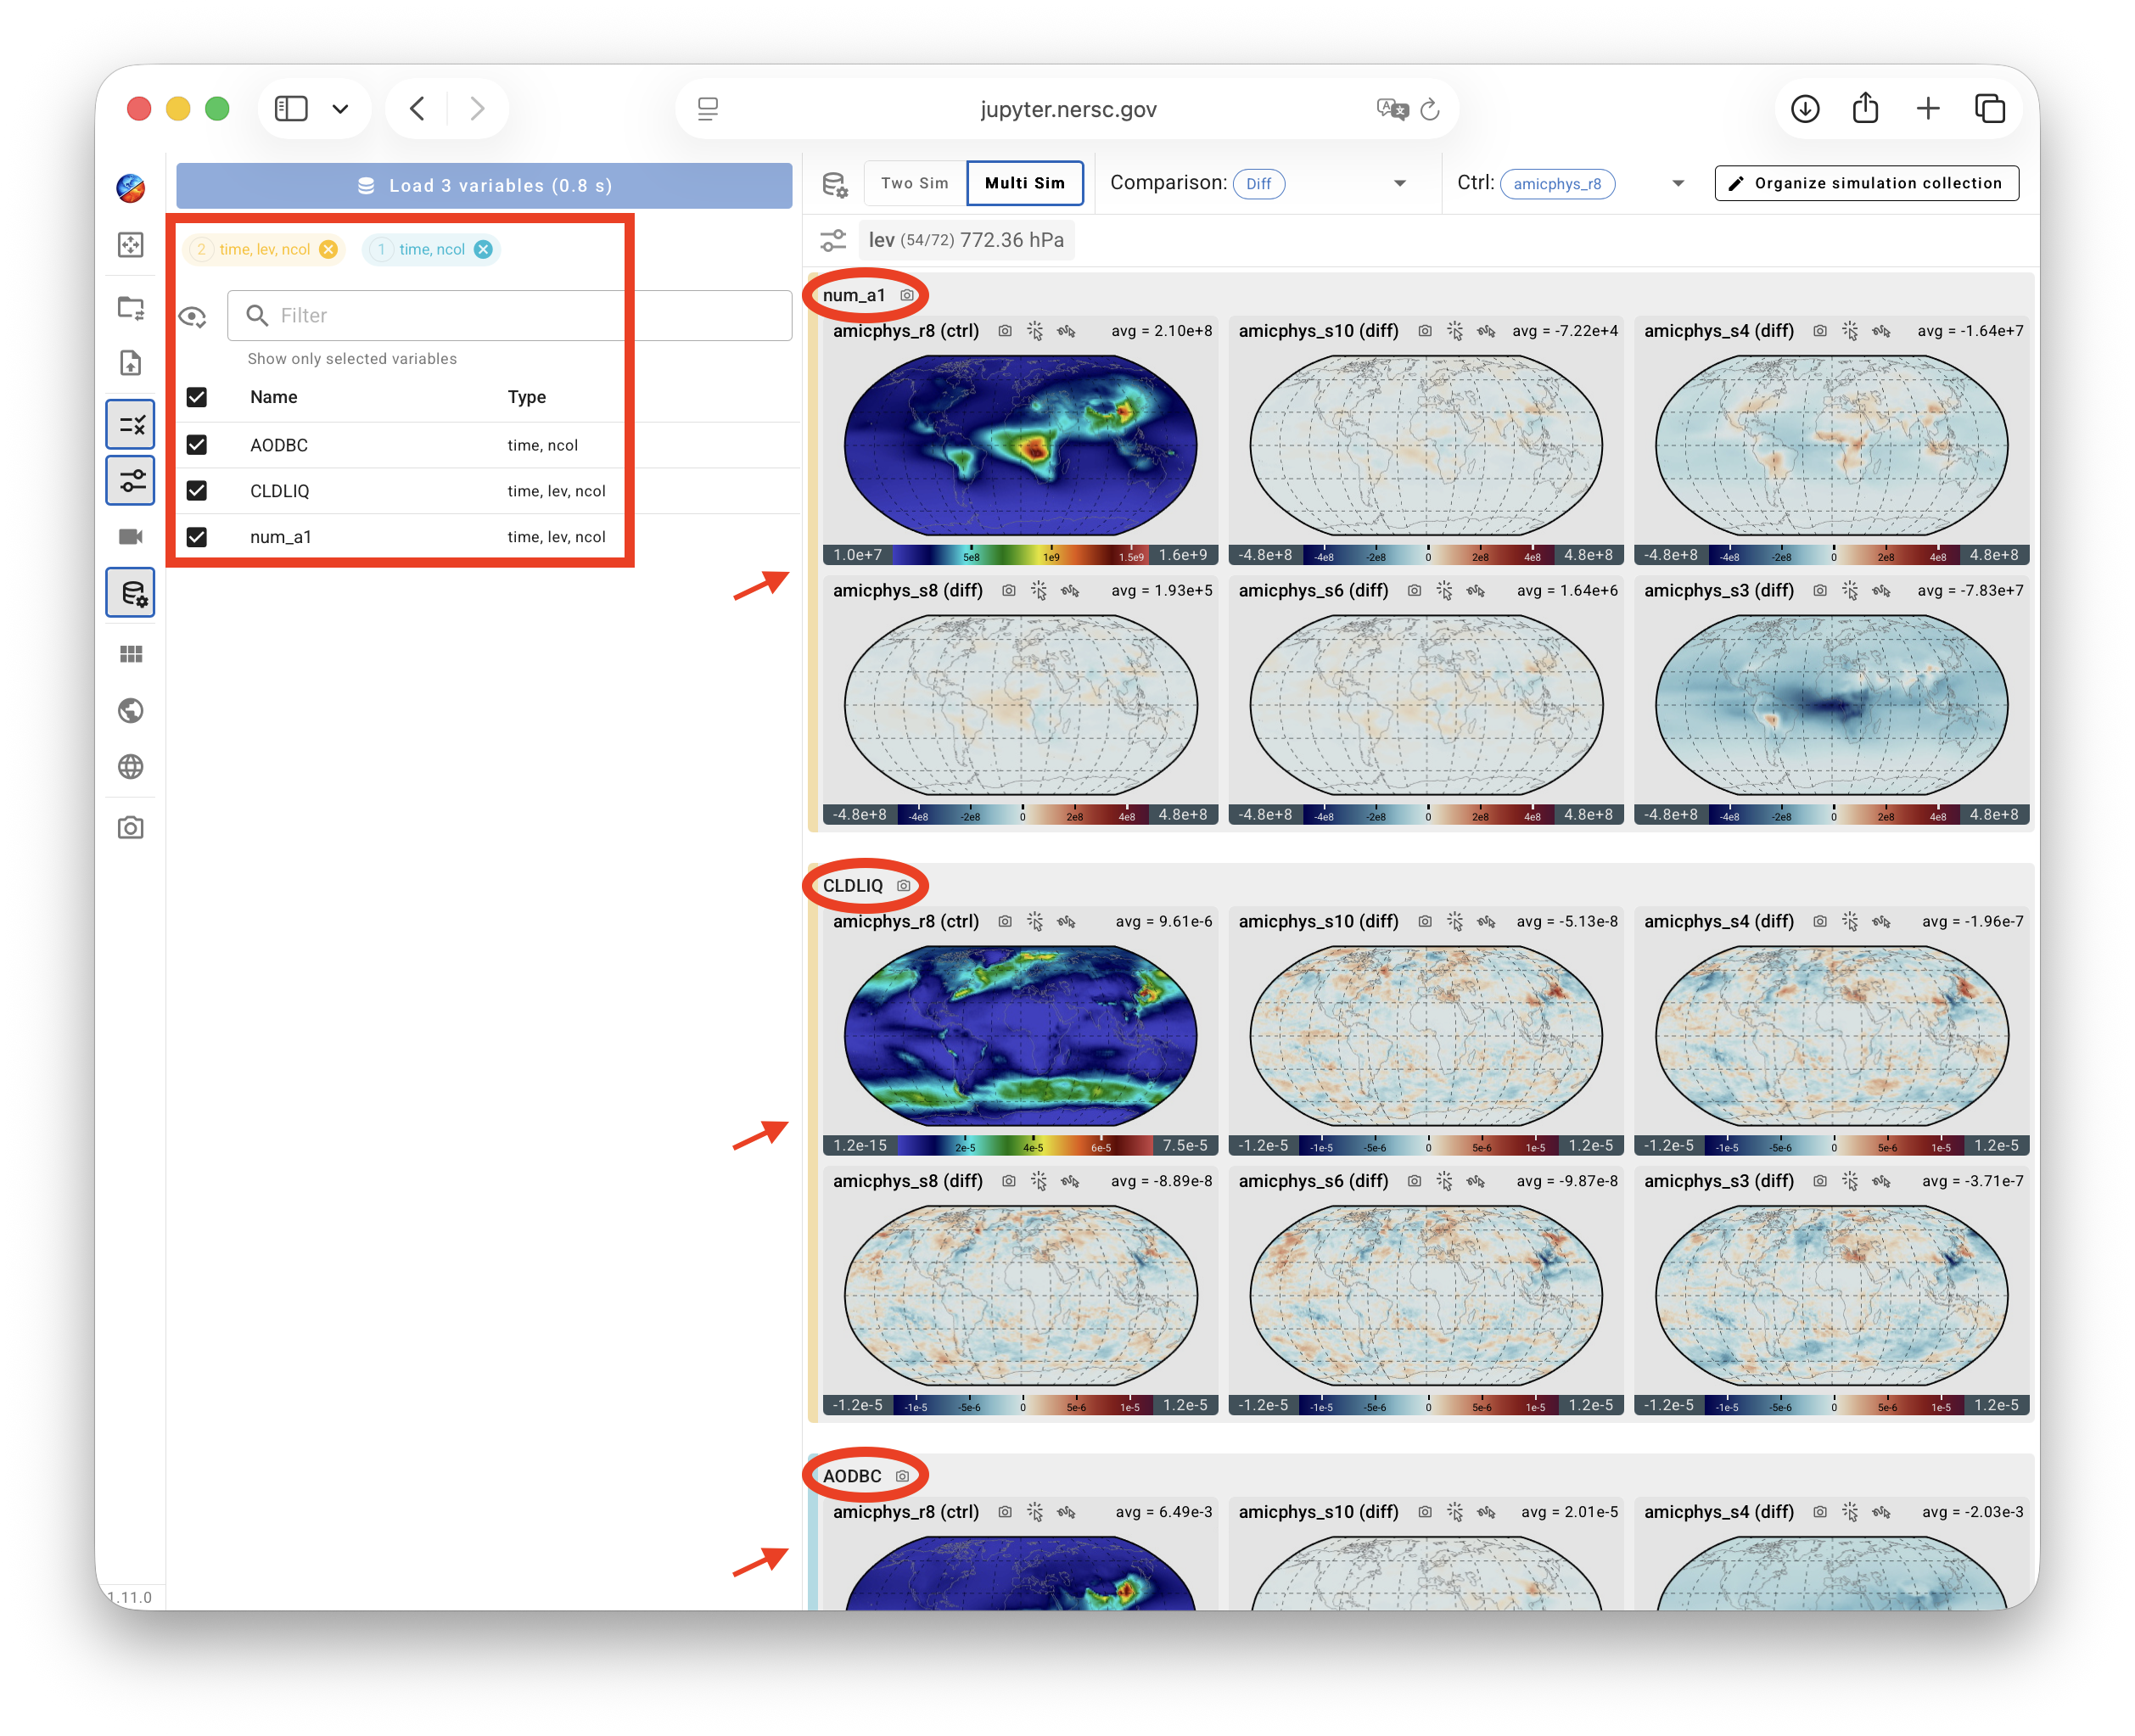
The viewport in the screenshot above shows a short introductory text. Let us assume the user has loaded Ns simulations and then selects and loads Nv variables, resulting in a viewport displaying Ns × Nv plots (views) grouped by variable. Each variable occupies a section consisting of Ns views, one for each simulation. Since Ns may be large, a section can span multiple rows. The number of views per row can be changed using the number keys 1, 2, 3, 4, or 6.
Variable sections 
Each section in a viewport is identified by a vertical bar in the color that matches the corresponding variable shape tab shown near the top of the Variable Selection control panel. The variable name appears in the top-left corner of the section.
Like in the two-simulation comparison mode, a click on a variable name in the viewport activates a drop-down menu to replace the current section by a different variable. A variable appears in the drop-down menu only if it has already been selected and loaded using the Variable Selection control panel.
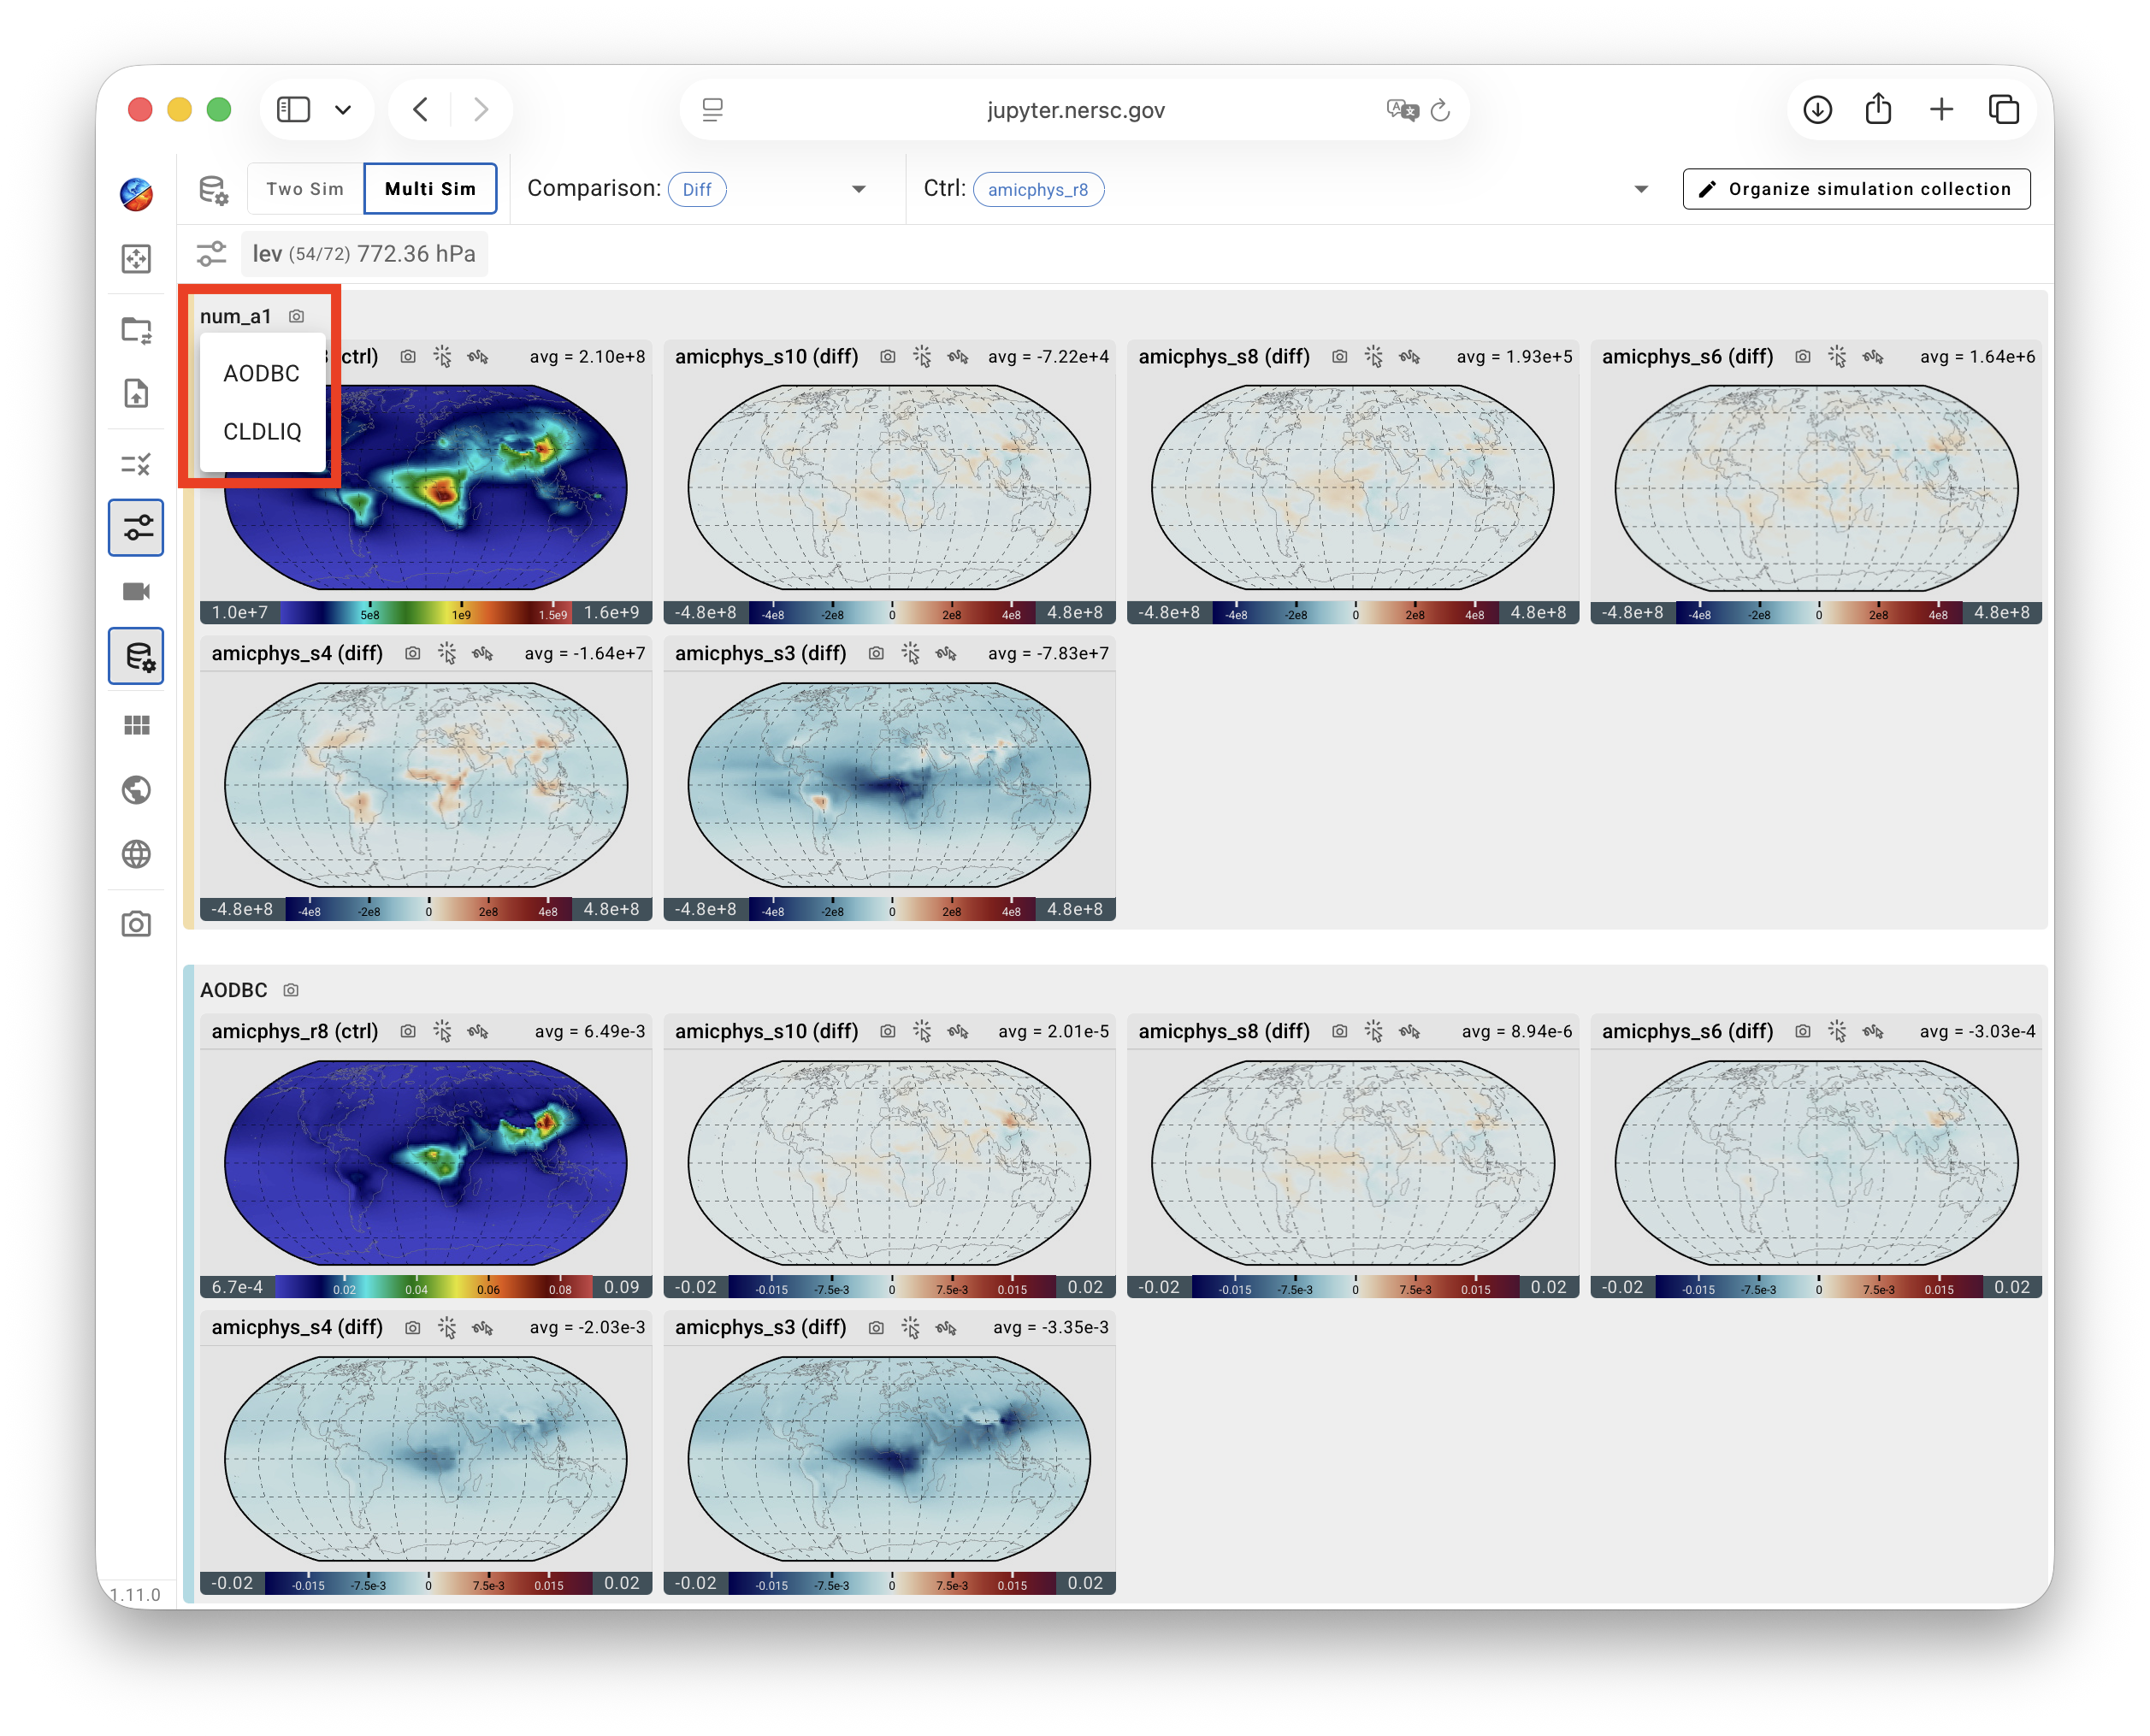
Layout within each section 
By default, the first view (the top-left plot) shows the values from the control simulation (ctrl). The remaining views show either the values from the test simulations or their differences (or relative differences) from the control simulation, depending on the selected comparison type.
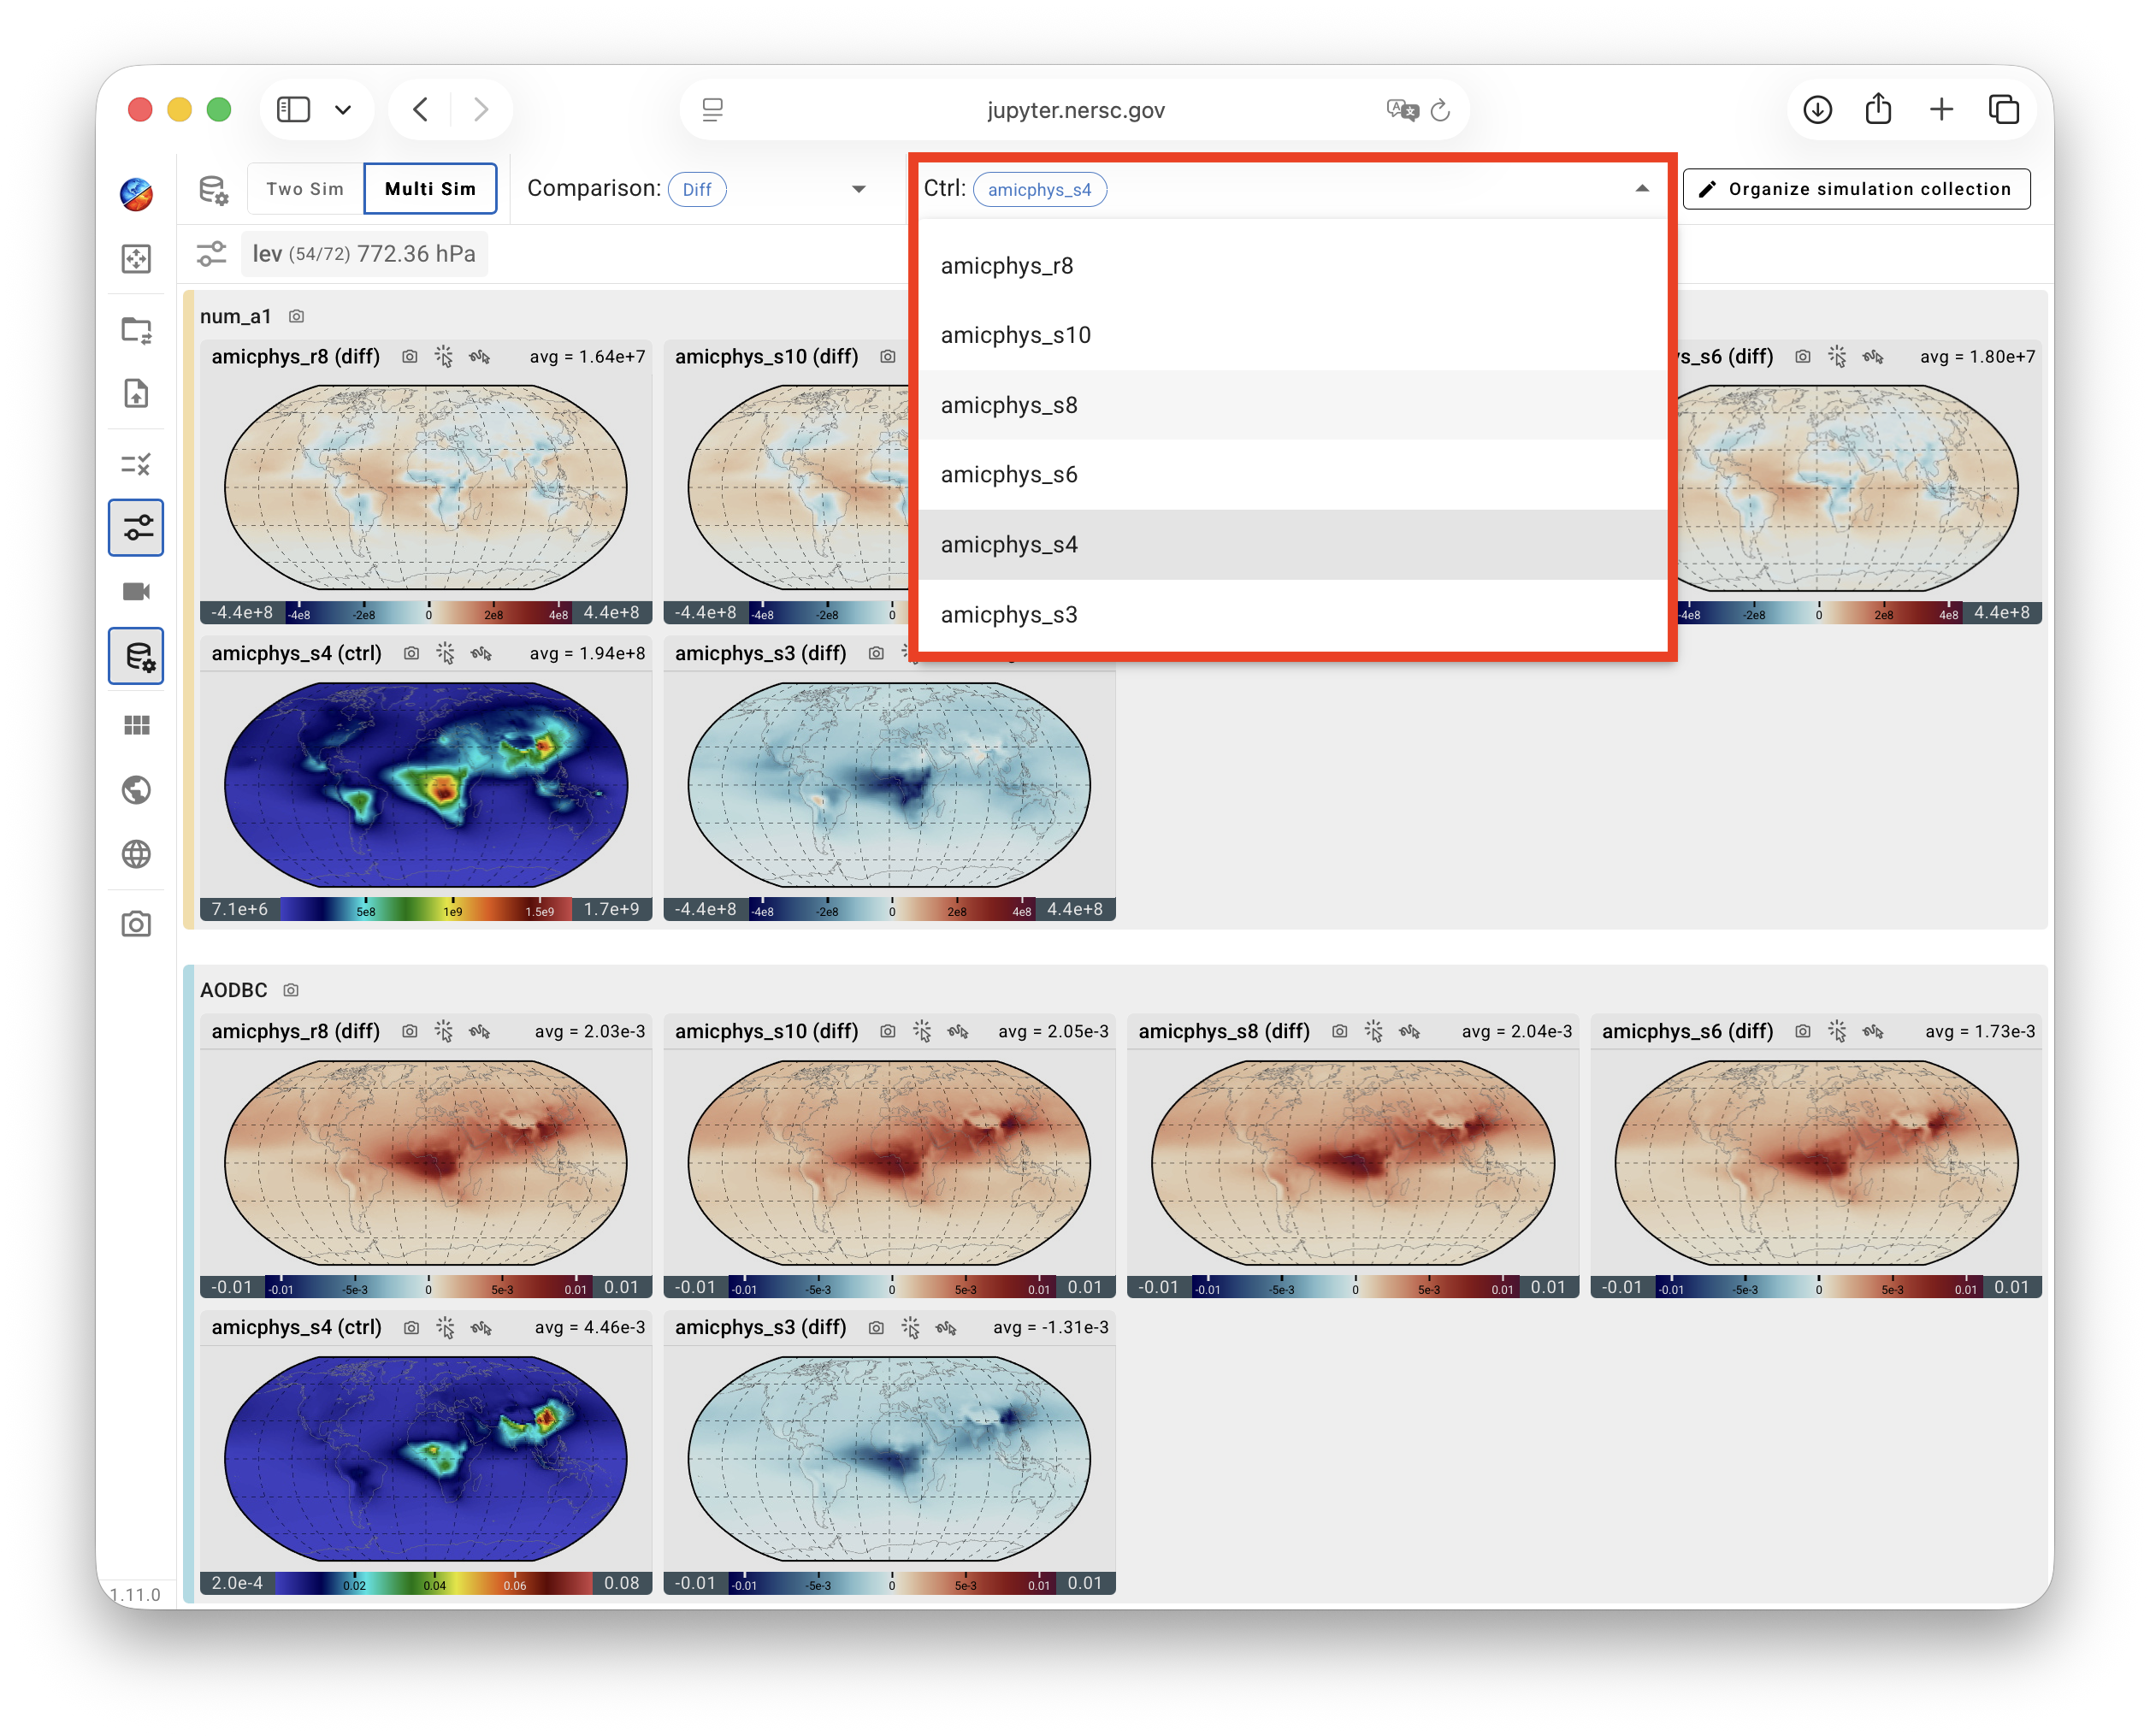
The control simulation can be changed either using the Organize simulation collection dialogue described above or through the Choose ctrl drop-down menu near the top of the viewport. Changing the control simulation does not alter the display order of the simulations. Instead, the views and their titles are updated to reflect the new control simulation, as demonstrated by the example screenshot below.
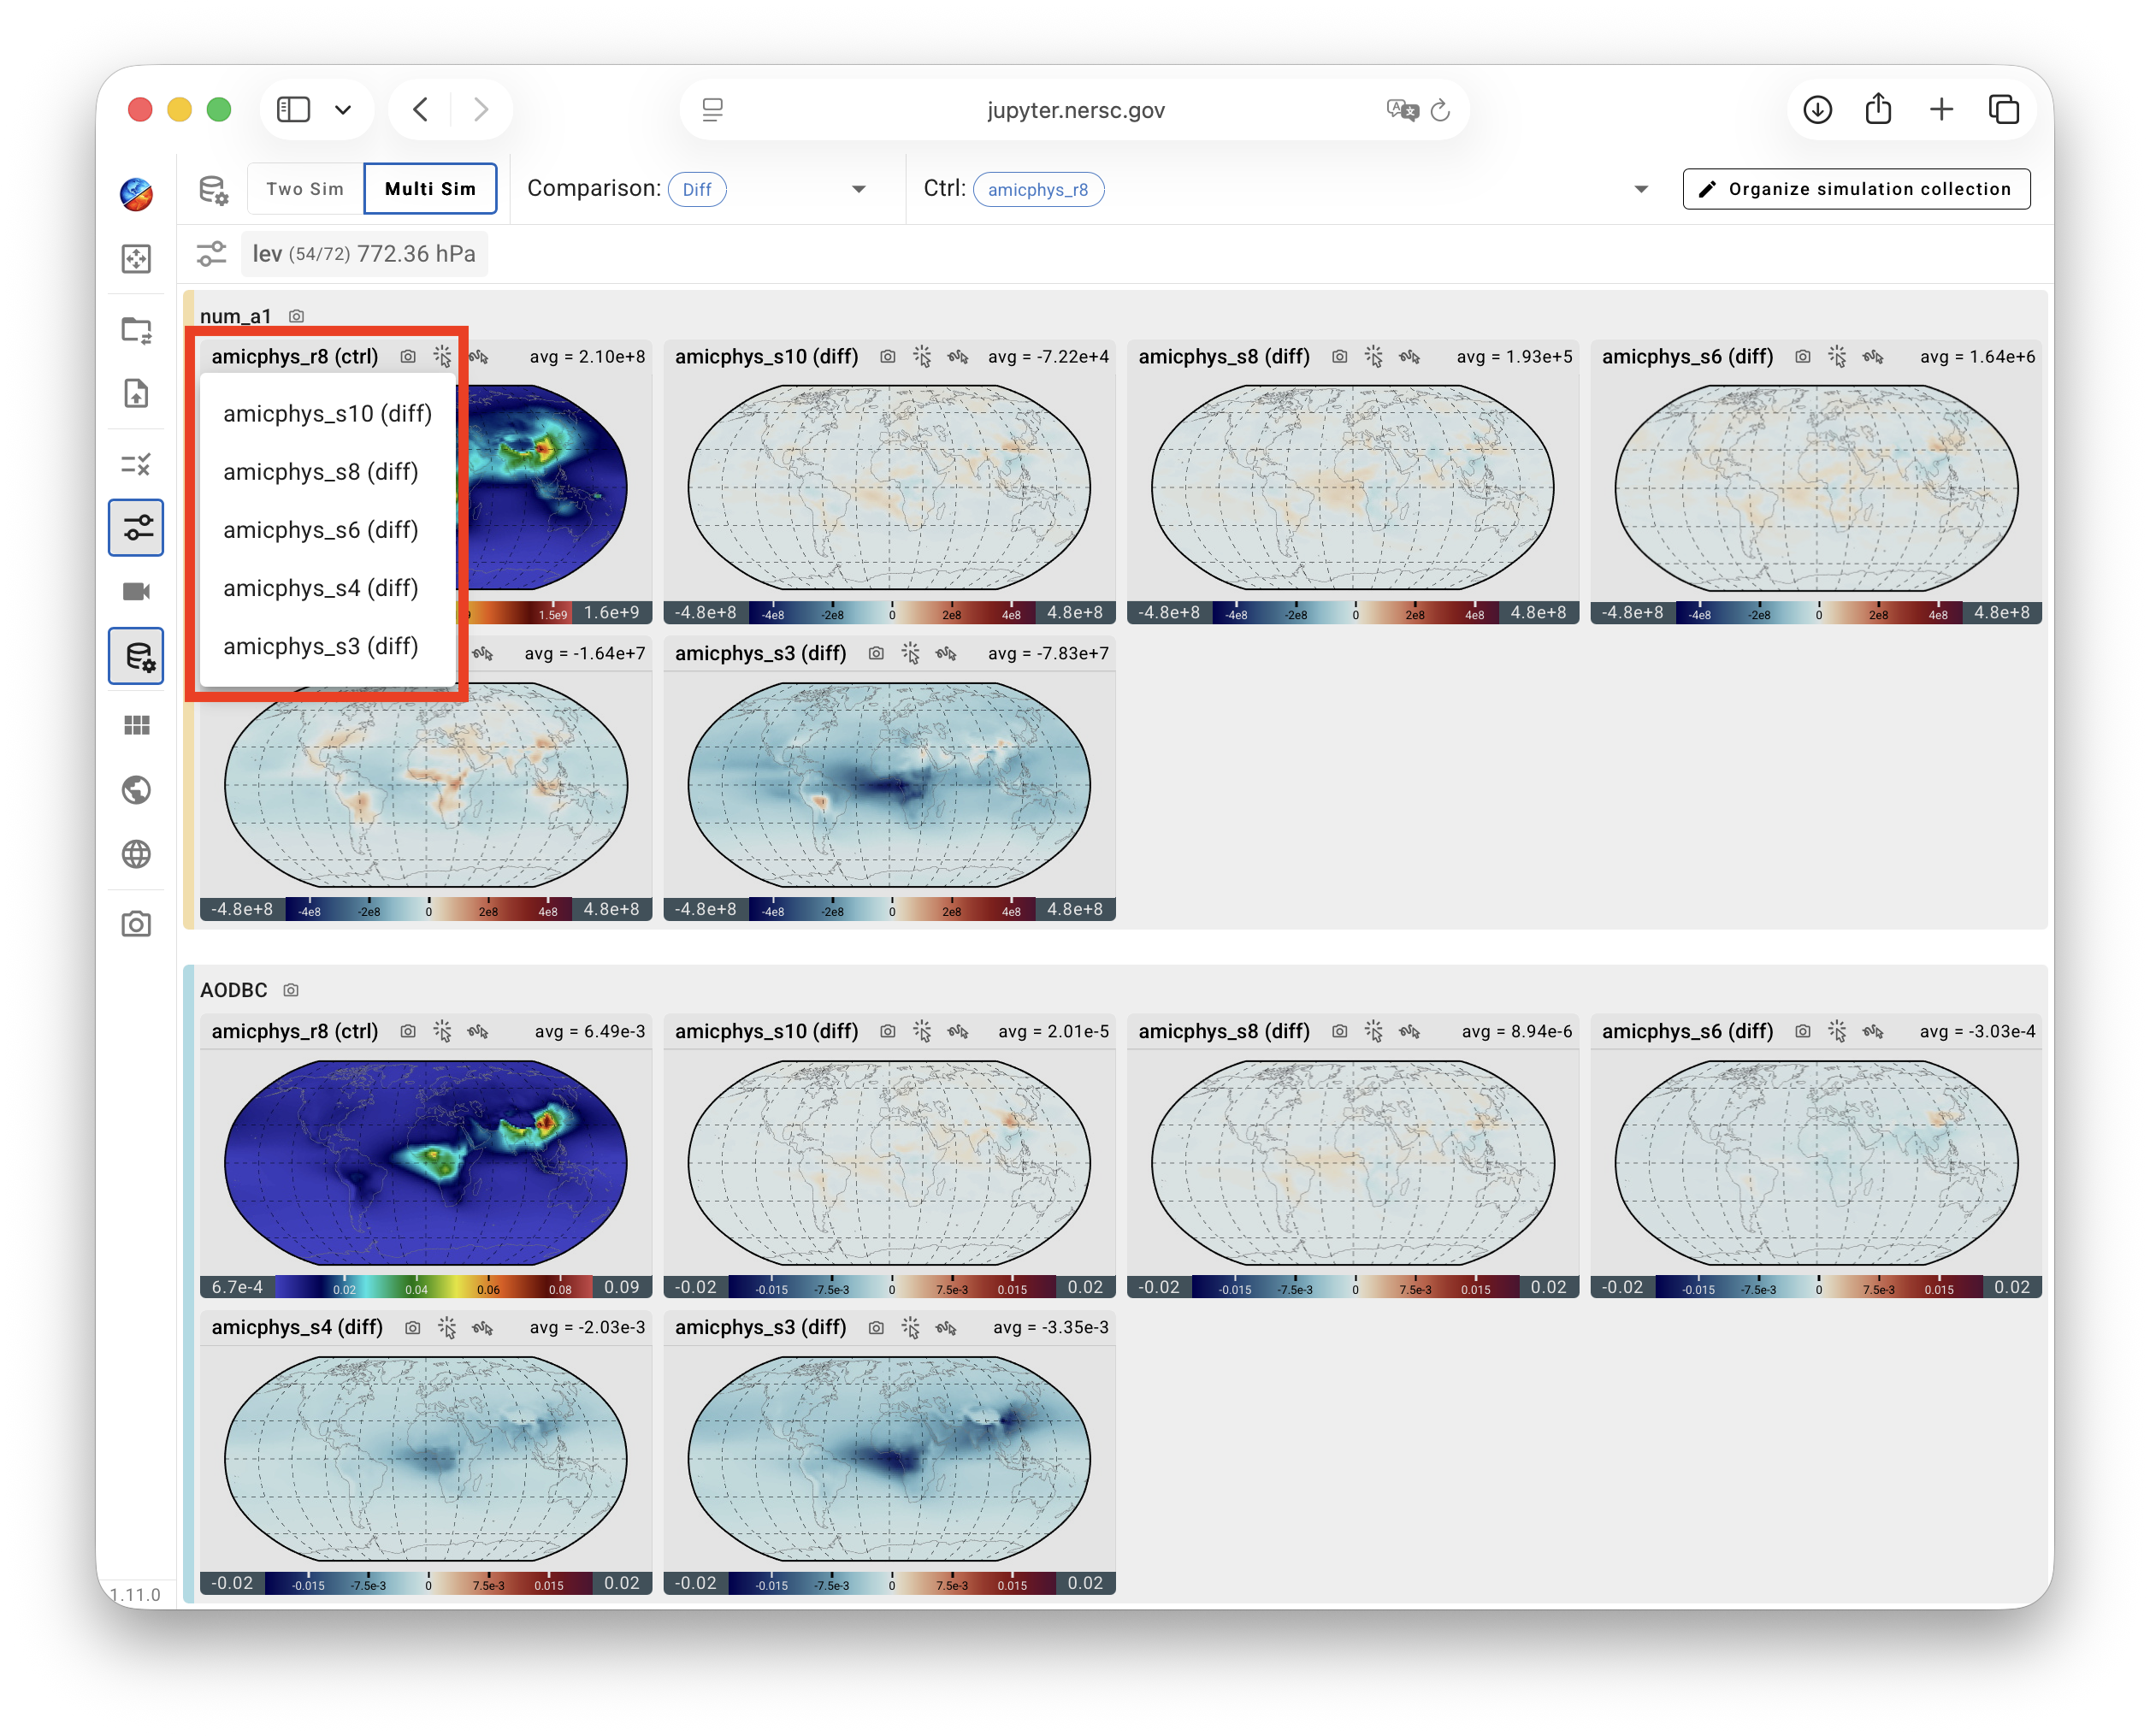
The display order of simulations within each section can be changed either by using the up/down buttons in the Organize simulation collection dialogue or by clicking a simulation label in any view. Clicking a label opens a drop-down menu from which a different simulation can be selected for that position. (A simulation appears in the drop-down menu only if it has been loaded through the File Loading dialogue and is currently included in the viewport, i.e., the corresponding Include box in the Organize simulation collection dialogue is checked.) Any change to the display order is applied consistently to every variable section in the viewport.
To facilitate quantitative comparisons between simulations, the multi-simulation mode in QuickCompare uses the following default color mapping choices:
- Within each variable section, all plots of the same comparison type share the same colormap and contour levels, allowing values to be compared directly by color.
- Difference and relative difference plots use diverging colormaps centered at zero.
- Difference and relative difference plots use different colormaps to distinguish signed absolute differences from normalized (relative) differences.
Beyond these defaults, QuickCompare provides the same color-mapping functionality as QuickView. Each plot in the viewport can be customized individually through the dialogue window opened by clicking its colorbar, as described in the QuickView user guide.