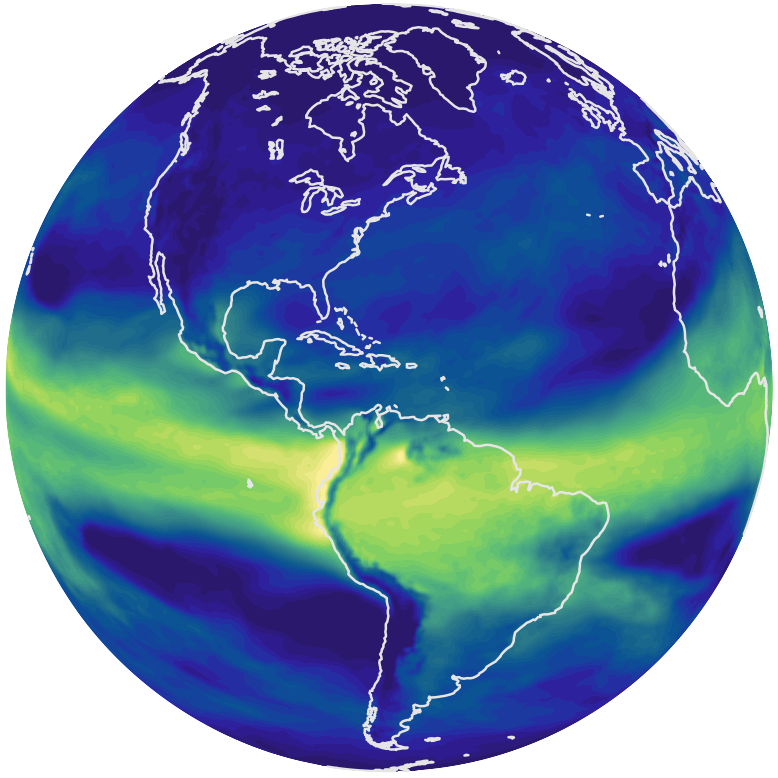
Map-Related Features 
Map projection 
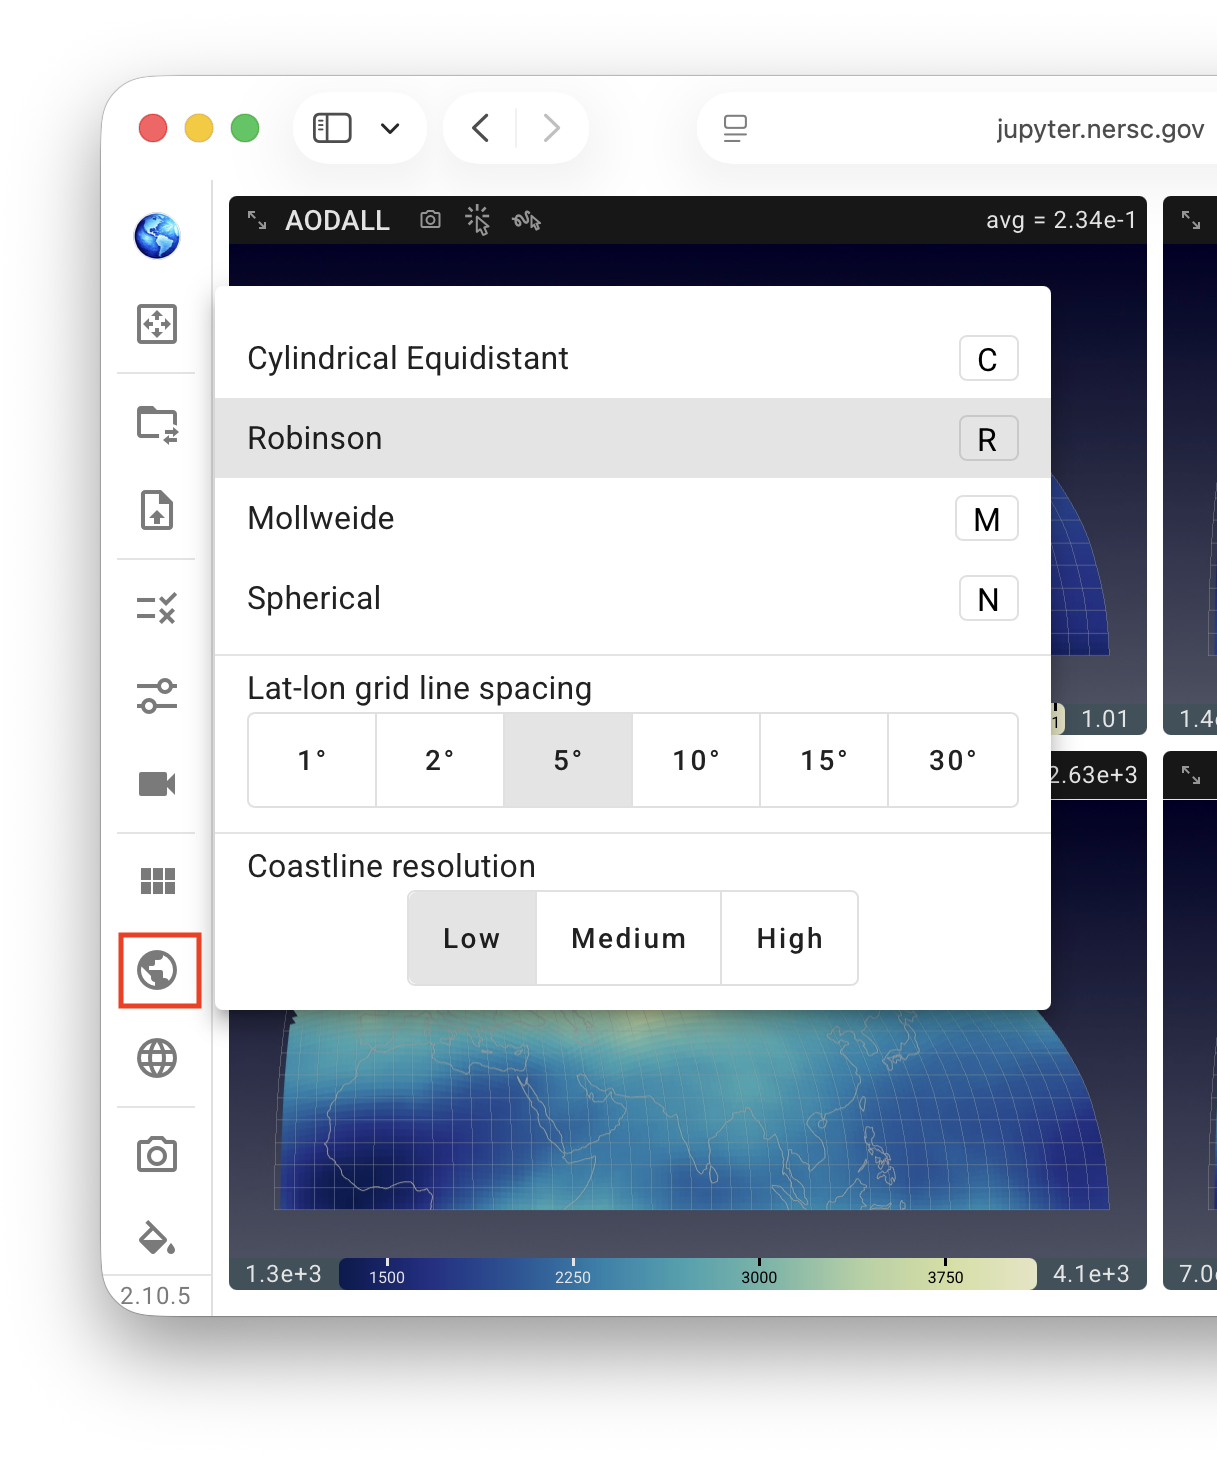
The map projection used for the contour plots can be changed through the mini-menu opened by clicking the Earth icon in the vertical toolbar. The projection can also be selected using the following keyboard shortcuts:
C: cylindrical equidistant;R: Robinson;M: Mollweide;N: spherical.
The bottom portion of the same mini-menu allows the user to adjust the spacing of the latitude–longitude grid lines shown on the map as well as the resolution of the displayed coastlines.
Plot background color 
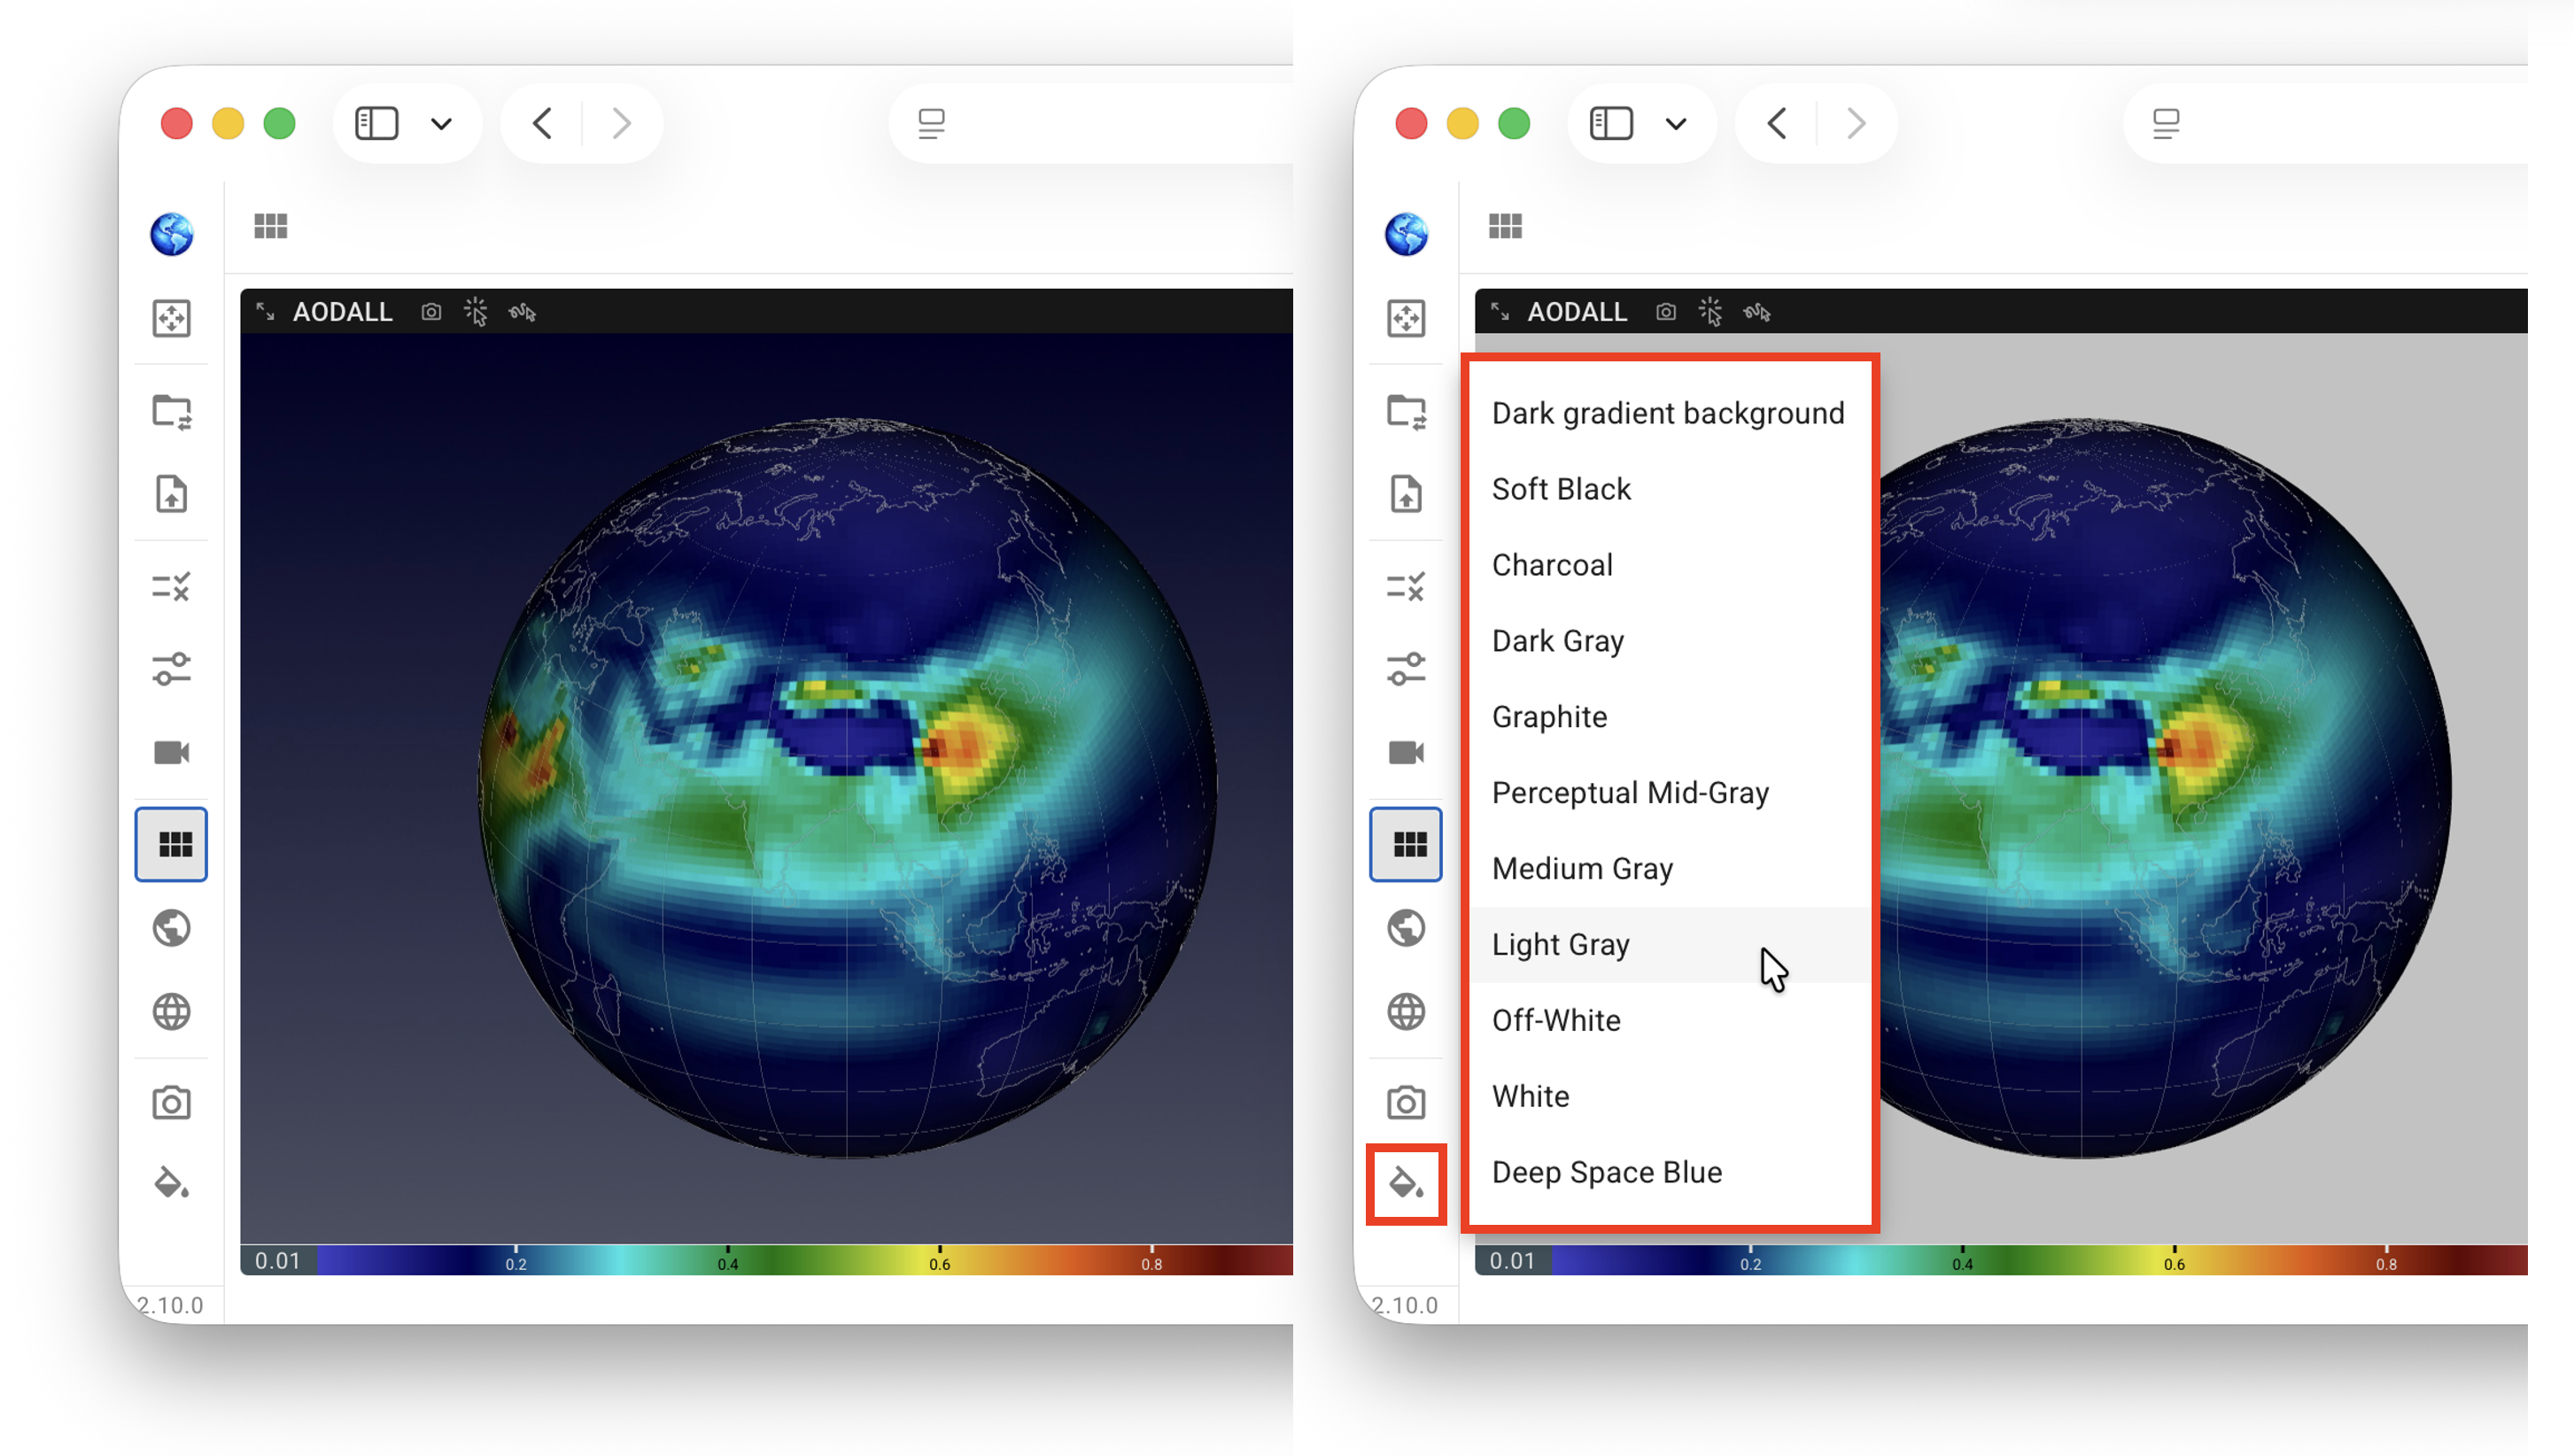
QuickView uses ParaView's "dark gradient" as the default plot background. Depending on the map projection and colormap, however, a different background color may improve visual contrast. For example, with the spherical projection, a lighter background can make the boundary of the globe easier to distinguish. For other projections, changing the background may help distinguish regions whose data colors are similar to the default background.
Starting in version 2.10.0, the plot background color can be changed through the mini-menu opened by clicking the background-color icon in the vertical toolbar.
Geographical region 
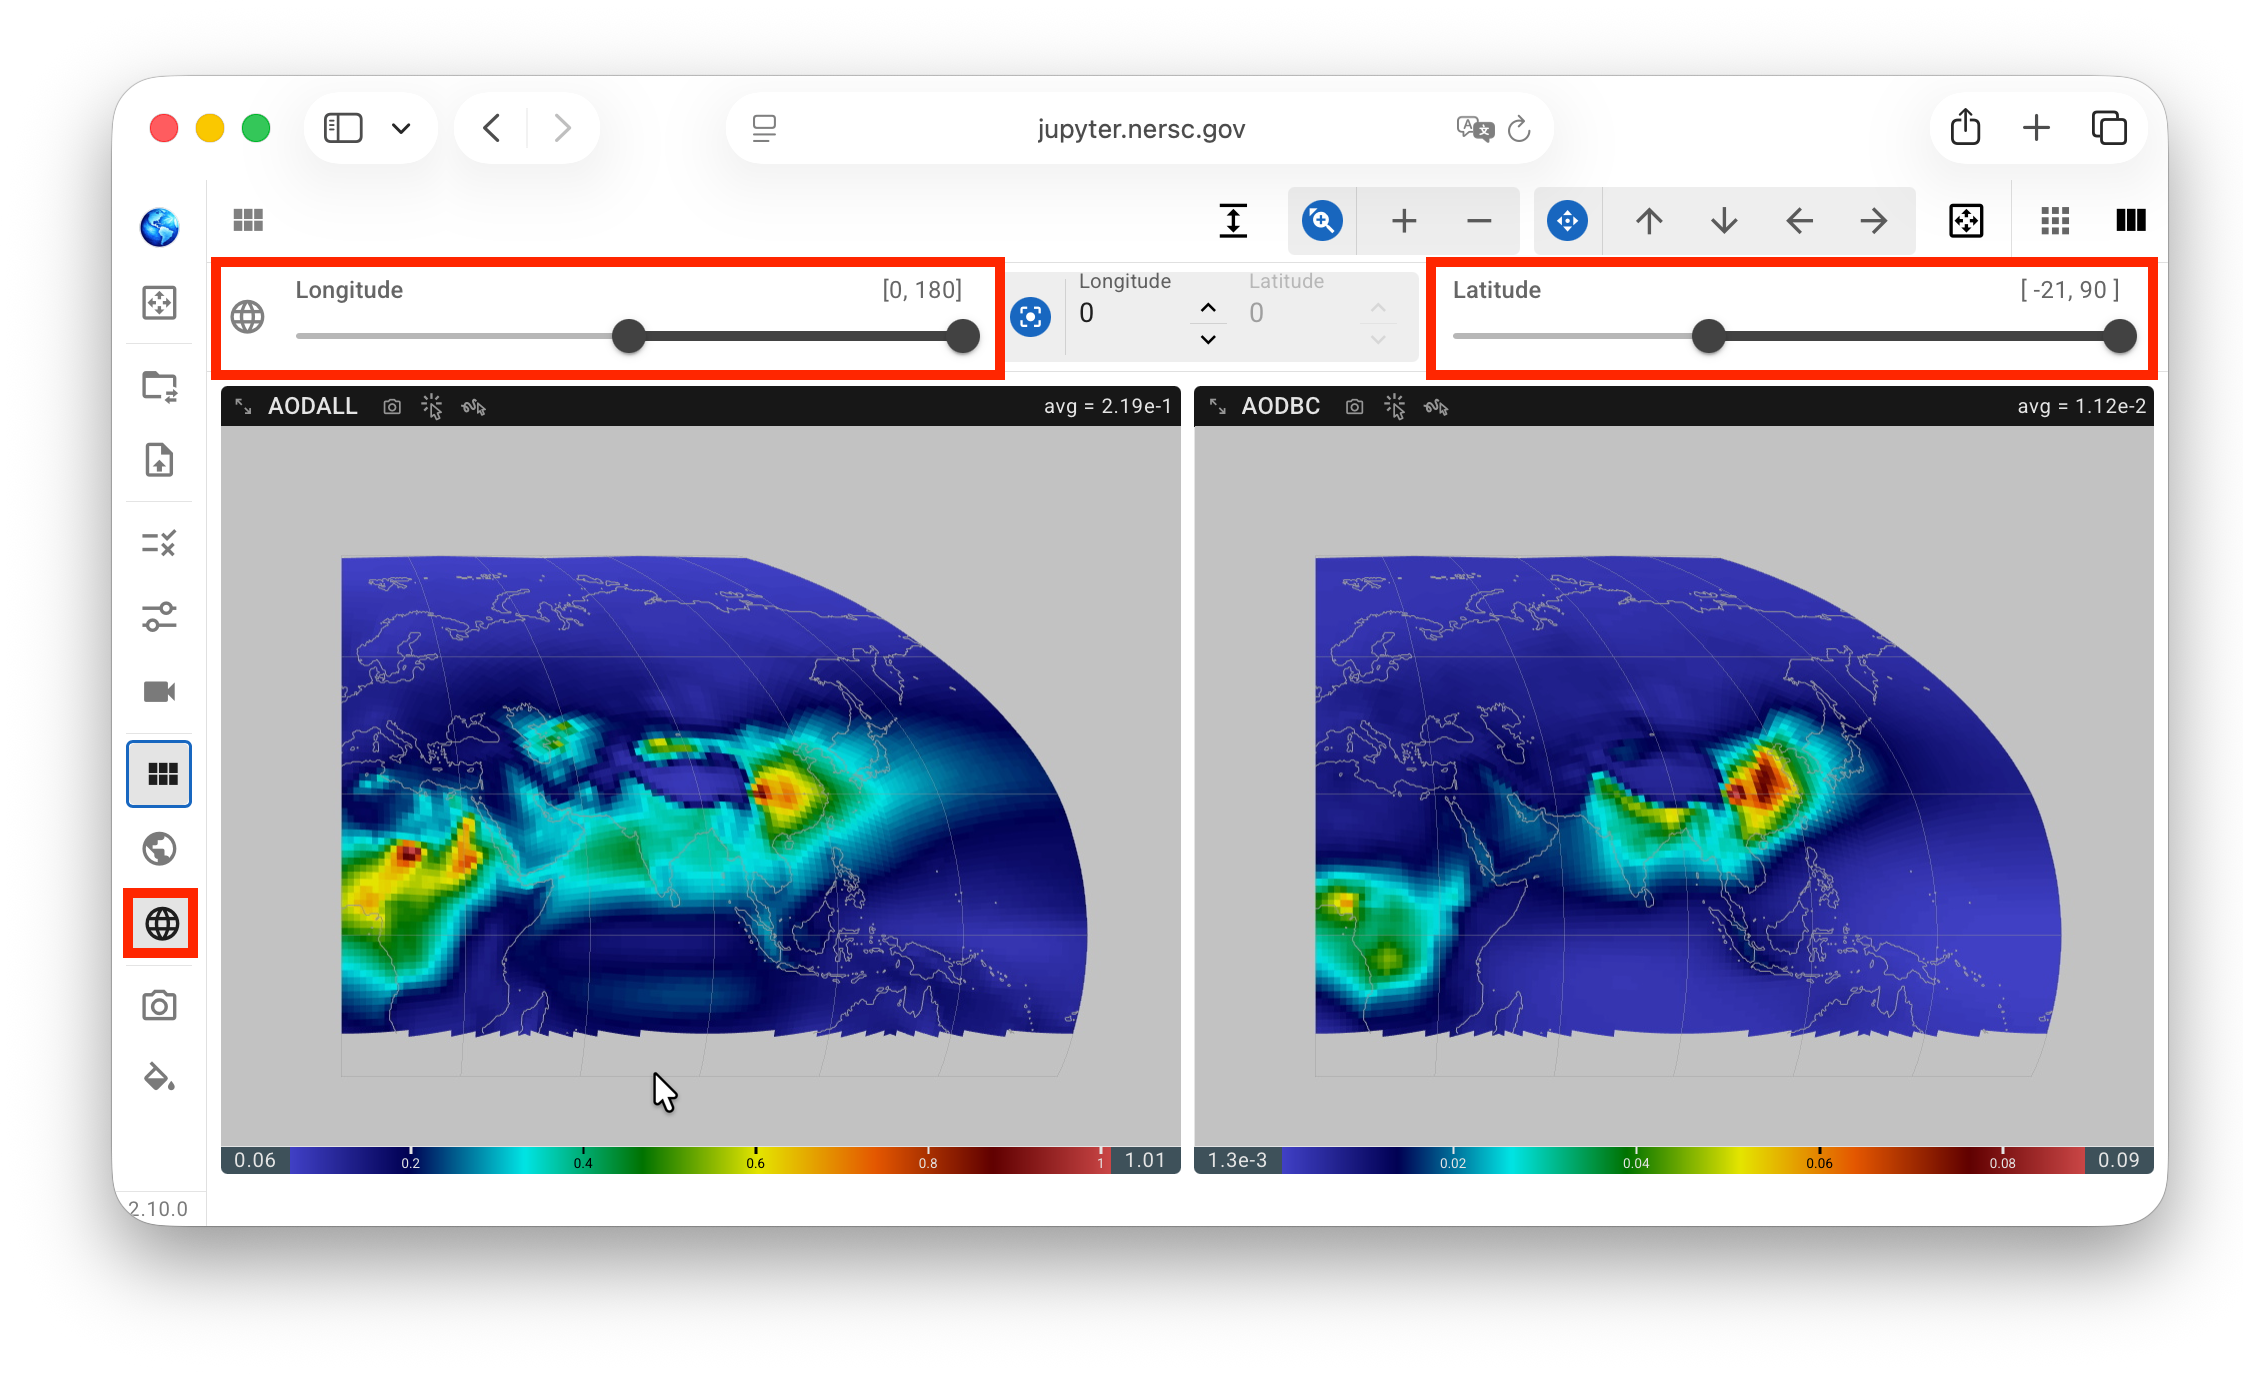
The geographical region displayed in the contour plots—defined by its latitude and longitude bounds—can be adjusted using the range sliders in the latitude–longitude cropping panel. The panel is opened by clicking the Earth-grid icon in the vertical toolbar.
On each slider, the full available range is shown in gray, while the range being displayed is shown in black and reported numerically above the slider.
Map center 
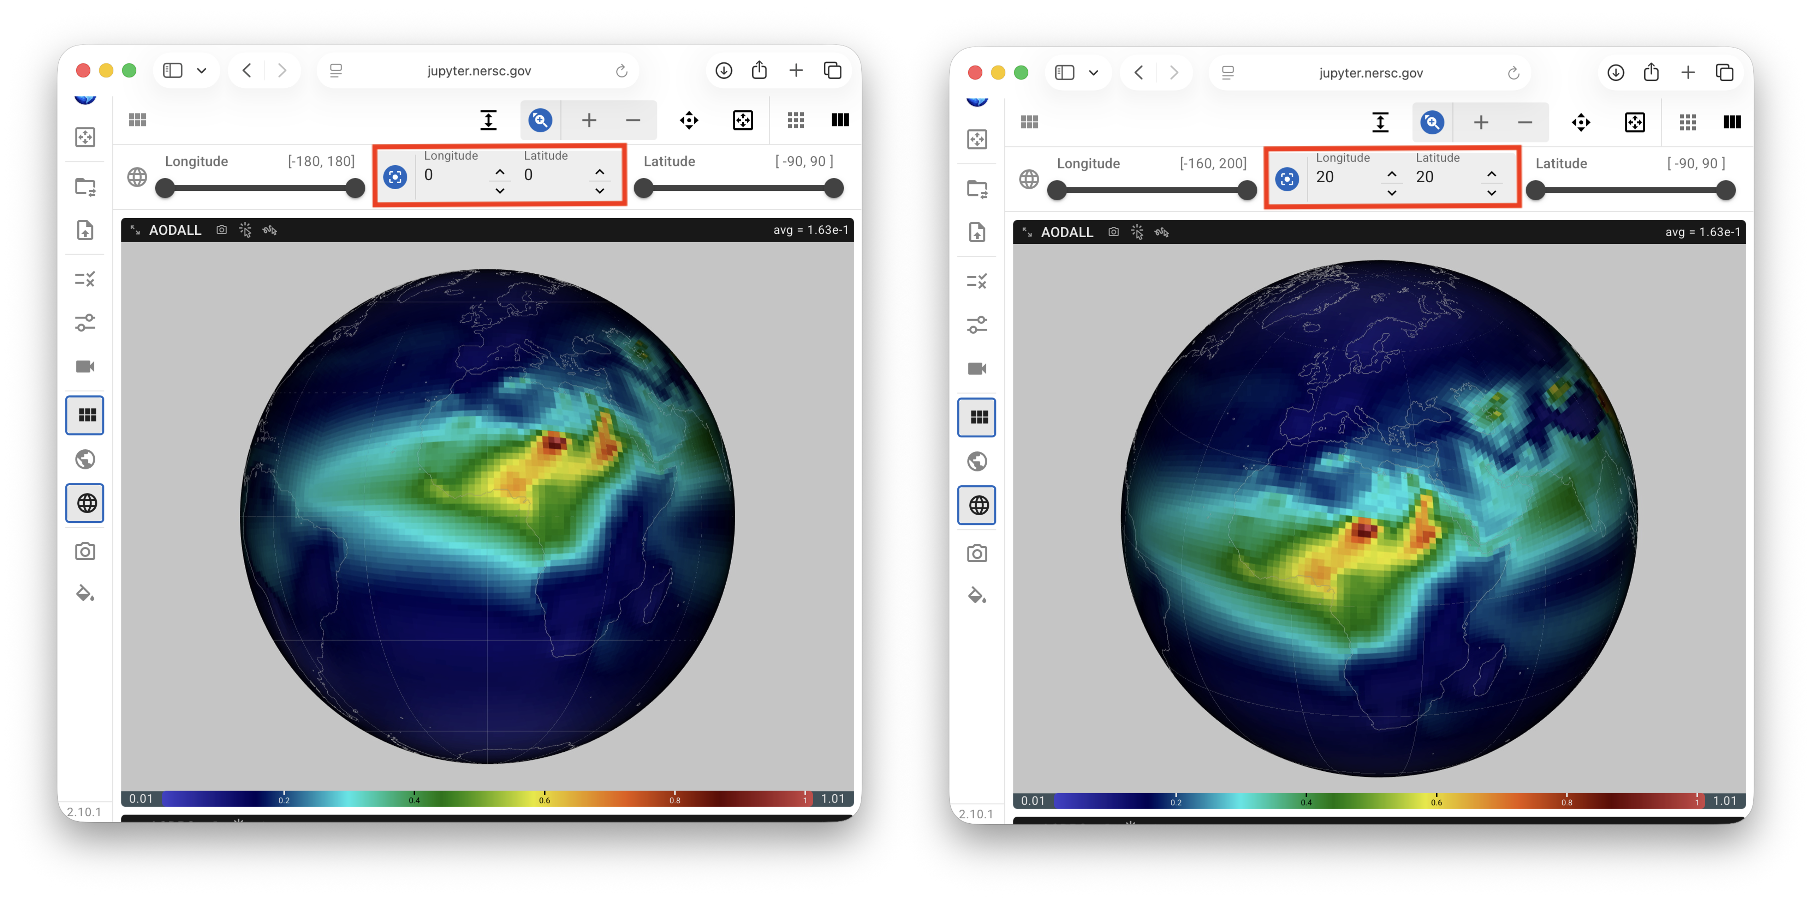
The controls between the latitude and longitude range sliders allow the user to specify the "map center":
With the spherical projection, QuickView rotates the globe so that the specified geographical location (longitude and latitude) faces the viewer and appears at the center of the visible globe. The UI therefore allows both its longitude and latitude to be adjusted.
For the cylindrical equidistant, Robinson, and Mollweide projections, the projection remains centered on the equator. The center-latitude control is therefore grayed out, but the user can still specify a longitude for the center of the map presented to the viewer.
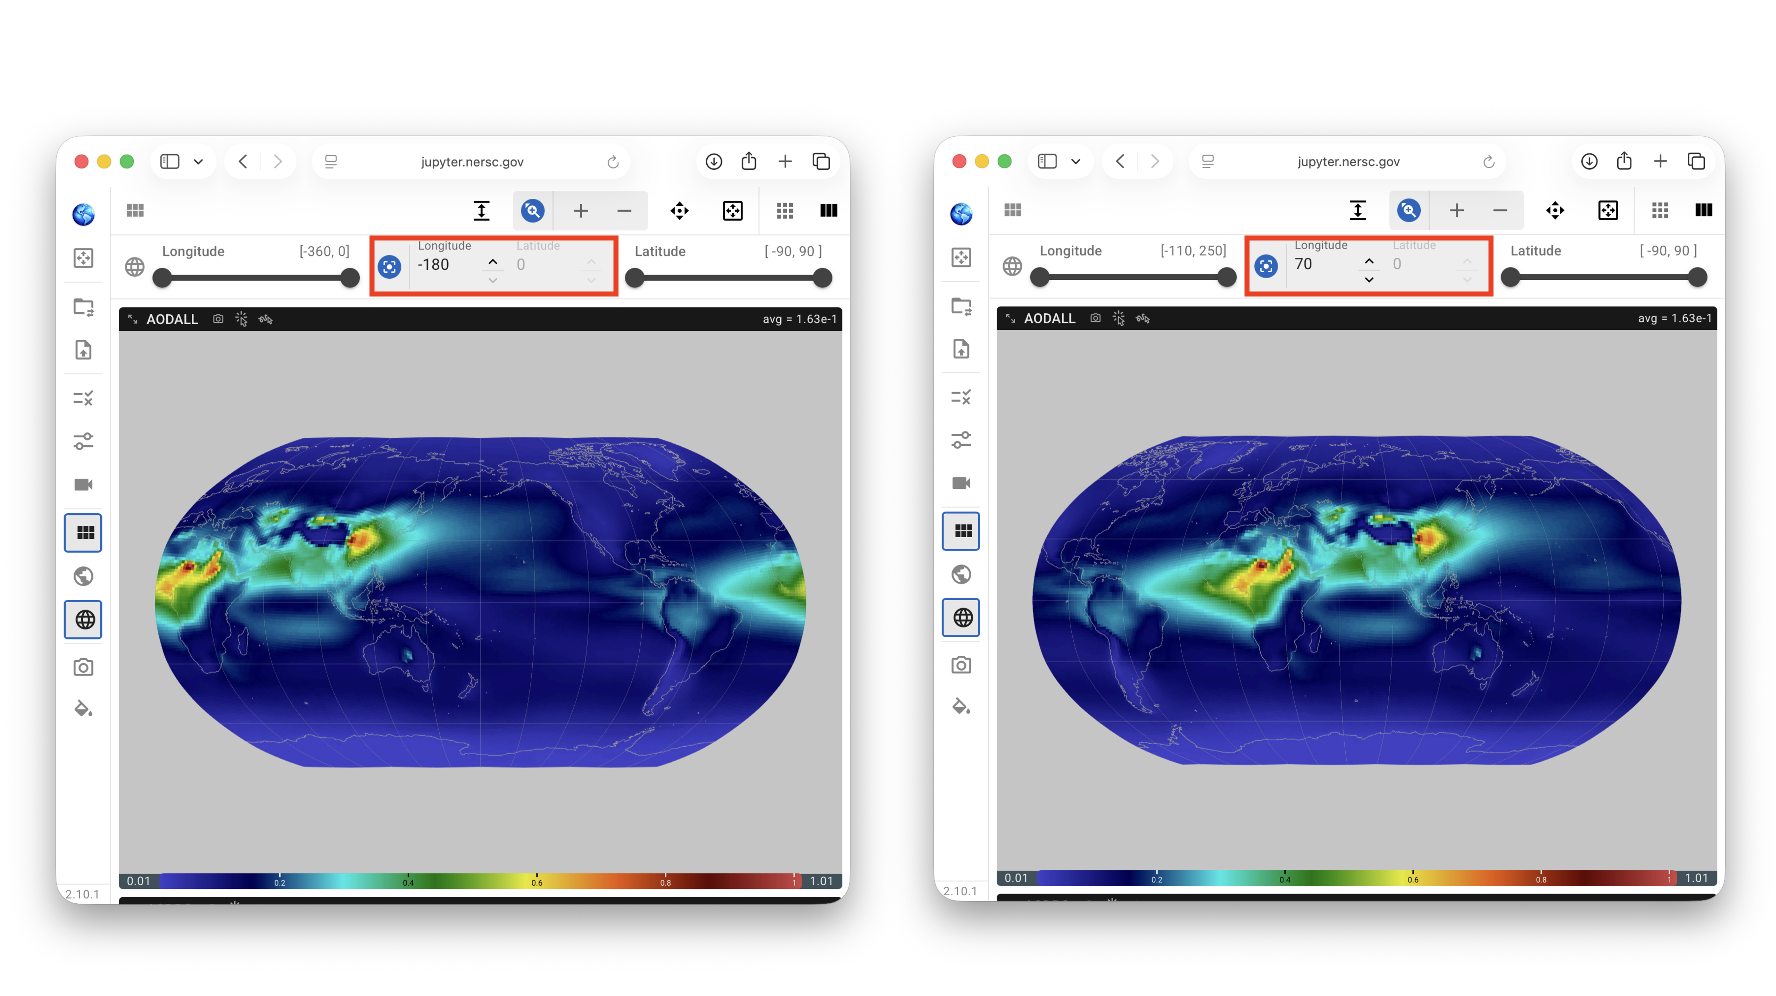
When the center longitude is changed, the full available range of the longitude slider automatically adjusts to span 180° west and east of the new center longitude. The latitude slider always spans from 90°S to 90°N.