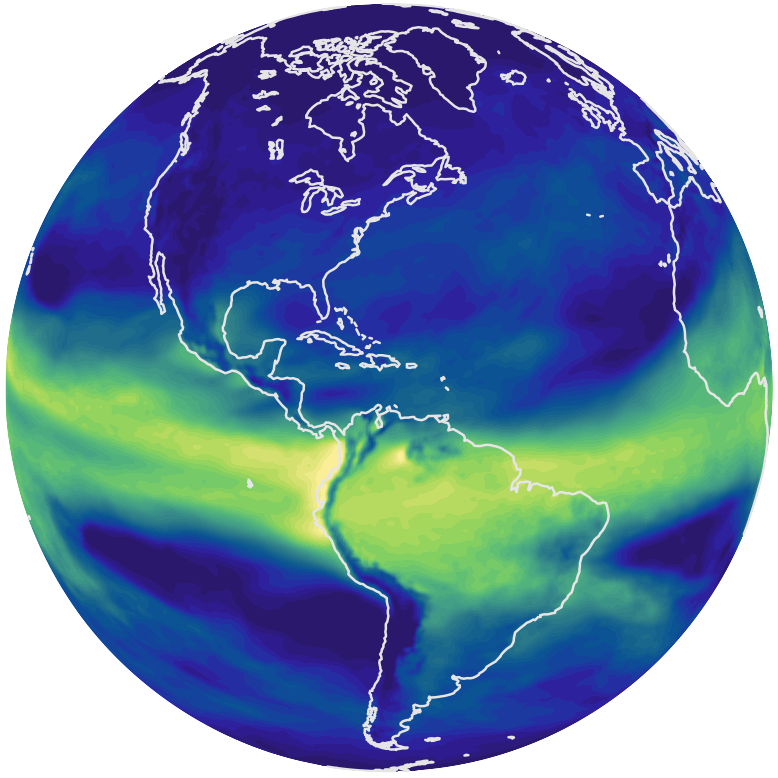
Saving the Visualization 
In addition to saving the state of the current session so that the analysis can be resumed later, QuickCompare provides three ways for the user to save the visualization as images:
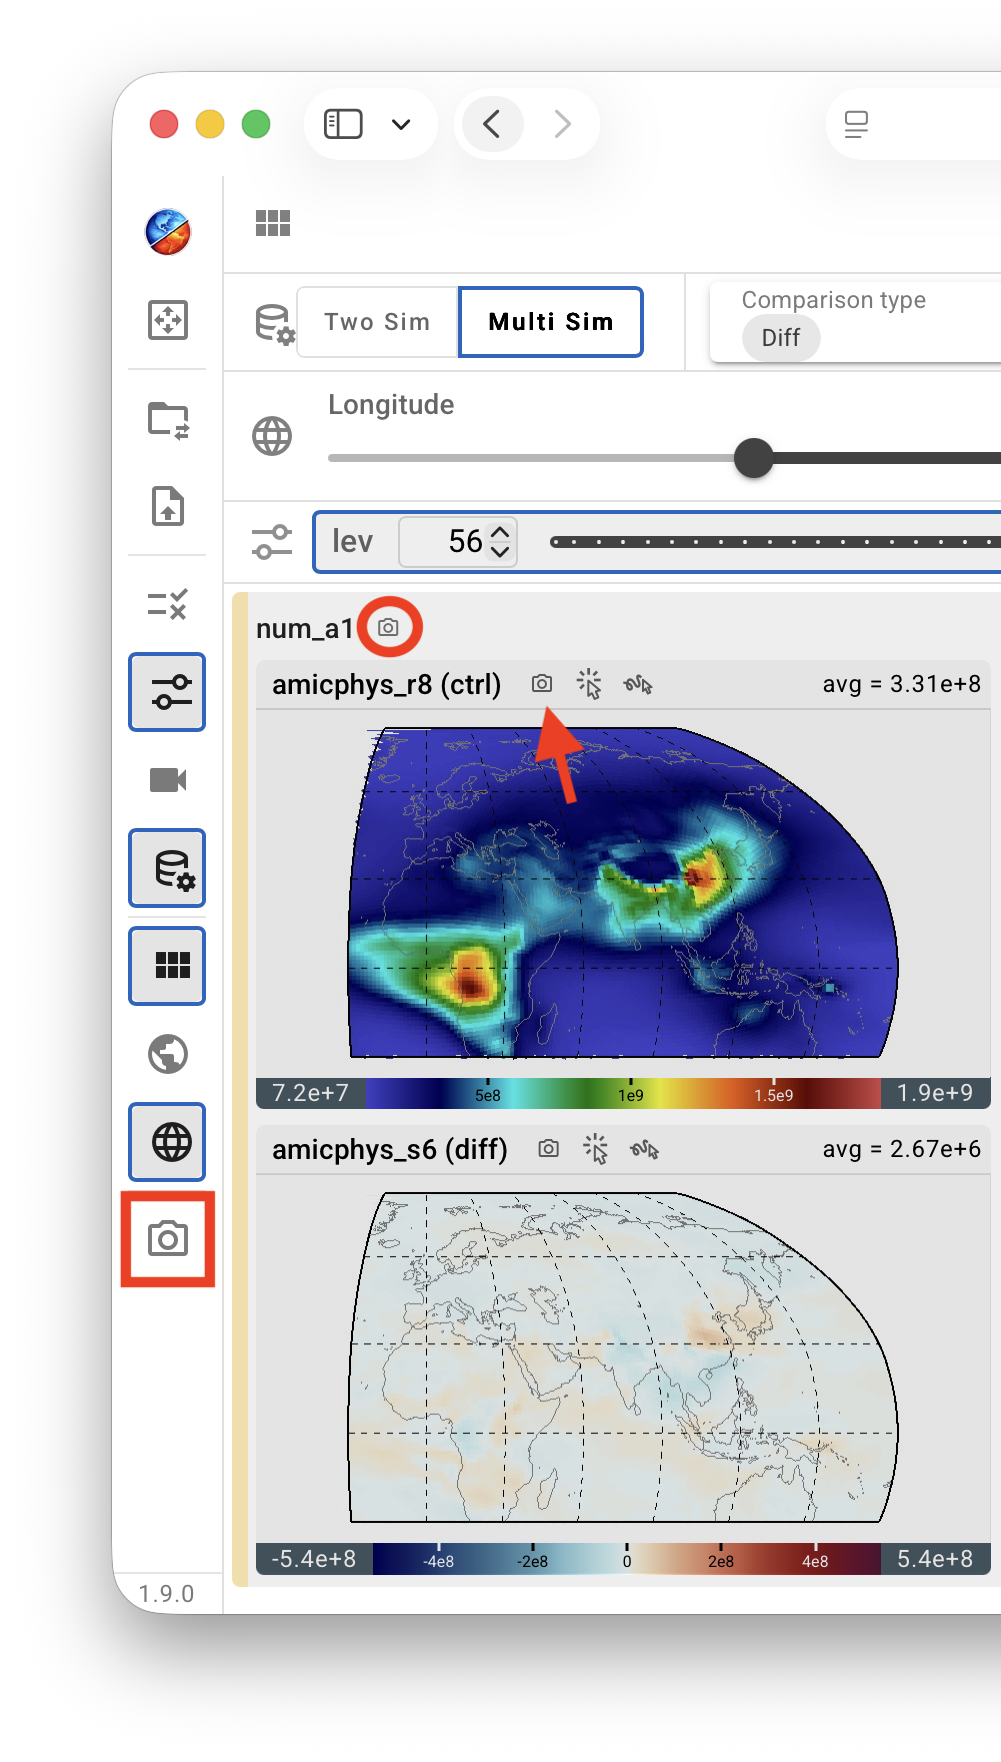
A click on the camera icon at the end of the vertical toolbar saves the viewport—in its current layout—to the local computer as a
.pngfile with a filename starting withViewport.A click on the camera icon next to the variable name in the upper-left corner of each row of plots in the two-simulation mode mode—or each section of plots in the multi-simulation mode mode— saves that row or section as a
.pngfile. The filename starts with the variable name; dimension names and indices are appended when relevant.A click on the camera icon above each plot saves that single plot (view) as a
.pngfile.
Given the large amount of views (plots) typically involved in a QuickCompare session resulting from loading multiple simulations and variables as well as the different metrics (i.e., physical quantities themselves and various differences), QuickCompare currently does not offer animation download, but the developers are open to user feedback.