Customizing Viewport Layout 
Tip for users of QuickView version 1
QuickView version 1 allowed the user to change the sizes and locations of different contour plots in the viewport by drag-and-drop. Users' feedback indicated that arbitrary drag-and-drop can get confusing, and it was inconvenient to not have a way to reapply the same size to all views. With these comments in mind, we have changed the mechanisms for configuring the viewport in version 2.
View size 
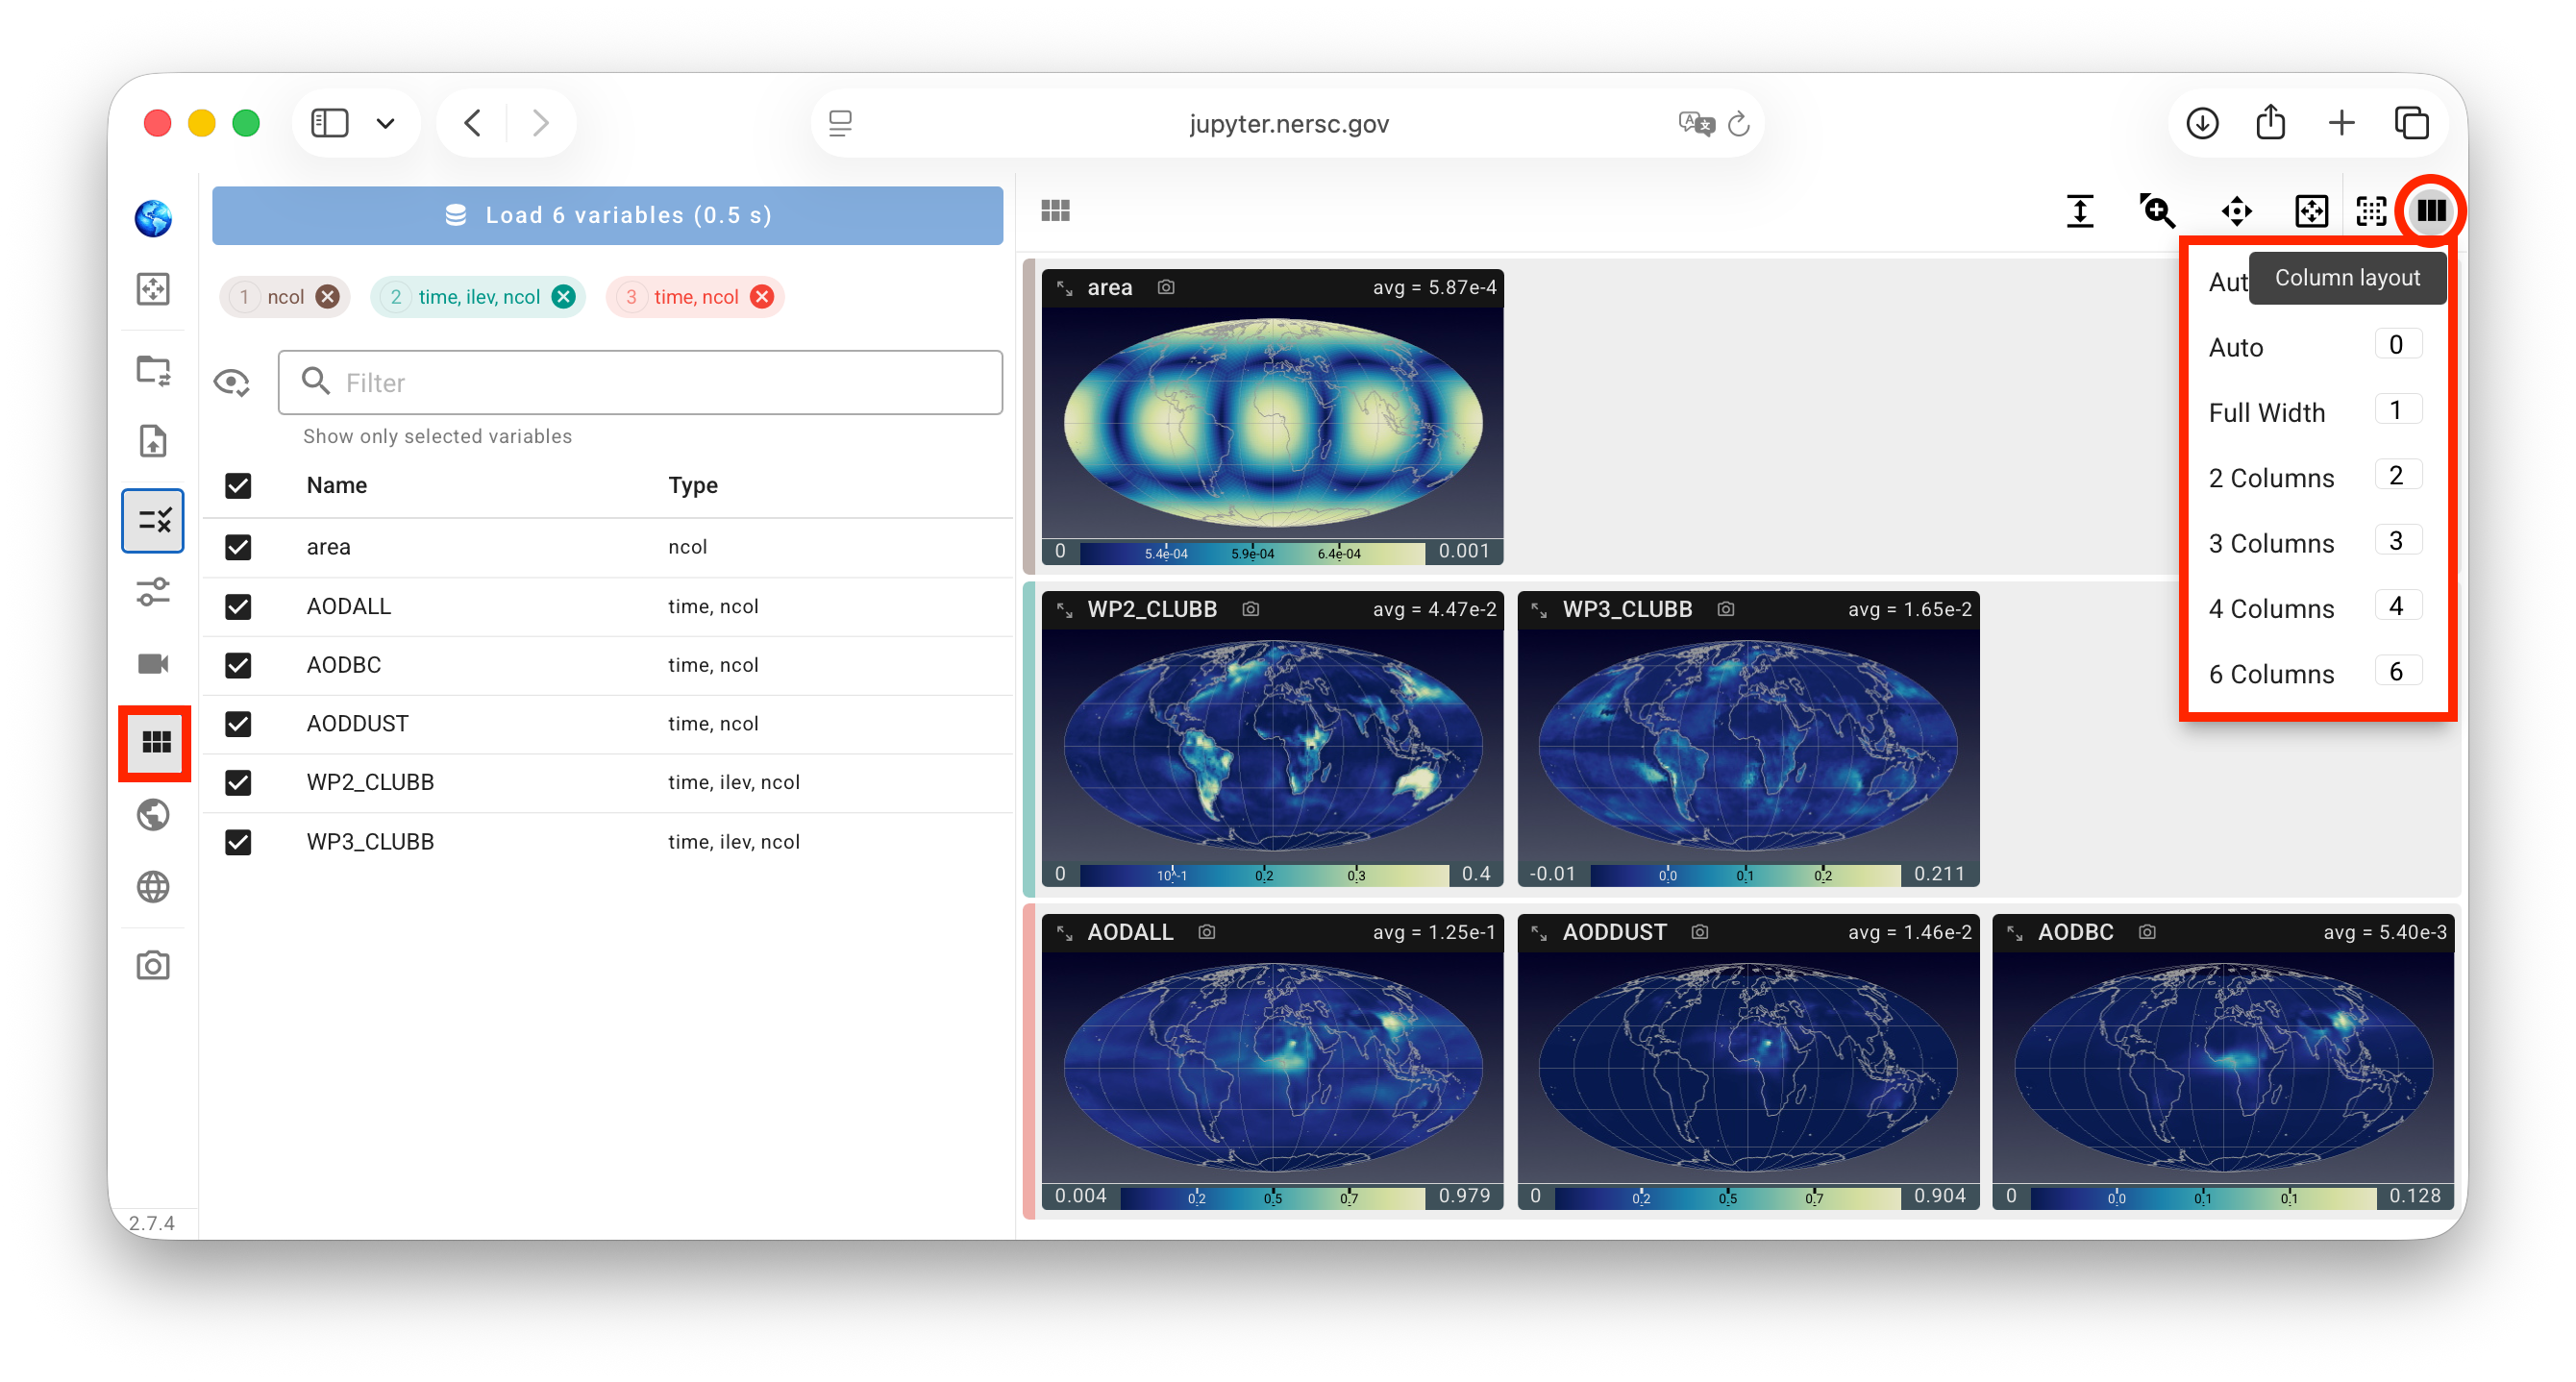
QuickView version 2 supports showing 1, 2, 3, 4, or 6 columns of views (contour plots) in the view port. The number of columns can be changed by pressing the corresponding number keys on the keyboard or using the viewport layout control panel, via the "Column layout" menu on the right of that panel, as shown in the screenshot below. The viewport is evenly divided into the selected number of columns. When the user changes the width of their browser window, the individual views are automatically readjusted.
Grouped or ungrouped views 
If the selected variables have different shapes, the contour plots are grouped by shape by default. Each group is identified by a vertical bar on the left side of the viewport, shown in the same color as the corresponding group tab in the variable selection control panel. The screenshot above shows three variable groups.
This grouping in the viewport can be canceled (or reapplied) by using the G key or a "Grouped" versus "Ungrouped" toggle.
Sequence of variables in the viewport 
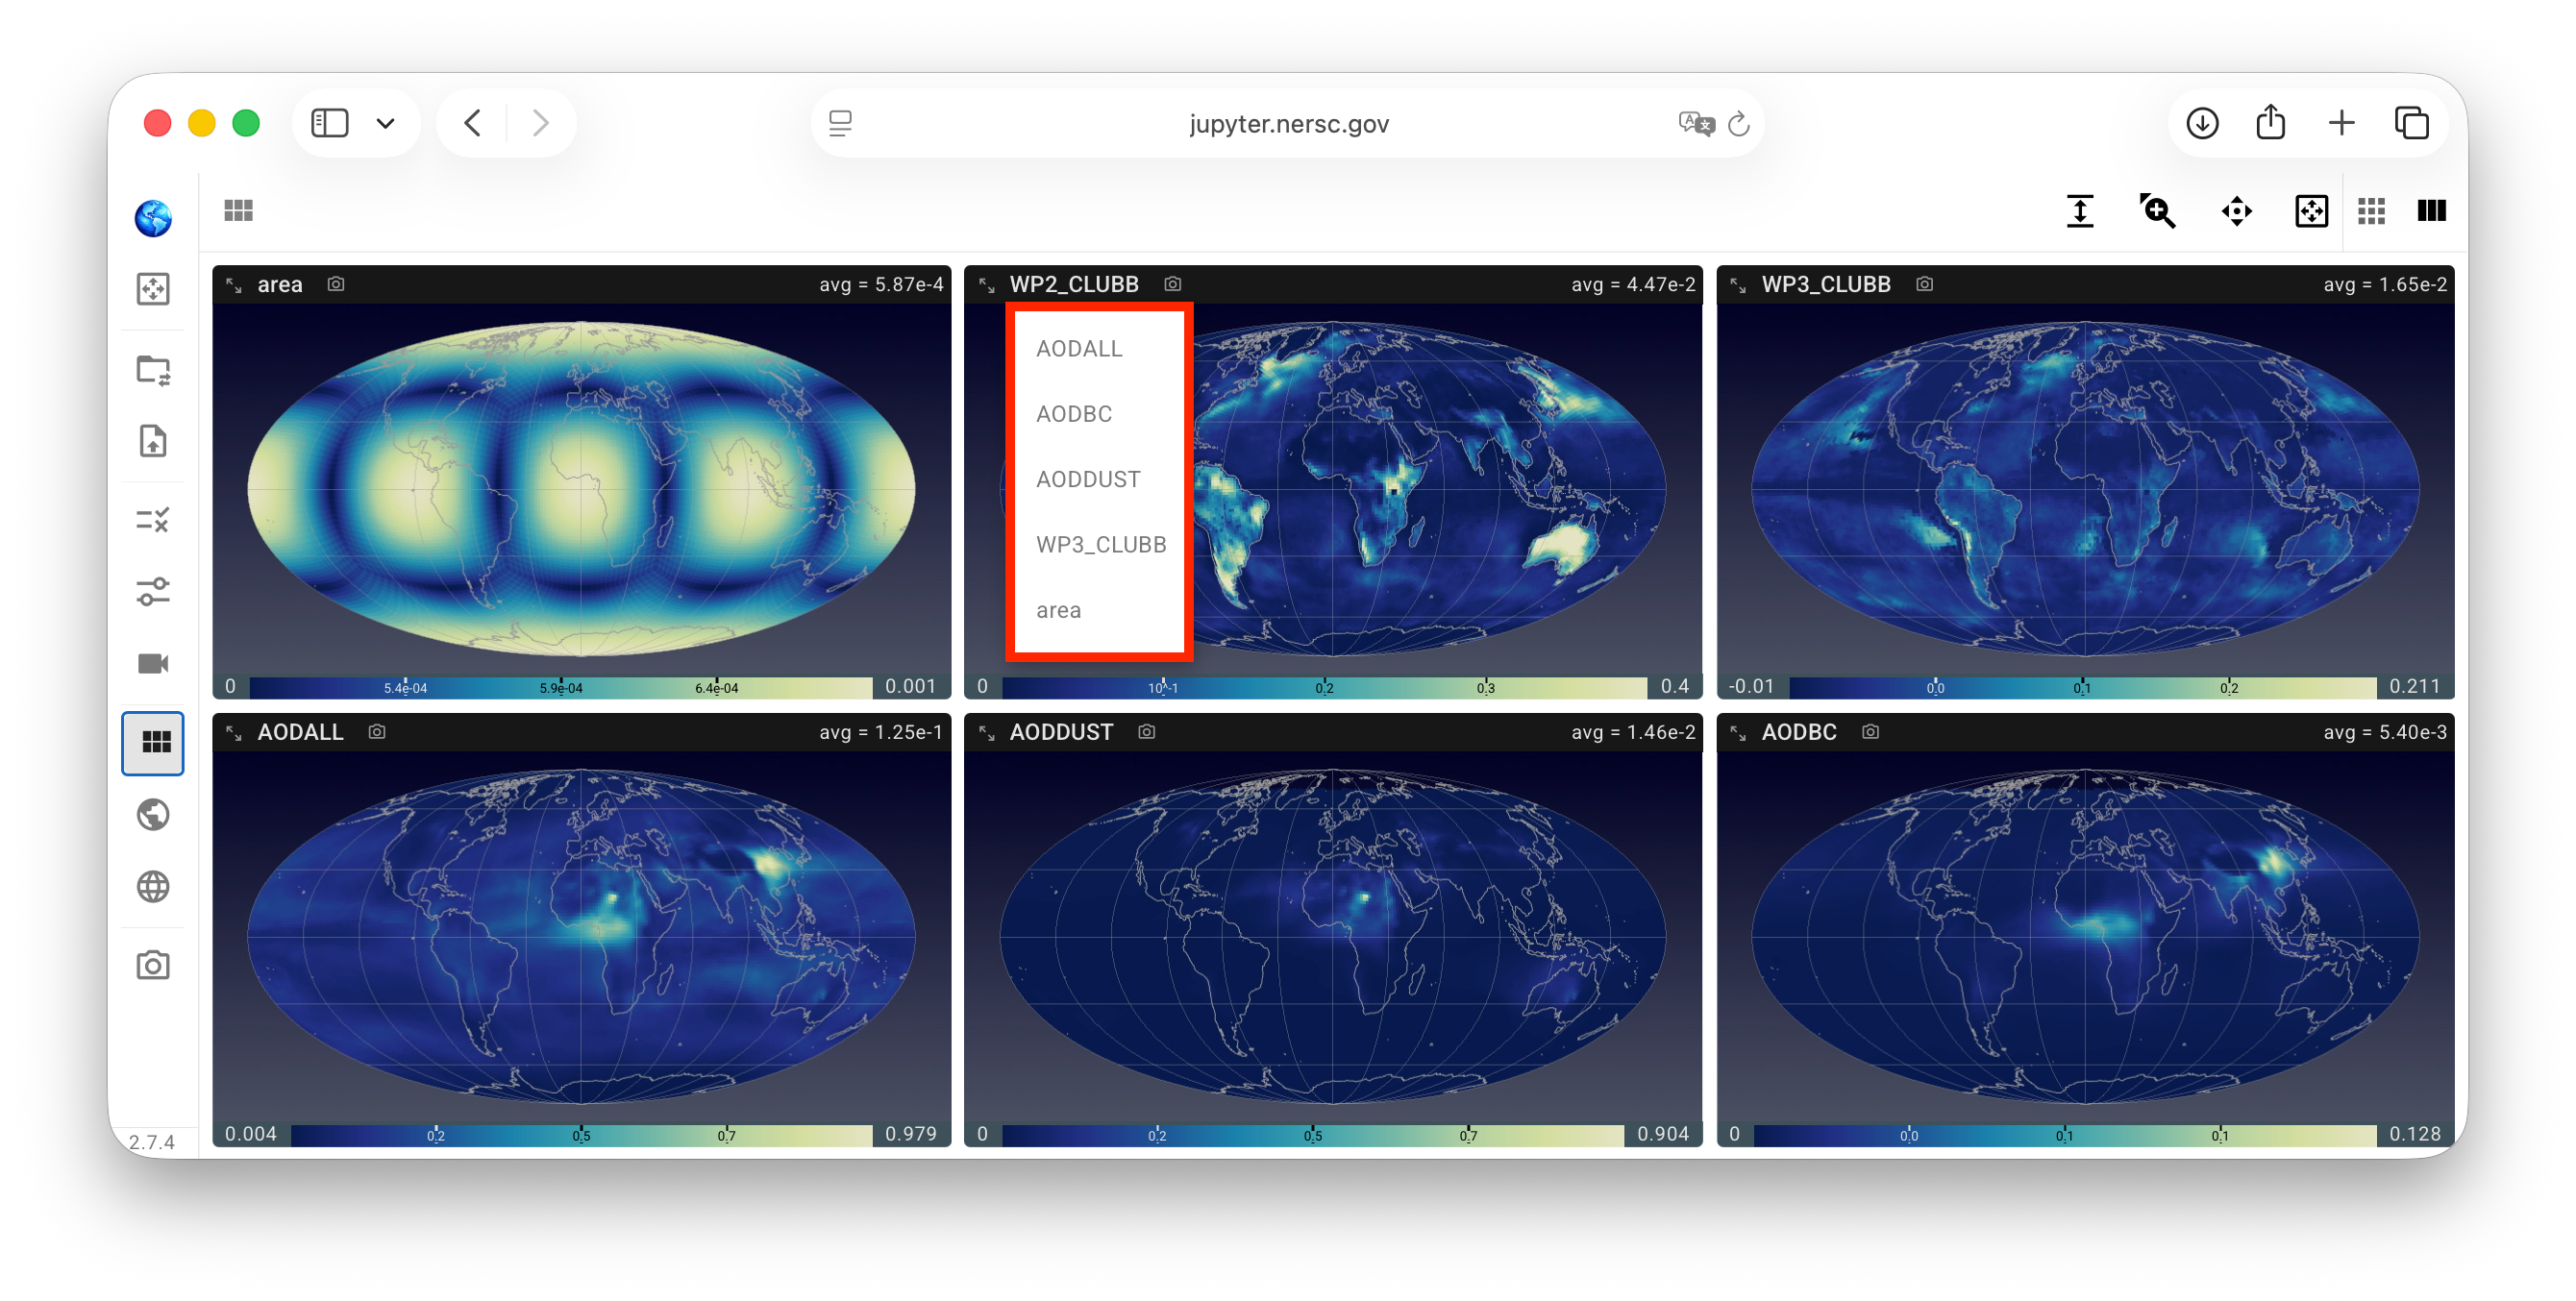
In the top-left corner of each individual view, the variable name is shown. A click on the text activates a drop-down menu for the user to replace the current variable by a different one, resulting in the corresponding views to swap contents.
- When the plots in the viewport are ungrouped, the drop-down menu lists all the other variables that have been loaded. See example in the screenshot below.
- When the plots in the viewport are grouped, the drop-down menu lists all the other loaded variables in the same group that the user can choose from.
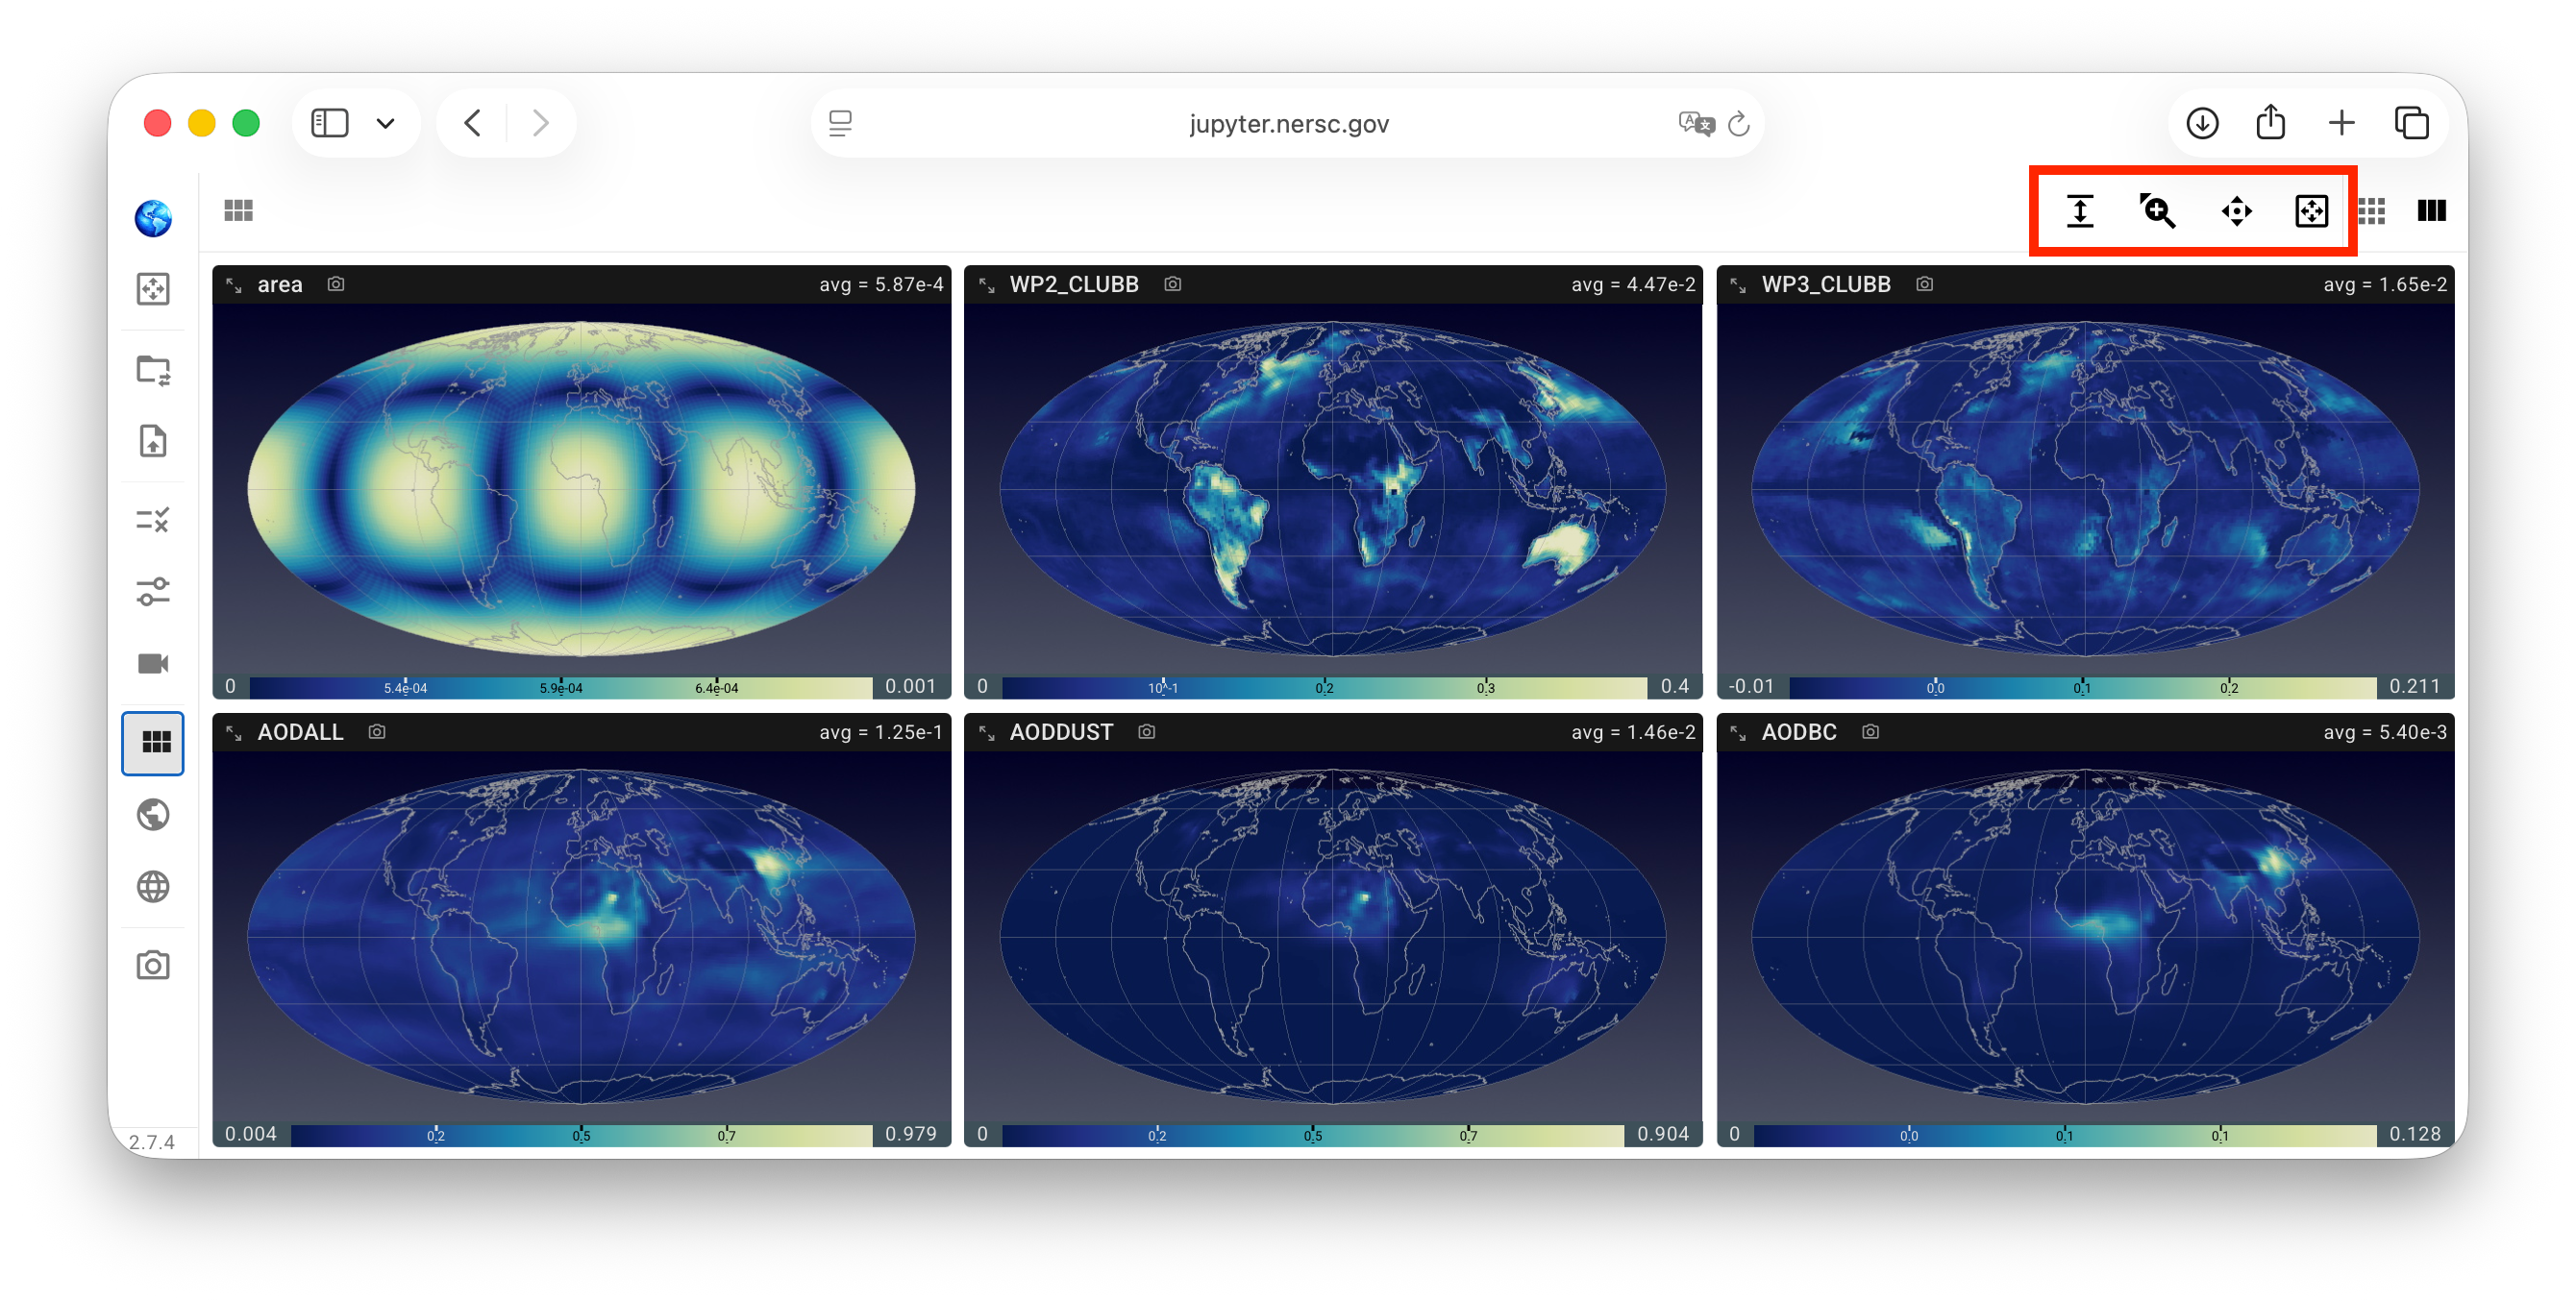
Additional adjustments 
The viewport layout control panel has a few other toggles that, upon click, reveal additional sliders or buttons for simultaneously adjusting all views in the viewport, as shown in the screenshot below and explained in more detail in the subsequent subsections.
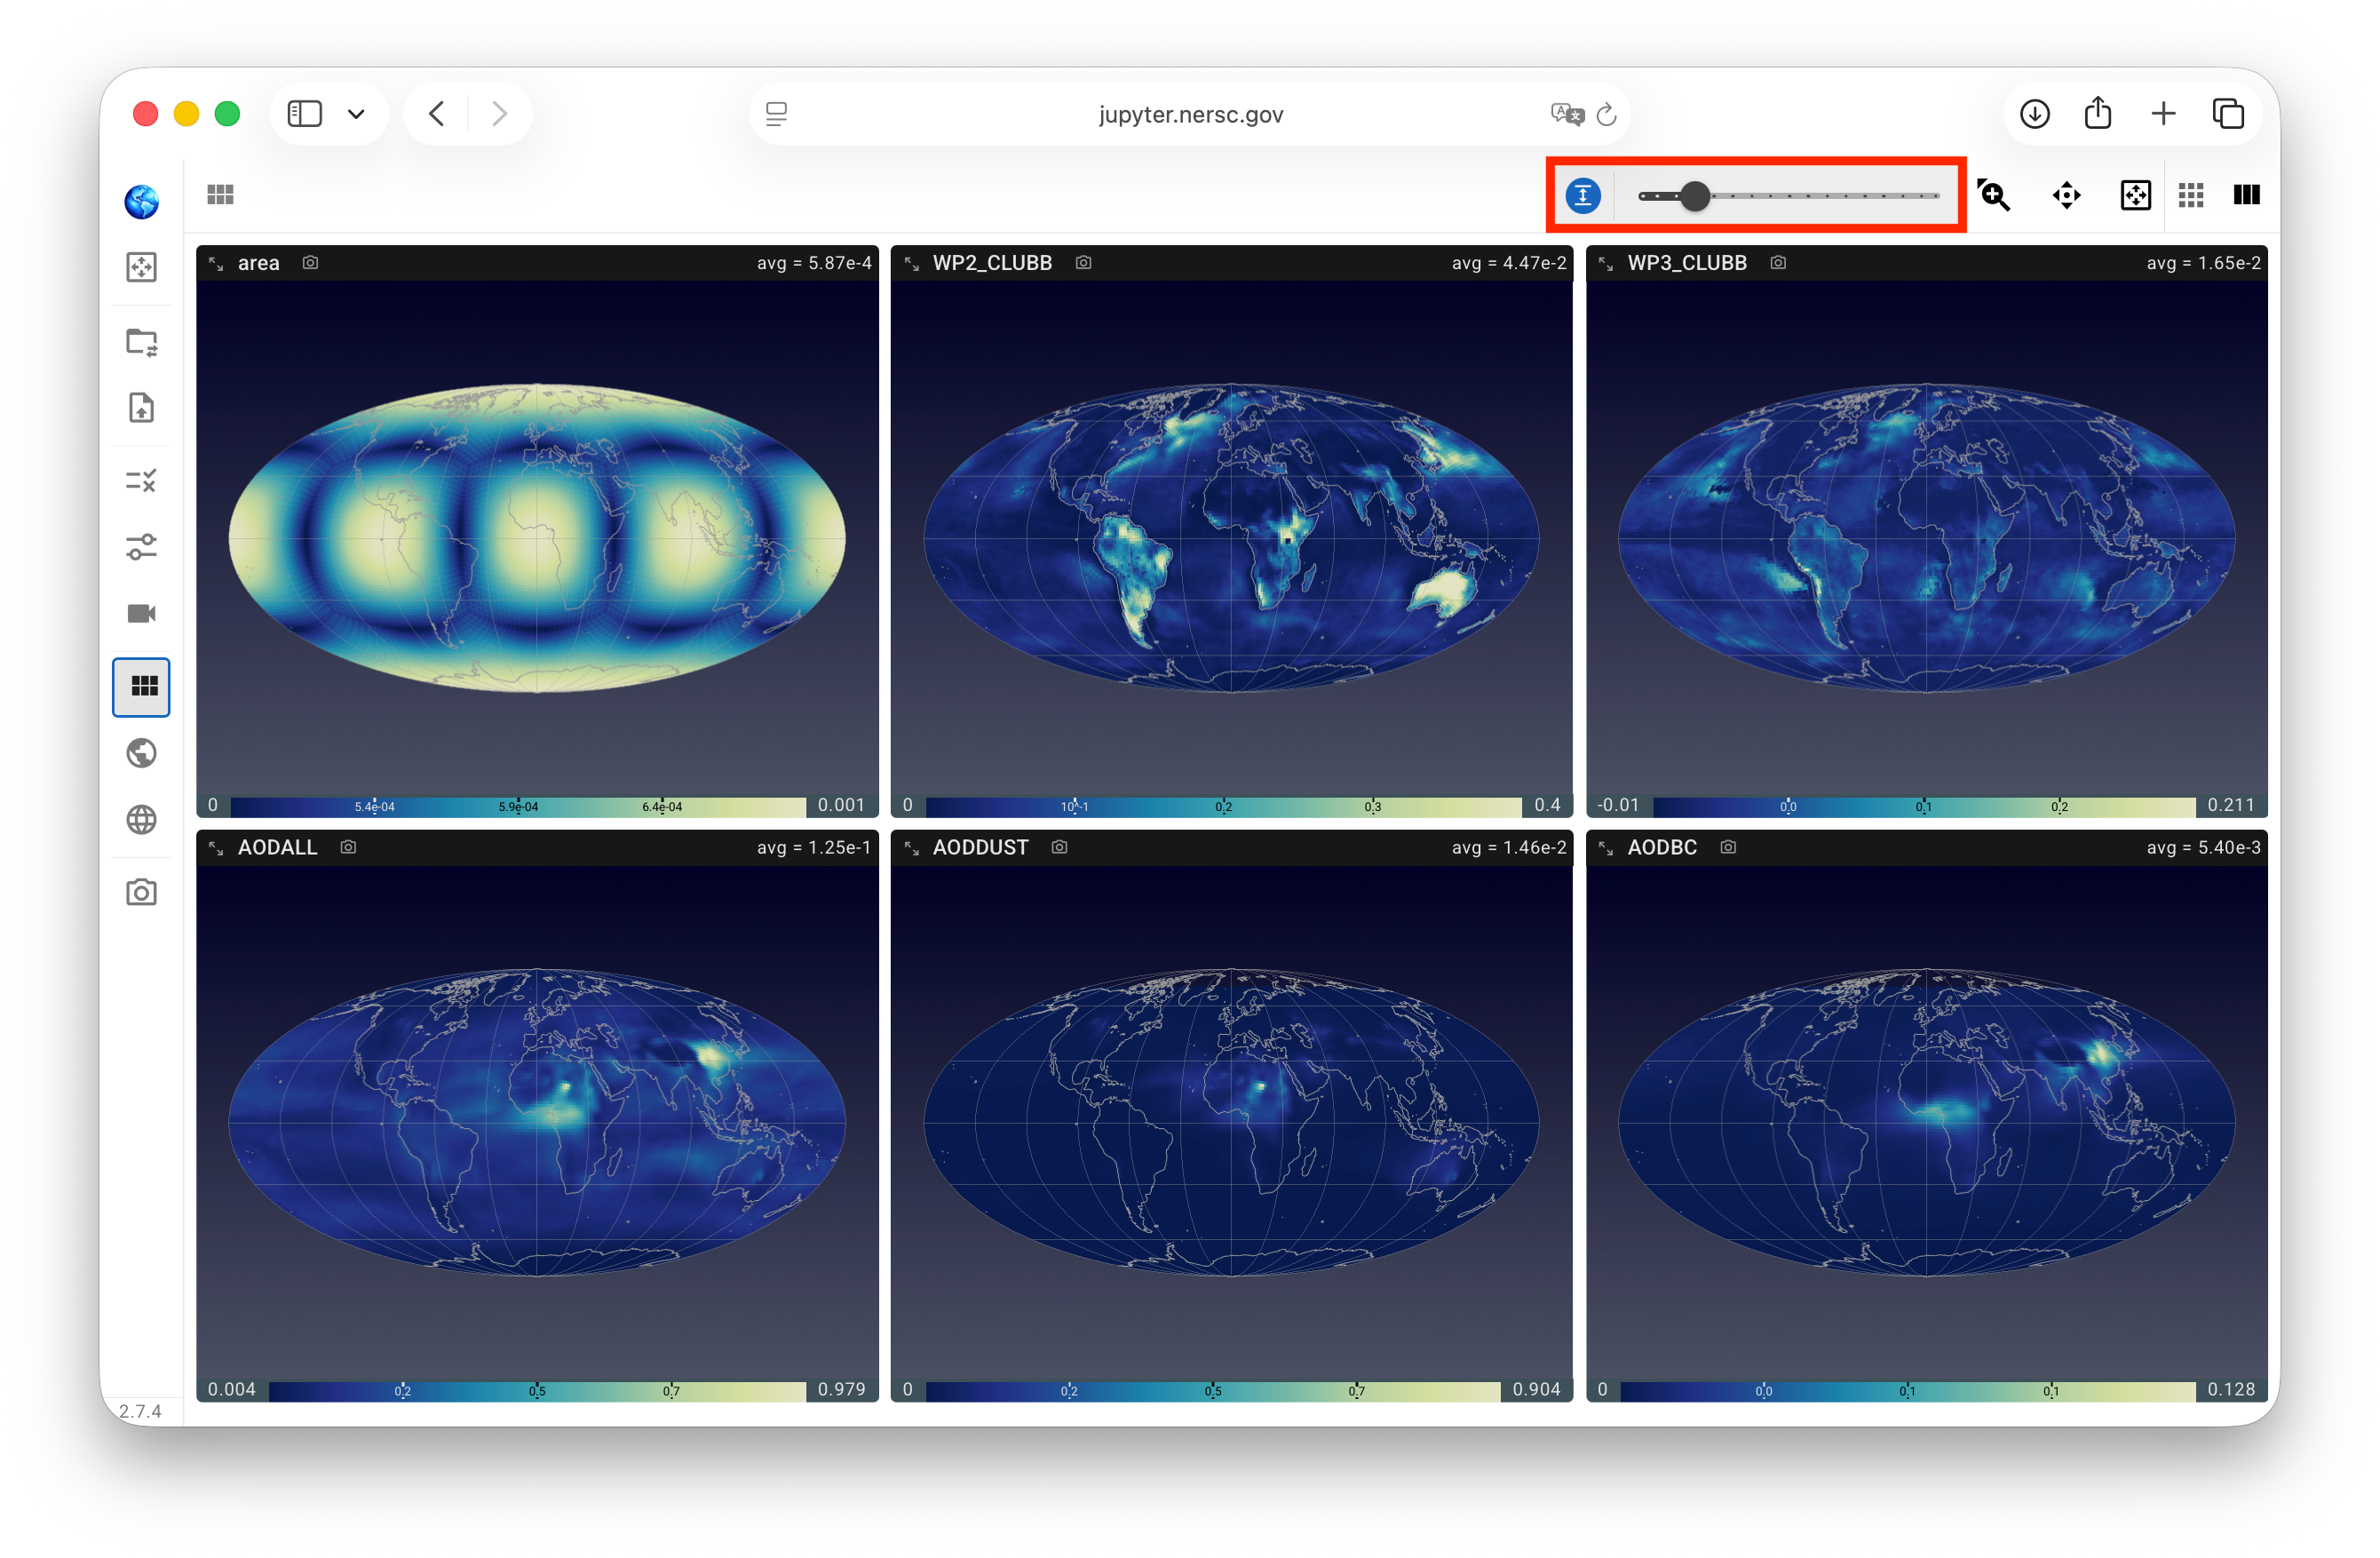
Aspect ratio of view frame 
A slider is provided for adjusting the aspect ratio of the view frames by changing their heights. This can be useful for controlling the blank spaces, especially for regional plots.
Plot size relative to view frame 
A pair of zoom-in and zoom-out buttons are provided for changing the plot sizes with respect to the view frames. A click on the auto-zoom button resets the sizes to fit the frames.
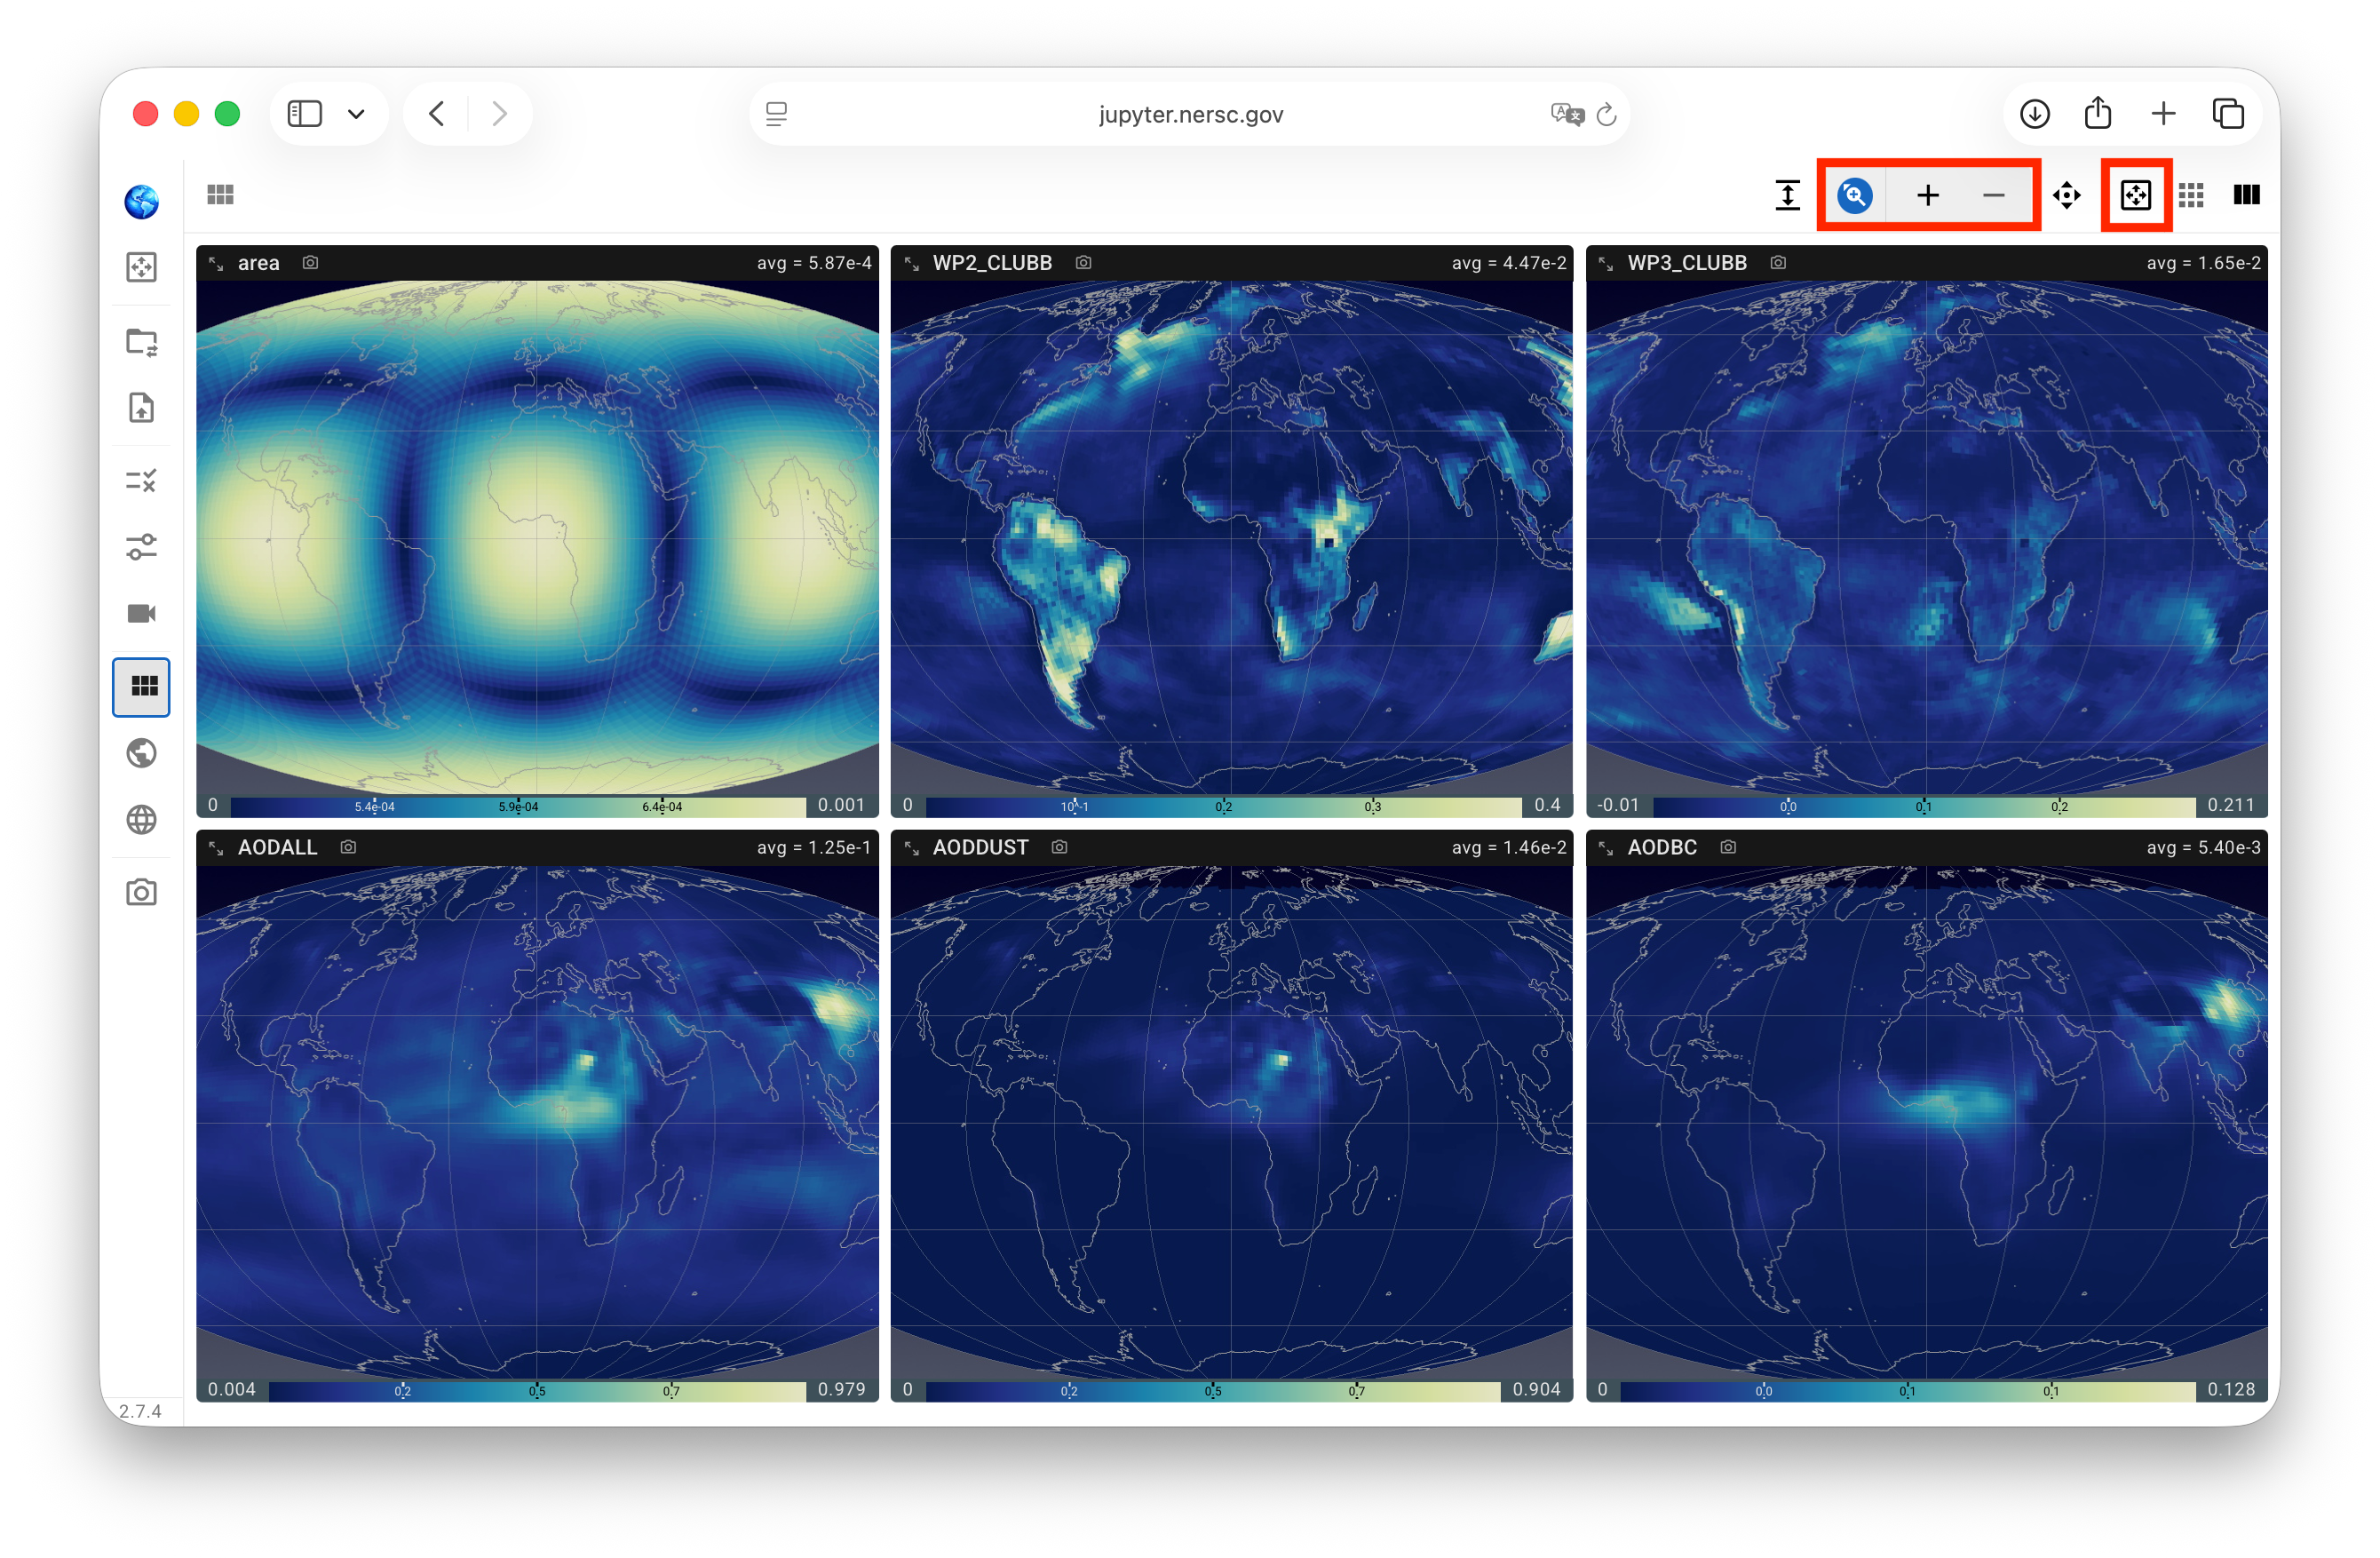
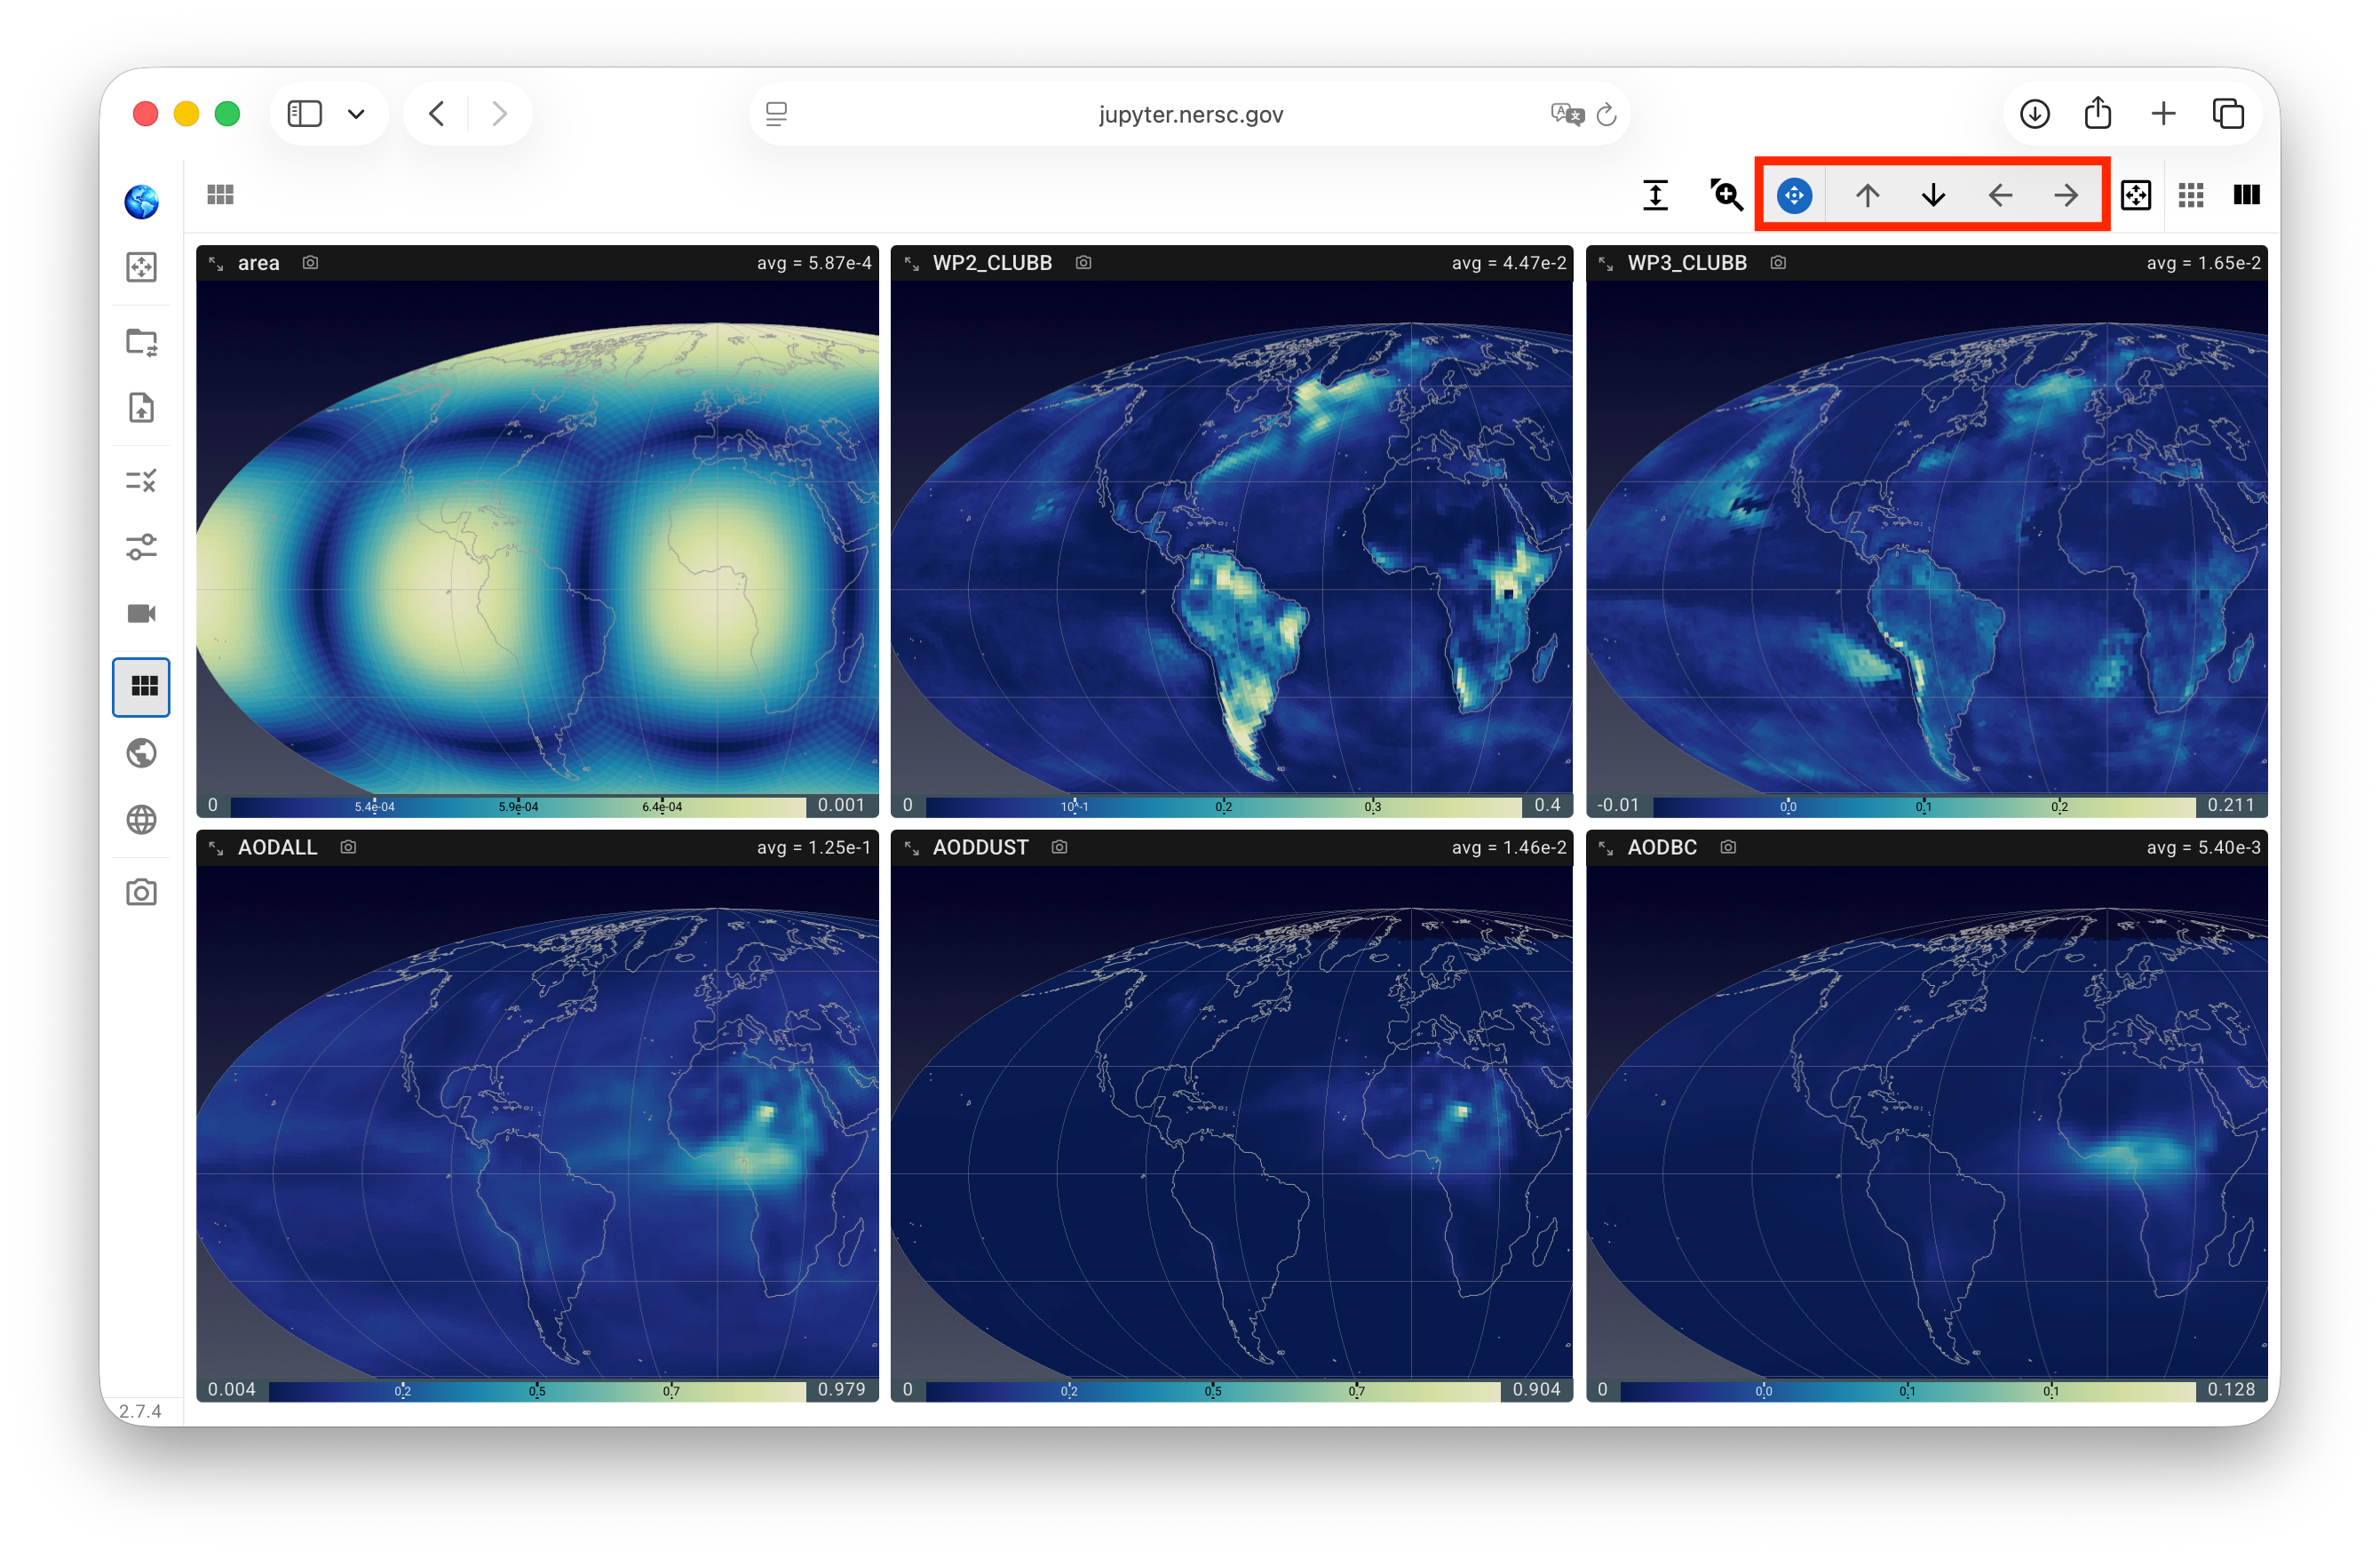
Plot location inside view frame 
A set of four buttons is provided for moving the plots left, right, up, or down with respect to the view frames, an operation commonly referred to as panning in graphical user interfaces. When the pan menu is expanded as in the screenshot below, the four arrow keys on the keyboard can also be used for panning.