

Application
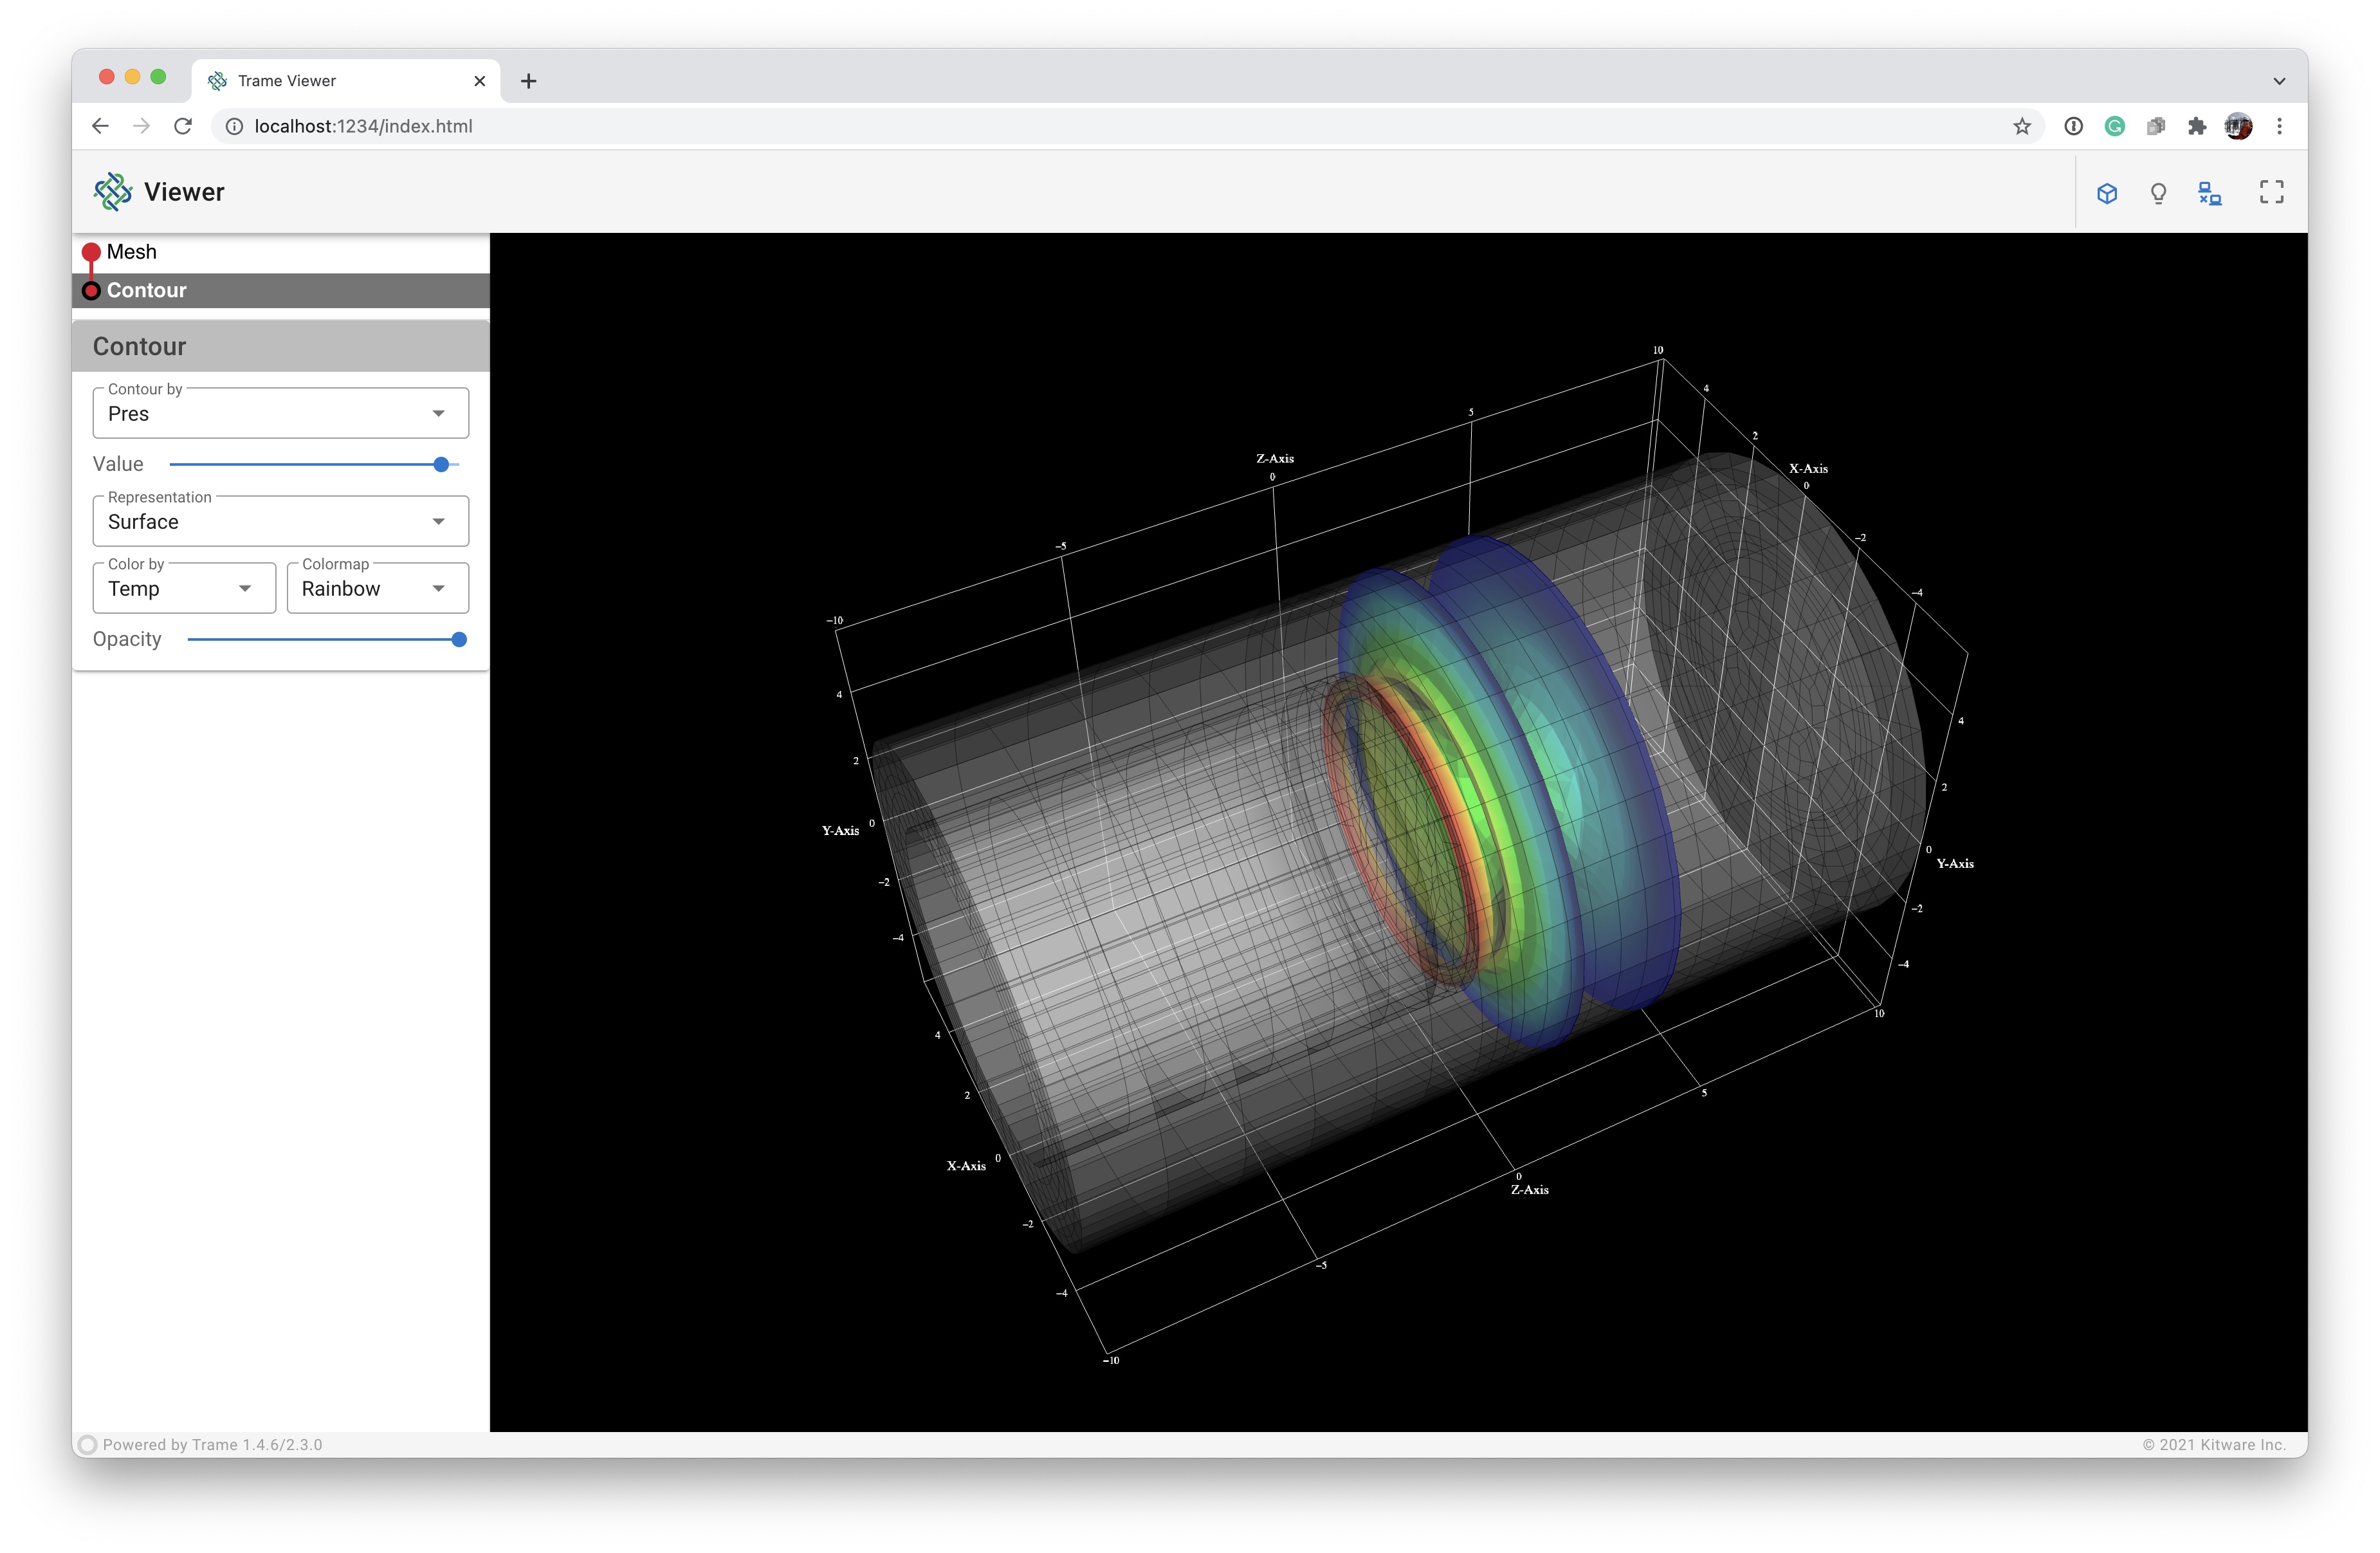
In the following we will create a more complete example application to demonstrate how to use several parts the trame library. Developing a trame application requires the following coding steps:
- Imports for appropriate trame and vtk modules
- Create the necessary VTK pipelines
- Build trame Views
- Define the the GUI components required for interaction
- Develop the callbacks for the GUI components
- Start the application
We will start by editing 04_application/app.py which contain the basic structure of a trame app with the VTK rendering code base.
Imports
First, our trame imports have also changed. Thus, we will replace
from trame.app import TrameApp
from trame.ui.vuetify3 import SinglePageLayout
from trame.widgets import vuetify3 as v3
from trame.widgets import vtk
By
from trame.app import TrameApp
from trame.ui.vuetify3 import SinglePageWithDrawerLayout
from trame.widgets import vuetify3 as v3
from trame.widgets import vtk, trame
from trame.decorators import change
Because we are adding trame to the list of widgets, we should add it to our environment by running
pip install trame-componentsWe are creating a single page application with a drawer (trame.ui.vuetify3), and we want to use one of trame's predefined widgets (trame.widgets) for displaying and interacting with visualization pipelines.
Finally, our VTK pipelines are fairly straight forward, but not available as one of the VTK examples. We will add the import for our VTK objects.
from vtkmodules.vtkCommonDataModel import vtkDataObject
from vtkmodules.vtkFiltersCore import vtkContourFilter
from vtkmodules.vtkIOXML import vtkXMLUnstructuredGridReader
from vtkmodules.vtkRenderingAnnotation import vtkCubeAxesActor
to create a three-dimensional (3D) mesh, a contour, and a cube axes legend to outline the computational domain.
VTK Pipelines
First, we read the data using the vtkXMLUnstructuredGridReader and the full file path, provided by adding CURRENT_DIRECTORY to the beginning of the relative file path.
# Read Data
reader = vtkXMLUnstructuredGridReader()
reader.SetFileName(os.path.join(CURRENT_DIRECTORY, "../data/disk_out_ref.vtu"))
reader.Update()Second, we determine the available data arrays and build an array of dictionaries, dataset_arrays that contains the array name, value or id, range, and type (point or cell data). We also define the default array and the default minimum and maximum of the default array.
# Extract Array/Field information
dataset_arrays = []
fields = [
    (reader.GetOutput().GetPointData(), vtkDataObject.FIELD_ASSOCIATION_POINTS),
    (reader.GetOutput().GetCellData(), vtkDataObject.FIELD_ASSOCIATION_CELLS),
]
for field in fields:
    field_arrays, association = field
    for i in range(field_arrays.GetNumberOfArrays()):
        array = field_arrays.GetArray(i)
        array_range = array.GetRange()
        dataset_arrays.append(
            {
                "text": array.GetName(),
                "value": i,
                "range": list(array_range),
                "type": association,
            }
        )
default_array = dataset_arrays[0]
default_min, default_max = default_array.get("range")
The dataset_arrays and defaults are used in several places of the initial pipelines, but we plan to enable switching between the available arrays for coloring and contouring.
Third, we create the mesh pipeline, which is simply a vtkDataSetMapper and a vtkActor that we add to the renderer.
# Mesh
mesh_mapper = vtkDataSetMapper()
mesh_mapper.SetInputConnection(reader.GetOutputPort())
mesh_actor = vtkActor()
mesh_actor.SetMapper(mesh_mapper)
renderer.AddActor(mesh_actor)
We want to be able to change the mesh representation, so we get a handle on the mesh_actor property and set the representation to surface, set the default point size, and turn off edge visibility.
# Mesh: Setup default representation to surface
mesh_actor.GetProperty().SetRepresentationToSurface()
mesh_actor.GetProperty().SetPointSize(1)
mesh_actor.GetProperty().EdgeVisibilityOff()
We also want to be able to change the mesh color map, so we get a handle on the mesh's color lookup table and set the hue, saturation, and value ranges to create a rainbow color map, and build it.
# Mesh: Apply rainbow color map
mesh_lut = mesh_mapper.GetLookupTable()
mesh_lut.SetHueRange(0.666, 0.0)
mesh_lut.SetSaturationRange(1.0, 1.0)
mesh_lut.SetValueRange(1.0, 1.0)
mesh_lut.Build()
We finally want to be able to change how to color the array or field data, so we retrieve a handle on the mesh's mapper and set the array to color by and the range of the array to the defaults, tell the mapper to use the appropriate scalar mode for the array, turn on the scalar visibility, and tell the mapper to use the scalar range assigned to the lookup table.
# Mesh: Color by default array
mesh_mapper.SelectColorArray(default_array.get("text"))
mesh_mapper.GetLookupTable().SetRange(default_min, default_max)
if default_array.get("type") == vtkDataObject.FIELD_ASSOCIATION_POINTS:
    mesh_mapper.SetScalarModeToUsePointFieldData()
else:
    mesh_mapper.SetScalarModeToUseCellFieldData()
mesh_mapper.SetScalarVisibility(True)
mesh_mapper.SetUseLookupTableScalarRange(True)Fourth, we create the contour pipeline, which uses a vtkContourFilter, a vtkDataSetMapper, and a vtkActor that we add to the renderer.
# Contour
contour = vtkContourFilter()
contour.SetInputConnection(reader.GetOutputPort())
contour_mapper = vtkDataSetMapper()
contour_mapper.SetInputConnection(contour.GetOutputPort())
contour_actor = vtkActor()
contour_actor.SetMapper(contour_mapper)
renderer.AddActor(contour_actor)
We want to be able to change the array or field to contour by, so we define the initial value as the midpoint between the default minimum and maximum of the default array, set the default array as the input array, and set the computed contour value.
# Contour: ContourBy default array
contour_value = 0.5 * (default_max + default_min)
contour.SetInputArrayToProcess(
    0, 0, 0, default_array.get("type"), default_array.get("text")
)
contour.SetValue(0, contour_value)
We want to be able to change the contour representation, the contour color map, and the array to color by, so we initialize these defaults as we did for the mesh pipeline.
# Contour: Setup default representation to surface
contour_actor.GetProperty().SetRepresentationToSurface()
contour_actor.GetProperty().SetPointSize(1)
contour_actor.GetProperty().EdgeVisibilityOff()

# Contour: Apply rainbow color map
contour_lut = contour_mapper.GetLookupTable()
contour_lut.SetHueRange(0.666, 0.0)
contour_lut.SetSaturationRange(1.0, 1.0)
contour_lut.SetValueRange(1.0, 1.0)
contour_lut.Build()

# Contour: Color by default array
contour_mapper.SelectColorArray(default_array.get("text"))
contour_mapper.GetLookupTable().SetRange(default_min, default_max)
if default_array.get("type") == vtkDataObject.FIELD_ASSOCIATION_POINTS:
    contour_mapper.SetScalarModeToUsePointFieldData()
else:
    contour_mapper.SetScalarModeToUseCellFieldData()
contour_mapper.SetScalarVisibility(True)
contour_mapper.SetUseLookupTableScalarRange(True)Fifth, we create the cube axes, which is a vtkCubeAxesActor that we add to the renderer.
# Cube Axes
cube_axes = vtkCubeAxesActor()
renderer.AddActor(cube_axes)
The vtkCubeAxesActor requires initialization by the bounds of the domain and the renderer camera.
# Cube Axes: Boundaries, camera, and styling
cube_axes.SetBounds(mesh_actor.GetBounds())
cube_axes.SetCamera(renderer.GetActiveCamera())
cube_axes.SetXLabelFormat("%6.1f")
cube_axes.SetYLabelFormat("%6.1f")
cube_axes.SetZLabelFormat("%6.1f")
cube_axes.SetFlyModeToOuterEdges()Finally, we reset the renderer camera to initialize the view.
renderer.ResetCamera()trame Views
For this application, we want to enable dynamic switching between local and remote rendering. Thus, we will be using vtk.VtkRemoteLocalView which internally manage a local and remote trame view.
Note: The interactive_ratio implies the desired image reduction fraction to enhance the frames per second during interaction. Here we set it to 1, which means the image will not be reduced.
GUI
We are creating a single page application with a drawer using SinglePageWithDrawer. By default we get a title, toolbar, drawer, and a content section. So we instantiate a SinglePageWithDrawer with the title of "Viewer" and on_ready argument equal to html_view.update, which updates the three-dimensional visualization.
def _build_ui(self):
    with SinglePageWithDrawerLayout(self.server, theme=("theme", "light")) as self.ui:
        self.ui.title.set_text("Viewer")

        with self.ui.toolbar:
            # toolbar components
            pass

        with self.ui.drawer as drawer:
            # drawer components
            pass

        with self.ui.content:
            # content components
            with v3.VContainer(
                fluid=True,
                classes="pa-0 fill-height",
            ):
                view = vtk.VtkRemoteLocalView(renderWindow, namespace="view", mode="local", interactive_ratio=1)
                self.ctrl.view_update = view.update              # capture view update method
self.ctrl.view_reset_camera = view.reset_camera # capture view reset_camera methodNote: The self.ui.drawer as drawer syntax is used to get a reference to the drawer to set some of the drawer's properties.
Toolbar GUI

We want to create a toolbar with the application logo and title on one end and some standard buttons separated by a vertical divider on the other end. The VSpacer is used to push the content the right-side of the application toolbar, and the VDivider is used to create the vertical divider, and method standard_buttons encapsulates the GUI code to produce these buttons.
with self.ui.toolbar:
    # toolbar components
    v3.VSpacer()
    v3.VDivider(vertical=True, classes="mx-2")
    self.standard_buttons()
Three of the buttons have on/off states, so we will use a VCheckbox with the on_icon and off_icon properties and the v_model callback to switch between these states. The resetCamera button is just using the controller function to allow out-of-order initialization.
class App(TrameApp):
    # [...]
    def standard_buttons(self):
        v3.VCheckbox(
            v_model=("cube_axes_visibility", True),
            on_icon="mdi-cube-outline",
            off_icon="mdi-cube-off-outline",
            classes="mx-1",
            hide_details=True,
            density="compact",
        )
        v3.VCheckbox(
            v_model="theme",
            true_value="dark",
            false_value="light",
            true_icon="mdi-lightbulb-off-outline",
            false_icon="mdi-lightbulb-outline",
            classes="mx-1",
            hide_details=True,
            density="compact",
        )
        v3.VCheckbox(
            v_model=("viewMode", "local"), # VtkRemoteLocalView => {namespace}Mode=['local', 'remote']
            on_icon="mdi-lan-disconnect",
            off_icon="mdi-lan-connect",
            true_value="local",
            false_value="remote",
            classes="mx-1",
            hide_details=True,
            density="compact",
        )
        v3.VBtn(icon="mdi-crop-free", click=ctrl.view_reset_camera)
The dark checkbox is as the previous examples using layout's parameter (theme) reactive variable.
The viewMode checkbox is used to switch between the local and remote rendering, and leverages the VtkRemoteLocalView mode. The cube_axes_visibility checkbox is used to turn on and off the cube axes, and leverages the cube_axes_visibility callback.
Drawer GUI
We want to create a drawer with the trame pipeline widget, a horizontal divider, and pipeline cards. The pipeline cards are shown corresponding to the selected pipeline in the trame pipeline widget. We need create state for the active pipeline card, so we add this to the shared state that can be updated on the state directly.
class App(TrameApp):
    def __init__(self, server=None):
        # [...]

        # State use to track active UI card
        self.state.setdefault("active_ui", None) # prevent resetting value if already present
We want a little wider drawer, so we set the width to 325 pixels. Next, we add the trame pipeline widget using the pipeline_widget function. Then, we use a VDivider to separate the trame widget from the pipeline cards. Finally, we add the pipeline cards using the mesh_card and contour_card functions.
with self.ui.drawer as drawer:
    # drawer components
    drawer.width = 325
    self.pipeline_widget()
    v3.VDivider(classes="mb-2")
    mesh_card()
    contour_card()
Pipeline Widget
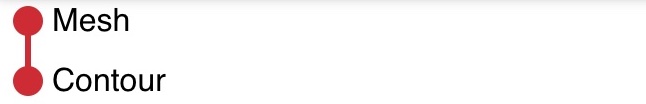
The trame widgets are easy to use. Here, we simply create the widget, define the pipelines and their relationships, and define references to the pipeline widgets two callback functions.
def pipeline_widget(self):
    trame.GitTree(
        sources=(
            "pipeline",
            [
                {"id": "1", "parent": "0", "visible": 1, "name": "Mesh"},
                {"id": "2", "parent": "1", "visible": 1, "name": "Contour"},
            ],
        ),
        actives_change=(self.actives_change, "[$event]"),
        visibility_change=(self.visibility_change, "[$event]"),
    )
Default ui_card

The default GUI card is a simple card with a title, and a body. The card itself is shown (v_show) if the ui_name is the same as active_ui. We use the VCard to create the card, and the VCardTitle to create the card title, and the VCardText to create the space to add individual pipeline GUI components. The stylings for the card colors can be found at Material Design.
def ui_card(title, ui_name):
    with v3.VCard(v_show=f"active_ui == '{ui_name}'"):
        v3.VCardTitle(
            title,
            classes="grey lighten-1 py-1 grey--text text--darken-3",
            style="user-select: none; cursor: pointer",
            hide_details=True,
            density="compact",
        )
        content = v3.VCardText(classes="py-2")
    return content
mesh_card
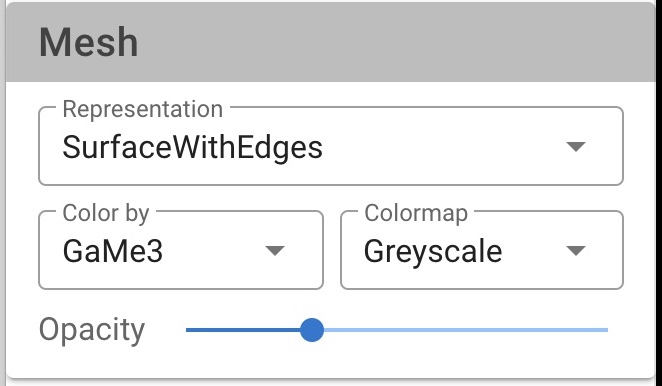
The mesh_card contains strictly default GUI components of a pipeline. First, a dropdown menu for the visual representation type. Next, a row with two columns. One contains a dropdown menu for the array/field to color by, and the other a dropdown menu for which color map to use. Finally, a slider to control the opacity.
def mesh_card():
    with ui_card(title="Mesh", ui_name="mesh"):
        v3.VSelect(
            # Representation
        )
        with v3.VRow(classes="pt-2", density="compact"):
            with v3.VCol(cols="6"):
                v3.VSelect(
                    # Color By
                )
            with v3.VCol(cols="6"):
                v3.VSelect(
                    # Color Map
                )
        v3.VSlider(
            # Opacity
        )
Since these are default pipeline elements, we will cover these items together with the contour_card individual components below.
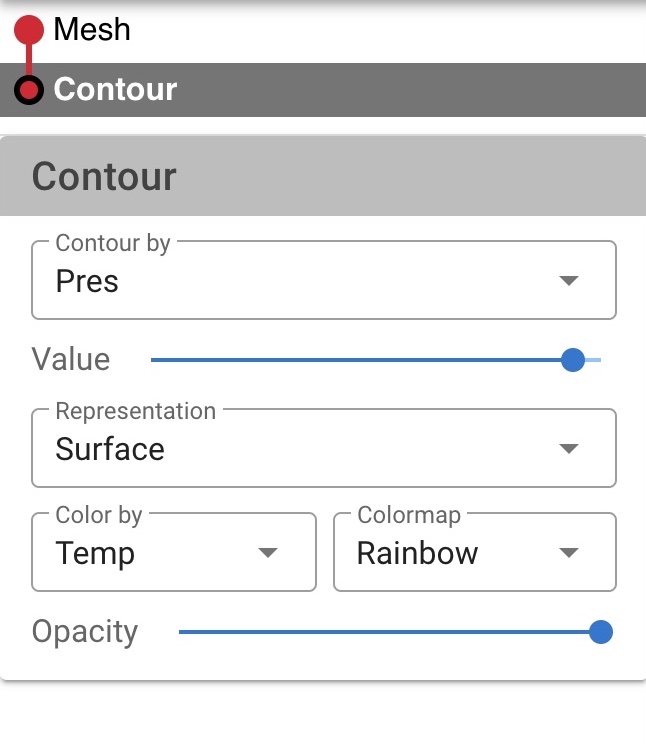
contour_card
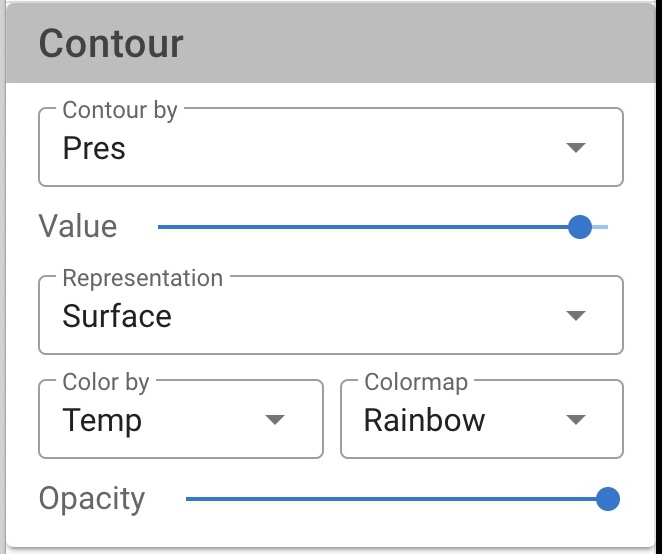
The contour_card contains a dropdown menu to select the array/field to contour by, a slider to control the contour value, and the default GUI components of a pipeline.
def contour_card():
    with ui_card(title="Contour", ui_name="contour"):
        v3.VSelect(
            # Contour By
        )
        v3.VSlider(
            # Contour Value
        )
   *    v3.VSelect(
   *        # Representation
   *    )
   *    with v3.VRow(classes="pt-2", density="compact"):
   *        with v3.VCol(cols="6"):
   *            v3.VSelect(
   *                # Color By
   *            )
   *        with v3.VCol(cols="6"):
   *            v3.VSelect(
   *                # Color Map
   *            )
   *    v3.VSlider(
   *        # Opacity
   *    )
For simplicity, we will cover these items the contour individual components below.
Note: * denotes essentially duplicate code\components from the mesh_card.
Default Components
The default components of a pipeline include the representation selection, the color by selection, the color map selection, and the opacity slider.
Representation GUI
First, we create a constant class Representation to enumerate the different representations.
class Representation:
    Points = 0
    Wireframe = 1
    Surface = 2
    SurfaceWithEdges = 3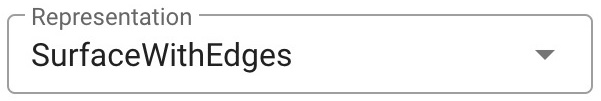
Second, we create a dropdown menu for the representation type. The VSelect component is used to create a dropdown menu. The v_model uses the state variable mesh_representation initialized to be a surface. The items is a list of dicts, where the element with the item_title parameter as key is the displayed string of the representation, and the element with the item_value parameter as key is the value of the representation used for selection.
v3.VSelect(
    # Representation
    v_model=("mesh_representation", Representation.Surface),
    items=(
        "representations",
        [
            {"text": "Points", "value": 0},
            {"text": "Wireframe", "value": 1},
            {"text": "Surface", "value": 2},
            {"text": "SurfaceWithEdges", "value": 3},
        ],
    ),
    item_title="text",
    item_value="value",
    label="Representation",
    hide_details=True,
    density="compact",
    outlined=True,
    classes="pt-1",
)
The update_mesh_representation callback is used to update the representation of the mesh.
The dropdown menu for the representation type for the contour pipeline is similar to the mesh pipeline, but replace the v_model line with the v_model line for the contour pipeline.
v3.VSelect(
    # Representation
    v_model=("contour_representation", Representation.Surface),
    # ... same as mesh ...
The update_contour_representation callback is used to update the representation of the contour.
Color By GUI
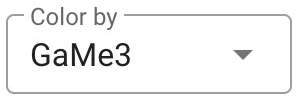
We create a dropdown menu for the color by. The VSelect component is used to create the dropdown menu. The v_model uses the state variable mesh_color_array_idx initialized to be the default_array, 0. The items is a list of tuples, where the first element is the display string (text) of the array name, and the second element is the value of the array used for selection. For items, we use the state variable array_list to create the list of arrays initialized by our dataset_arrays array of dictionaries we created at read time.
v3.VSelect(
    # Color By
    label="Color by",
    v_model=("mesh_color_array_idx", 0),
    items=("array_list", dataset_arrays),
    item_title="text",
    item_value="value",
    hide_details=True,
    density="compact",
    outlined=True,
    classes="pt-1",
)
The update_mesh_color_by_name callback is used to update the color by array of the mesh.
The dropdown menu for the color by of the contour pipeline is similar to the mesh pipeline, but replace the v_model line with the v_model line for the contour pipeline.
v3.VSelect(
    # Color By
    v_model=("contour_color_array_idx", 0),
    # ... same as mesh ...
The update_contour_representation callback is used to update the color by array of the contour.
Color Map GUI
First, we create a constant class LookupTable to enumerate the different color maps.
class LookupTable:
    Rainbow = 0
    Inverted_Rainbow = 1
    Greyscale = 2
    Inverted_Greyscale = 3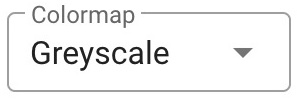
Second, we create a dropdown menu for the color map. The VSelect component is used to create a dropdown menu. The v_model uses the state variable mesh_color_preset initialized to be the rainbow color map. The items is a list of tuples, where the first element is the display string (text) of the color map, and the second element is the value of the color map used for selection.
                v3.VSelect(
                    # Color Map
                    label="Colormap",
                    v_model=("mesh_color_preset", LookupTable.Rainbow),
                    items=(
                        "colormaps",
                        [
                            {"text": "Rainbow", "value": 0},
                            {"text": "Inv Rainbow", "value": 1},
                            {"text": "Greyscale", "value": 2},
                            {"text": "Inv Greyscale", "value": 3},
                        ],
                    ),
                    item_title="text",
                    item_value="value",
                    hide_details=True,
                    density="compact",
                    outlined=True,
                    classes="pt-1",
                )
The update_mesh_color_preset callback is used to update the color map of the mesh.
The dropdown menu for the color map of the contour pipeline is similar to the mesh pipeline, but replace the v_model line with the v_model line for the contour pipeline.
                v3.VSelect(
                    # Color Map
                    v_model=("contour_color_preset", LookupTable.Rainbow),
                    # ... same as mesh ...
The update_contour_color_preset callback is used to update the color map of the contour.
Opacity GUI

We create a slider for the opacity. The VSlider component is used to create the slider. The v_model uses the state variable mesh_opacity initialized to 1.0. The min is set to 0 and the max is set to 1. The step is set to 0.1.
        v3.VSlider(
            # Opacity
            v_model=("mesh_opacity", 1.0),
            min=0,
            max=1,
            step=0.1,
            label="Opacity",
            classes="mt-1",
            hide_details=True,
            density="compact",
        )
The update_mesh_opacity callback is used to update the color map of the mesh.
The slider for the opacity of the contour pipeline is similar to the mesh pipeline, but replace the v_model line with the v_model line for the contour pipeline.
        v3.VSlider(
            # Opacity
            v_model=("contour_opacity", 1.0),
            # ... same as mesh ...
The update_contour_opacity callback is used to update the opacity of the contour.
Contour Components
Contour By GUI
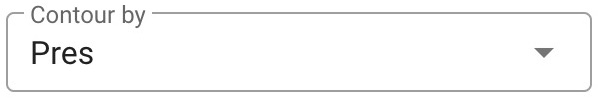
We create a dropdown menu for the contour by. The VSelect component is used to create the dropdown menu. The v_model uses the state variable contour_by_array_idx initialized to be the default_array, 0. The items is a list of tuples, where the first element is the display string (text) of the array name, and the second element is the value of the array used for selection. For items, we use the state variable array_list to create the list of arrays initialized by our dataset_arrays array of dictionaries we created at read time.
        v3.VSelect(
            # Contour By
            label="Contour by",
            v_model=("contour_by_array_idx", 0),
            items=("array_list", dataset_arrays),
            item_title="text",
            item_value="value",
            hide_details=True,
            density="compact",
            outlined=True,
            classes="pt-1",
        )
The update_contour_by callback is used to update the contour by array of the contour.
Contour Value GUI
We create a slider for the contour value. The VSlider component is used to create the slider. The v_model uses the state variable contour_value initialized to mid-point of the selected contour by array. The min is set to minimum of the contour by array and the max is set to maximum of the contour by array. The step is set to 0.01 times the range of the contour by array.

        v3.VSlider(
            # Contour Value
            v_model=("contour_value", contour_value),
            min=("contour_min", default_min),
            max=("contour_max", default_max),
            step=("contour_step", 0.01 * (default_max - default_min)),
            label="Value",
            classes="my-1",
            hide_details=True,
            density="compact",
        )
The update_contour_value callback is used to update the value of the contour.
Callbacks
Toolbar Callbacks
The first toolbar callback is the cube_axes_visibility callback, which is used to turn on and off the cube axes. The update_cube_axes_visibility function is found by the @change decorator for cube_axes_visibility. Then we simply set the cube_axes actor's Visibility property to the value of cube_axes_visibility, and update the view.
@change("cube_axes_visibility")
def update_cube_axes_visibility(self, cube_axes_visibility, **_):
    cube_axes.SetVisibility(cube_axes_visibility)
    self.ctrl.view_update()
Drawer Callbacks
- Pipeline Widget Callbacks
- Representation Callbacks
- Color By Callbacks
- Color Map Callbacks
- Opacity Callbacks
- Contour Components Callbacks
Pipeline Widget Callbacks
When a pipeline is selected in the pipeline widget, we want to update the pipeline card to show in the drawer. Using the default actives_change function of trame pipeline widget, we simply update the state element active_ui to display the pipeline card of the selected pipeline.
# Selection Change
def actives_change(self, ids):
    _id = ids[0]
    if _id == "1":  # Mesh
        self.state.active_ui = "mesh"
    elif _id == "2":  # Contour
        self.state.active_ui = "contour"
    else:
        self.state.active_ui = "nothing"
When a pipeline visibility is toggled in the pipeline widget, we want to update the view to add or remove the toggled pipeline. Using the default visibility_change function of trame pipeline widget, we update the visibility of the appropriate pipeline actor using actor.SetVisibility function with the visibility accessed from the event["visible"] dictionary element.
# Visibility Change
def visibility_change(self, event):
    _id = event["id"]
    _visibility = event["visible"]

    if _id == "1":  # Mesh
        mesh_actor.SetVisibility(_visibility)
    elif _id == "2":  # Contour
        contour_actor.SetVisibility(_visibility)
    self.ctrl.view_update()
Representation Callbacks
The update_representation function updates the representation property of an actor to the value of mode.
# Representation Callbacks
def update_representation(self, actor, mode):
    property = actor.GetProperty()
    if mode == Representation.Points:
        property.SetRepresentationToPoints()
        property.SetPointSize(5)
        property.EdgeVisibilityOff()
    elif mode == Representation.Wireframe:
        property.SetRepresentationToWireframe()
        property.SetPointSize(1)
        property.EdgeVisibilityOff()
    elif mode == Representation.Surface:
        property.SetRepresentationToSurface()
        property.SetPointSize(1)
        property.EdgeVisibilityOff()
    elif mode == Representation.SurfaceWithEdges:
        property.SetRepresentationToSurface()
        property.SetPointSize(1)
        property.EdgeVisibilityOn()
The update_mesh_representation function is found by the @change decorator for mesh_representation. We simply call the update_representation function with the mesh_actor and the mesh_representation state, and then update the view.
@change("mesh_representation")
def update_mesh_representation(self, mesh_representation, **_):
    self.update_representation(mesh_actor, mesh_representation)
    self.ctrl.view_update()
Likewise, the update_contour_representation function is found by the @change decorator for contour_representation. We simply call the update_representation function with the mesh_actor and the contour_representation state, and then update the view.
@change("contour_representation")
def update_contour_representation(self, contour_representation, **_):
    self.update_representation(contour_actor, contour_representation)
    self.ctrl.view_update()
Color By Callbacks
The color_by_array function updates the SelectColorArray of the mapper of an actor to the value of array. These operations are the same as the ones we used setting up the initial pipeline, so we will not go through the individual commands again here.
# Color By Callbacks
def color_by_array(self, actor, array):
    _min, _max = array.get("range")
    mapper = actor.GetMapper()
    mapper.SelectColorArray(array.get("text"))
    mapper.GetLookupTable().SetRange(_min, _max)
    if array.get("type") == vtkDataObject.FIELD_ASSOCIATION_POINTS:
        mesh_mapper.SetScalarModeToUsePointFieldData()
    else:
        mesh_mapper.SetScalarModeToUseCellFieldData()
    mapper.SetScalarVisibility(True)
    mapper.SetUseLookupTableScalarRange(True)
The update_mesh_color_by_name function is found by the @change decorator for mesh_color_array_idx. We simply call the color_by_array function with the mesh_actor and the array, and then update the view. The array is set using the mesh_color_array_idx state on the dataset_arrays array of dictionaries.
@change("mesh_color_array_idx")
def update_mesh_color_by_name(self, mesh_color_array_idx, **_):
    array = dataset_arrays[mesh_color_array_idx]
    self.color_by_array(mesh_actor, array)
    self.ctrl.view_update()
Likewise, the update_contour_color_by_name function is found by the @change decorator for contour_color_array_idx. We simply call the color_by_array function with the contour_actor and the array, and then update the view. The array is set using the contour_color_array_idx state on the dataset_arrays array of dictionaries.
@change("contour_color_array_idx")
def update_contour_color_by_name(contour_color_array_idx, **_):
    array = dataset_arrays[contour_color_array_idx]
    self.color_by_array(contour_actor, array)
    self.ctrl.view_update()
Color Map Callbacks
The use_preset function updates the lut, lookup table, hue, saturation, and value range for the preset. We need the actor to get the lut, and the preset to determine the hue, saturation, and value_range.
# Color Map Callbacks
def use_preset(self, actor, preset):
    lut = actor.GetMapper().GetLookupTable()
    if preset == LookupTable.Rainbow:
        lut.SetHueRange(0.666, 0.0)
        lut.SetSaturationRange(1.0, 1.0)
        lut.SetValueRange(1.0, 1.0)
    elif preset == LookupTable.Inverted_Rainbow:
        lut.SetHueRange(0.0, 0.666)
        lut.SetSaturationRange(1.0, 1.0)
        lut.SetValueRange(1.0, 1.0)
    elif preset == LookupTable.Greyscale:
        lut.SetHueRange(0.0, 0.0)
        lut.SetSaturationRange(0.0, 0.0)
        lut.SetValueRange(0.0, 1.0)
    elif preset == LookupTable.Inverted_Greyscale:
        lut.SetHueRange(0.0, 0.666)
        lut.SetSaturationRange(0.0, 0.0)
        lut.SetValueRange(1.0, 0.0)
    lut.Build()
The update_mesh_color_preset function is found by the @change decorator for mesh_color_preset. We simply call the use_preset function with the mesh_actor and the mesh_color_preset state, and then update the view.
@change("mesh_color_preset")
def update_mesh_color_preset(self, mesh_color_preset, **_):
    self.use_preset(mesh_actor, mesh_color_preset)
    self.ctrl.view_update()
The update_contour_color_preset function is found by the @change decorator for contour_color_preset. We simply call the use_preset function with the contour_actor and the contour_color_preset state, and then update the view.
@change("contour_color_preset")
def update_contour_color_preset(self, contour_color_preset, **_):
    self.use_preset(contour_actor, contour_color_preset)
    self.ctrl.view_update()
Opacity Callbacks
The update_mesh_opacity function is found by the @change decorator for mesh_opacity. We simply use a mesh_actor property and the mesh_opacity state to SetOpacity, and then update the view.
# Opacity Callbacks
@change("mesh_opacity")
def update_mesh_opacity(self, mesh_opacity, **_):
    mesh_actor.GetProperty().SetOpacity(mesh_opacity)
    self.ctrl.view_update()
The update_contour_opacity function is found by the @change decorator for contour_opacity. We simply use a contour_actor property and the contour_opacity state to SetOpacity, and then update the view.
@change("contour_opacity")
def update_contour_opacity(self, contour_opacity, **_):
    contour_actor.GetProperty().SetOpacity(contour_opacity)
    self.ctrl.view_update()
Contour Callbacks
The update_contour_by function updates the SetInputArrayToProcess of the contour filter to the value of array. These operations are the same as the ones we used setting up the initial pipeline, so we will not go through the individual commands again here.
# Contour Callbacks
@change("contour_by_array_idx")
def update_contour_by(self, contour_by_array_idx, **_):
    array = dataset_arrays[contour_by_array_idx]
    contour_min, contour_max = array.get("range")
    contour_step = 0.01 * (contour_max - contour_min)
    contour_value = 0.5 * (contour_max + contour_min)
    contour.SetInputArrayToProcess(0, 0, 0, array.get("type"), array.get("text"))
    contour.SetValue(0, contour_value)

    # Update UI
    self.state.contour_min = contour_min
    self.state.contour_max = contour_max
    self.state.contour_value = contour_value
    self.state.contour_step = contour_step

    # Update View
    self.ctrl.view_update()
the update_contour_by function is found by the @change decorator for contour_by_array_idx. We simply use the contour filter and the array, and then update the view. The array is set using the contour_by_array_idx state on the dataset_arrays array of dictionaries.
The update_contour_value function is found by the @change decorator for contour_value. We simply use a contour filter property and the contour_value state to SetValue, and then update the view.
@change("contour_value")
def update_contour_value(self, contour_value, **_):
    contour.SetValue(0, float(contour_value))
    self.ctrl.view_update()
Start
There is no change to the start function.
def main():
    app = App()
    app.server.start()

if __name__ == "__main__":
    main()
Running the Application
python ./04_application/app.py --port 1234
# or
python ./04_application/solution.py --port 1234
Your browser should open automatically to http://localhost:1234/